3 MONITORING AND CONTROL
LEARNING OUTCOMES
When you have completed this chapter you should be able to demonstrate an understanding of the following:
- the project control life cycle, including planning, monitoring achievement, identifying variances and taking corrective action;
- the nature of and purposes for which project information is gathered;
- how to collect and present progress information;
- the reporting cycle;
- how to take corrective action.
3.1 INTRODUCTION
Chapter 1 described the typical stages of a project that implements an information system. The importance of controlling the project to ensure that it conforms to the plan was stressed. In Chapter 2, the way in which the plan for a particular project is created was explained. This chapter explores the means by which a project is monitored and controlled so that it broadly fulfils its plan. The mechanism for this is the project control life cycle.
3.2 THE PROJECT CONTROL LIFE CYCLE
The project control life cycle involves the following sequence of steps:
(a) Producing a plan for the project to follow;
(b) Monitoring progress against the plan;
(c) Comparing actual progress with the planned progress;
(d) Identifying variations from the plan;
(e) Applying corrective action if necessary.
Steps (b) to (e) are repeated to continue the control cycle.
Imagine a ship’s voyage across the Channel from Dover to Calais as your project. The plan would probably involve following a certain route, aiming to arrive in Calais at a certain time. As the voyage progressed, the navigator would check the ship’s progress against the planned course. If there was a difference, he or she could then decide that a change of speed or an alteration of course was necessary – this would be corrective action. The process would, of course, continue until the ship arrived at its destination. Without this control cycle, the ship could continue on a fixed course and speed and would be very unlikely to arrive at the planned destination or at the expected arrival time.
Monitoring progress is more difficult in an IT project than in the ship example. The first question, which we tackle in the next section, is how to identify things that should be monitored. We usually know what the final objective of the project is, but how do we know how well we are progressing towards that objective?
3.3 MONITORING PROGRESS
3.3.1 What should we monitor?
The most obvious thing to monitor is the progress in creating deliverables and other, intermediate, project products, and in meeting milestones or deadlines. Difficulties however arise when you want to monitor progress and things are only partially complete. The simple answer is to break the products and deliverables into smaller components that can be assessed as complete at shorter and more frequent intervals of time – for example, software can be broken down into smaller, relatively self-contained modules.
Where this is difficult, an alternative is to assess the percentage completion of an activity or deliverable. This can be problematic. If someone is building a wall, it is easy to see when it is half finished, although even then the finishing touches may take a little extra time. In software development it is quite common to take a long time to iron out the final snags in an ‘almost finished’ product. Software is also less obviously visible than a wall.
In Chapter 6, we describe size or effort drivers. These allow us to measure the size of the job to be done. In the case of building the wall, the number of bricks would be an obvious size driver: the bigger the wall, the more bricks it will need. The size/effort driver can be used to monitor progress. For example, if we know that the bricklayer will need to lay 200 bricks to build the wall but only 50 have been laid so far, then we can assume that the job is about 25 per cent complete.
The use of resources also needs to be monitored, which in IT projects means mostly ‘human resources’ or staff time. Also, financial expenditure should be carefully monitored. In the scenario in Activity 3.1, allowing the installer to stay in an hotel between installations in the same region may save on travelling time (and fuel costs) and speed up the installation rate, but it would need to be balanced against the additional cost of accommodation. Surprisingly, however, financial expenditure on human resources is not always strictly monitored in IT projects if the project team are permanent employees in an IT department and are therefore viewed as overheads.
ACTIVITY 3.1
There are 20 boatyards owned by Canal Dreams. As part of the enhanced ebooking system, online customers will be emailed an e-ticket, containing a barcode, which they will be expected to present at the boatyard at the start of their holiday with evidence of their identity. The e-ticket requires new IT equipment to be installed at each boatyard. It has been estimated that the installer will, on average, need a day to travel to a boatyard, install the new equipment and show local staff how it is used. Twenty days (or four working weeks) have been allocated for the installation of all the equipment.
However, at the end of the first week only three boatyards have in fact been visited.
(a) How long is it likely that the installation programme will now take?
(b) What difference to the figure you have produced in (a) may be made by the following circumstances?
(i) The installer started two days late because some items of equipment had not been delivered;
(ii) The installer started with the boatyards furthest afield and needed an extra day to travel to the area and back.
In addition to delivery time and cost, the nature of deliverables needs to be monitored, in terms of both the size or scope of the deliverables and their quality. One danger is that the amount of functionality to be delivered increases because new requirements are discovered. If these additions to the work are not monitored and controlled, costs and delivery time will be affected. A further danger is that a task may appear to be completed, when in fact the poor quality of the resulting product means that the activity has to be re-opened to correct defects.
Thus time, cost and the scope of deliverables need to be balanced. For example, it may be possible to accelerate the progress of a late project by employing more staff, but this would increase the project cost. On the other hand, it may be possible to meet the deadline within the budgeted cost by reducing features in the application to be delivered – see Section 1.7.3, where timeboxing was described.
3.3.2 How should we monitor?
It is important to use both formal and informal methods of project monitoring. Formal monitoring methods include the use of written reports, email and progress meetings. The frequency, format and content of these communications should be laid down at the start of a project in a project initiation document or its equivalent.
The advantage of formal monitoring methods is that routines can be established so that people periodically focus on progress and commit themselves in writing. The disadvantage is that preparing reports can be seen as an unproductive overhead. Staff need to be convinced of the value of reporting. For example, the use of timesheets can be effective in establishing the staff effort expended on distinct aspects of projects, but staff need to be persuaded to fill them in conscientiously.
Many phrases can describe informal monitoring: keeping one’s ear to the ground, management by walking about, open door policy. All of these indicate that the manager has an awareness of what team members are experiencing. Project managers need ways of maintaining good informal lines of communication with all project staff. This enables progress and problems to be communicated more quickly than with more formal methods. However, a pitfall to avoid is the alienation of team members by over-supervision.
3.4 APPLYING CONTROL
There is no point in monitoring without control. This is done through the reporting cycle. What normally happens is that the monitoring processes described above identify some shortfalls in the progress of the project. To remedy shortfalls, control needs to be applied to the project to bring it back on course. For example, staff might be transferred from non-critical work to critical activities that have fallen behind.
The reporting cycle defined in the project initiation document identifies who should be producing progress reports, with what frequency and to whom they are sent. Remember that reporting is an overhead. Reports should therefore be concise, contain only relevant information and be circulated only to those who need them. However, more concise reports require greater effort by the writer in order to save the time of the readers. As someone once apologised: ‘I am sorry this report is so long: I didn’t have time to write a shorter one.’
The reporting structure refers to the people involved in a project at different management levels. Generally progress reporting starts at the level at which work is actually done and progresses up through a hierarchy. In an IT context this means that team leaders gather progress information from their team and report up to their project manager, who then reports to the group that has been entrusted with overall responsibility for the project (the project board, project management board or steering committee). This group would include representatives of the managers of the development team, the users and the project sponsor. They, not the project manager, would have the authority to change the objectives of the project. For example, they could allocate more resources to the project or reduce the scope of what is going to be delivered. The report to the project board or steering committee is sometimes referred to as a highlight report. The intervals at which the reports are produced and the topics they report on need to conform to the requirements of the recipients and the importance of the information conveyed. It is important to obtain formal agreement with the reporting procedures from all the parties involved.
3.5 PURPOSE AND TYPES OF REPORTING MEETINGS
3.5.1 Team meetings
These are usually attended by team members, the team leader and possibly the project manager. A weekly frequency is usually appropriate. (In some agile projects there may even be daily ‘stand-up’ meetings). A report from the team leader to the project manager will be prepared. A typical agenda would include the following:
- each individual team member’s progress against their plans;
- reasons for variances;
- expected progress – which looks forward to what each team member is going to do;
- current problems or issues;
- possible future problems – this may involve reviewing the risks that have been recorded in the project risk register (see Chapter 7) which could affect this part of the project.
It is important that all those attending have a reason for attending and a contribution to make. These meetings are often referred to as checkpoint meetings and the progress report produced in this case is a checkpoint report. (In an agile project, a backlog list identifying tasks completed and those to still to be done would be updated.) As issues are identified they may be recorded in an issues log, which will be updated as they are resolved.
3.5.2 Project board meetings
It will be recalled from Chapter 1 that project boards may have different names in different organisations – for example, steering committees or project management boards. These meetings will be attended by board members and the project manager, with secretarial support perhaps provided by a project support office. The structure and responsibilities of project boards, and the project support office, are covered in Chapter 8.
The frequency of meetings is typically monthly but the exact timing depends on the project size: larger projects may have fewer and less frequent top-level meetings, but more meetings of managers at intermediate levels. Meetings can be timed to coincide with significant project events such as the completion of a particular project phase or stage or other external triggers such as requirements for financial approvals.
Items for the agenda are similar to those for team meetings. A report from the project manager to the board is written and circulated prior to the meeting. This highlight report is condensed from the checkpoint reports produced in the preceding team meetings. The board is authorised to decide upon any necessary corrective action arising from progress information. This is fed back down the reporting chain and thus completes the reporting cycle.
The highlight report typically includes the following information:
- details of the progress of the project against the plan;
- current milestones achieved;
- deliverables completed;
- resource usage;
- reasons for any deviation from the plan;
- new issues and unresolved issues;
- changes to risk assessments;
- plans for the next period and products to be delivered;
- graphical representations of progress information.
3.5.3 Programme board/steering committee meetings
Organisations sometimes group projects into programmes, where a number of projects all contribute to a set of over-arching objectives (see Chapter 8). In these cases a programme board may be set up, to which individual project boards would report. These boards would have less frequent, less detailed meetings related to programme management, but essentially a similar agenda to those of the project boards. These would have more of a business focus than a project focus.
3.6 TAKING CORRECTIVE ACTION
Here we will examine how corrective action can be applied in a controlled way. The project manager’s role is to manage on a day-to-day basis, applying minor corrections as required. However, corrections of a more major nature will need to be referred to higher authority.
This is the reason for allocating a tolerance within which the project manager has authority to make changes or apply corrective action. For example, you, as a project manager, may be allocated 10 per cent tolerance on time and cost on a project worth £100,000 and lasting 25 weeks. This means you are authorised to agree to changes worth £10,000 or an overrun of two and a half weeks (see Chapter 4 on change control). If a situation occurred in which the project was expected to overrun by more than two and a half weeks, this would be an exception. In this case, you would need to prepare an exception report for submission to a special meeting of the project board. This exception report would probably outline a number of options designed to correct the overrun and the board would decide how to proceed.
Tolerance and contingency pools are sometimes distinguished. Tolerances can be assigned to individual activities within the project. The contingency pool is a set of resources that is controlled by the project manager and can be allocated at the discretion of the project manager where additional resources are needed. However, if the contingency is used to buy resources in one place, less will be available for other emergencies. These resources may be augmented where activities are completed early and free up resources. Where activities can be completed early, the opportunity should be seized as this will release staff to deal with unanticipated delays elsewhere.
An exception report typically includes the following information:
- background;
- reasons why the exception arose;
- options;
- risks;
- exception plans showing how the project plans need to be amended in order to implement the suggested options;
- amended business case;
- recommendations.
When the project board (or equivalent) members scrutinise the exception report, they will be particularly concerned to ensure that the business case for the project will be preserved: that is, that the costs of the project will not exceed the value of its eventual benefits. If the board are satisfied with the exception report, the project manager is given authority to proceed using the chosen option and its associated exception plan. Where monitoring reveals a shortfall in the expected progress, control is applied to bring the project back on track. There are a number of standard control strategies, which may or may not require an exception report. These are considered below.
Work harder, longer or faster
This is the most obvious approach and often appeals to more aggressive managers. However, although it may work to solve a short-term problem or to meet a critical deadline, it will fail if used too much. Staff will become tired, stressed and then demotivated. If overtime is paid, then project costs will increase, but not by as much as if the next option is used.
Increase resources
This needs to be carefully considered, particularly in software development. Resources in this context mean people; adding more does not usually increase productivity and often decreases it. The introduction of more staff involves a period of induction while they familiarise themselves with the work. The current staff will inevitably be involved in this process and the overall effect could even be to delay progress. An exception report and plan would be needed if the additional costs would go beyond the tolerances that have been agreed for the project.
Replan
Although some project activities have consumed more staff effort or taken longer than planned, others may have taken less effort or time. Internal movement of staff may therefore be possible, and this may be achieved without extra cost. Some may unkindly attribute this to poor planning, but the truth is that there will always be uncertainty about exactly how long tasks will take.
Extend the time scale
This is a frequent choice, but changes to deadlines will need negotiation, usually through the exception reporting process described above. Extending the deadline is often seen as weak management or as allowing the project to get out of control, but can be the most sensible option. It will, however, often increase costs as staff are allocated to the project for longer. However, sometimes the reason a project is late is that it has not been possible to assign all the staff originally planned, and so budget may not be a problem.
Reduce the project scope
This is an attractive option which also needs negotiation with management and drafting of an exception plan. Deliverables may be removed from the plan or delayed until after the planned project end date. This does not affect the originally planned cost or duration of the project, but the value of benefits to the user may be reduced. As noted in Chapter 1, this is the preferred solution of some agile project management approaches.
Terminate the project
If no acceptable alternative can be found, this may be the only remaining sensible action. Terminating the project would be justified if it is clear that the remaining costs of the project will exceed the projected value of its benefits when delivered. Despite this, terminating the project may be politically unacceptable.
ACTIVITY 3.2
In the Canal Dreams ebooking enhancement project, Activity G, Write software (see Figure 2.11), has been outsourced to an external software development company, XYZ. XYZ find that the task Code provisional booking is going to take five weeks rather than four. Their contract with Canal Dreams states that they will have to pay a penalty of £500 for each week of delay in delivering the software.
The options considered by the company are:
a) Be a week late and pay the penalty.
b) Split the ‘Code provisional booking function’ into two subcomponents requiring three weeks of work each and bring in an extra developer in to work in parallel with the one currently assigned to this function. Software developers cost £400 a week.
c) Get Canal Dreams to accept a delivered system on time but with some functionality missing. The supplier will agree to provide updates to implement the missing functionality at no extra charge, although this will require an additional week of coding work at a later date.
Which would be the most cost effective option for the software supplier?
3.7 GRAPHICAL REPRESENTATION OF PROGRESS INFORMATION
3.7.1 Gantt chart
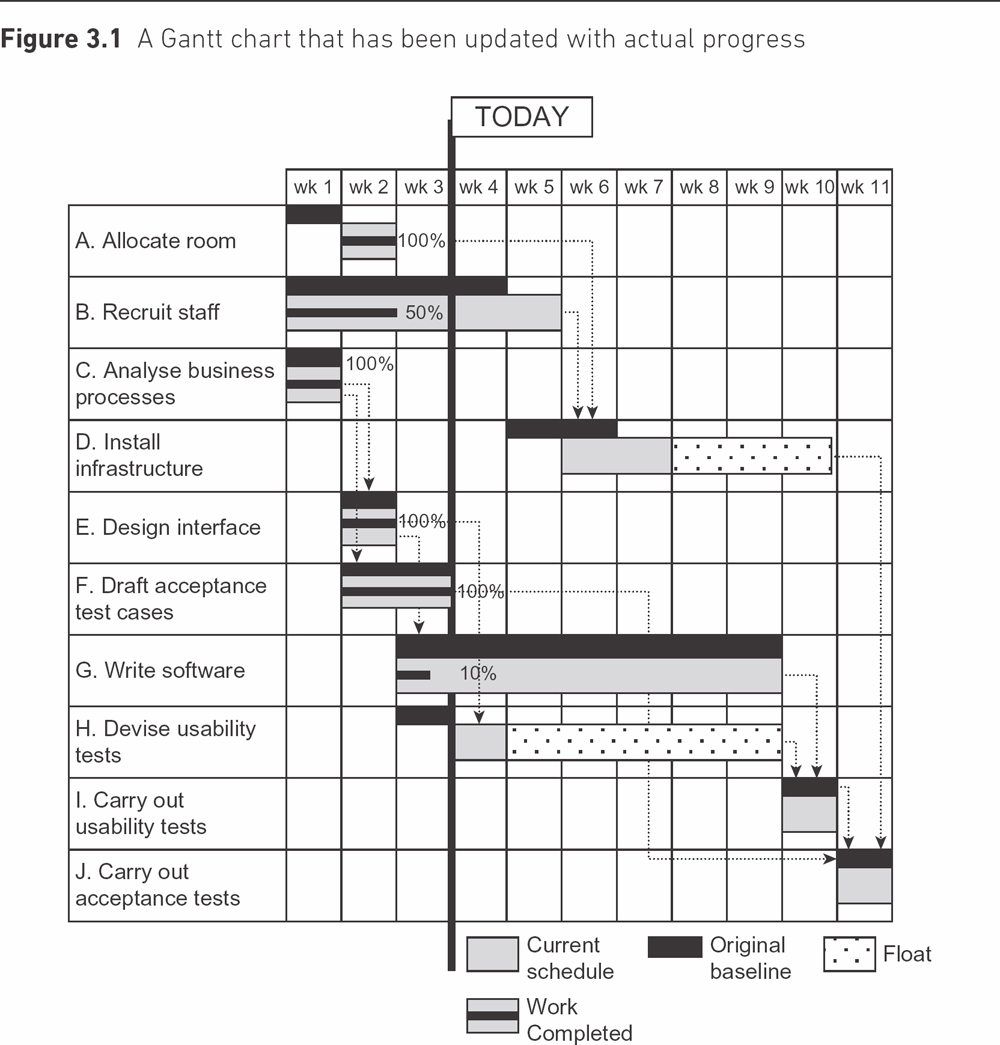
Progress information can be shown on a Gantt chart by putting a bar through an activity box showing the estimated percentage completion. Figure 3.1 shows the Gantt chart that was produced in Chapter 2, updated to show the actual situation at the end of week 3 of the project. At this point the following information could be reported:
We need to compare the current situation with the original plan. To do this, the details on the Gantt chart are baselined – that is, a snapshot is taken of the schedule at a key point. There can be several of these, but an important baseline will be the final agreed schedule at the start of the project. This is shown in Figure 3.1 by the black boxes: for instance, this shows that Task A should have started in week 1, while it actually started in week 2.
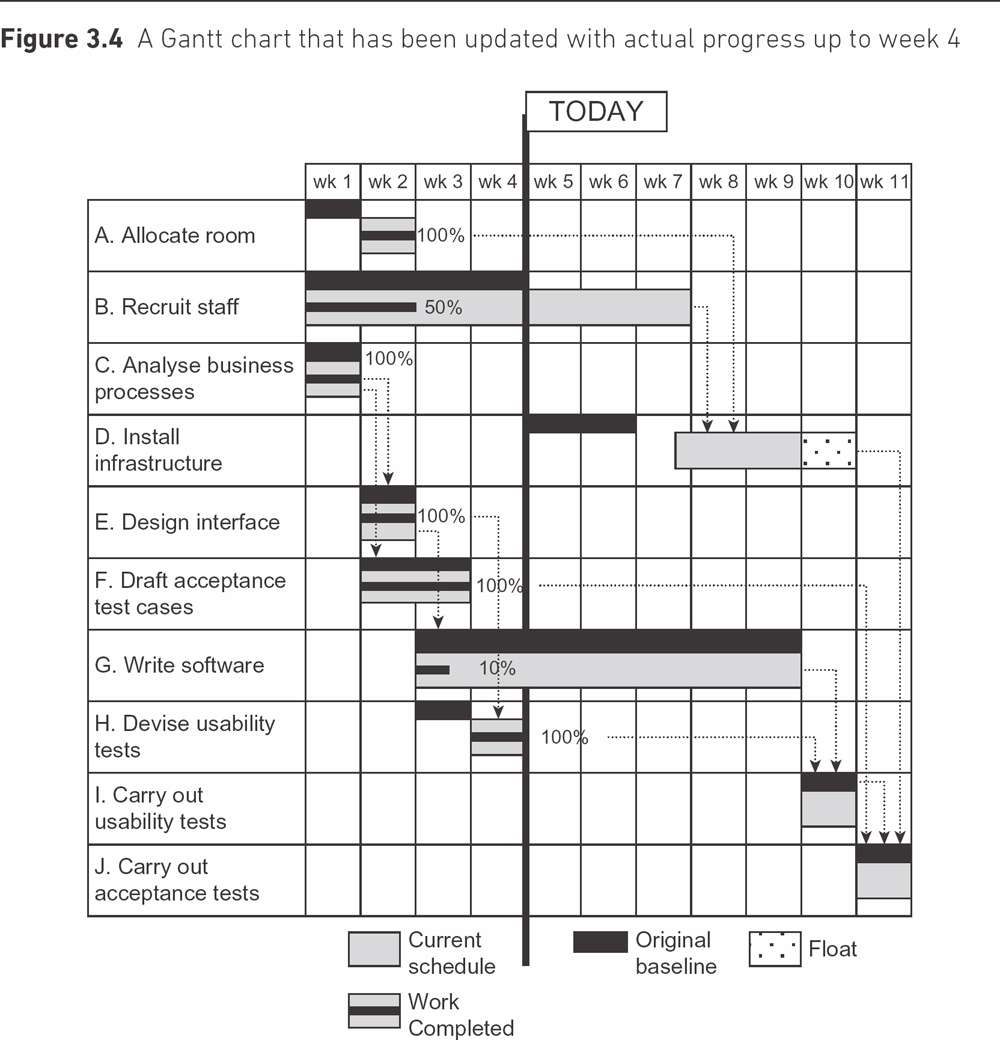
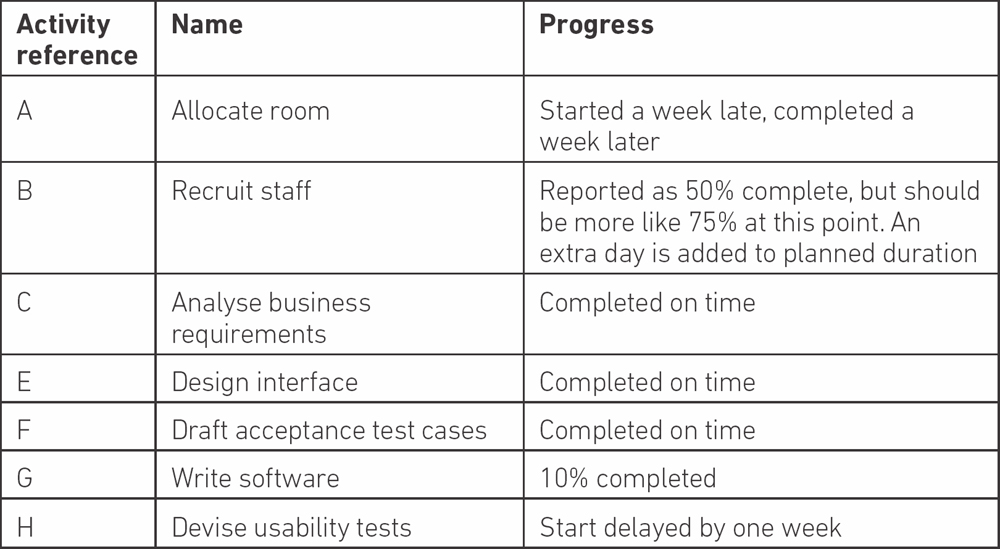
ACTIVITY 3.3
In week 4, the following actions take place:
(a) Activity B Recruit staff. There have been difficulties with finding qualified staff and effectively no progress has been made. It is reported that two further weeks, in addition to those already scheduled, will be needed.
(b) Activity G Write software. There is a discrepancy in the requirements which means that progress has been held up for the week. Currently it is hoped that the developers will be able to catch up over the next few weeks.
(c) Activity H Devise usability tests. This has now been completed.
Update the Gantt chart in Figure 3.1 to take account of these changes.
3.7.2 Cumulative resource chart
A cumulative resource chart can be used to present resource usage details (see Figure 3.2). This is sometimes called an S-curve chart, because the pattern of activity is that a project starts with a relatively low number of staff at the planning and requirements gathering stage. As the project progresses, more and more staff are needed as the development and implementation activities multiply. The demand for staff then decreases as the implementation proceeds – for example, software developers are not needed full-time once they have constructed their software components. This pattern of activity – a low demand for staff time which gradually builds up and then declines – leads to a cumulative resource chart where the line seems to have an approximate S-shape.
These charts normally have two sets of data points: one showing the expenditure that was planned and the other the actual expenditure, for comparison. This is a convenient visual representation of project progress suitable to show to management.
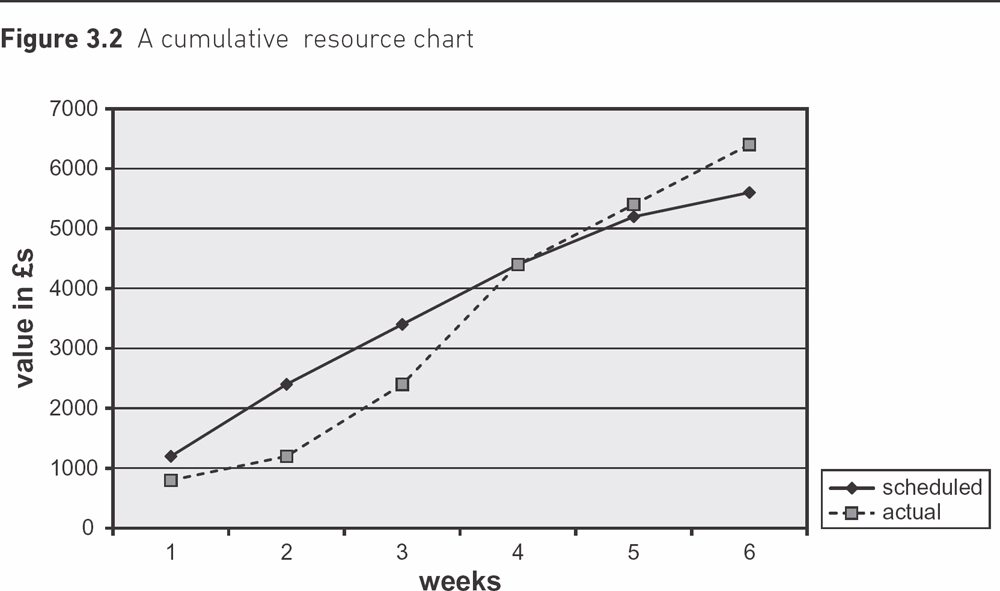
Figure 3.2 shows that for most of the project we were under-spending, but there has recently been a surge in expenditure, so that currently we have spent more than planned. However, we do not know whether this is due to poor productivity, or whether we have actually produced more than was scheduled – work may have been completed early, leading to some expenditure also being incurred earlier.
The traditional S-curve chart does not show any of the following:
- whether the project is ahead or behind schedule;
- whether the project is getting value for money;
- whether problems are over or just beginning.
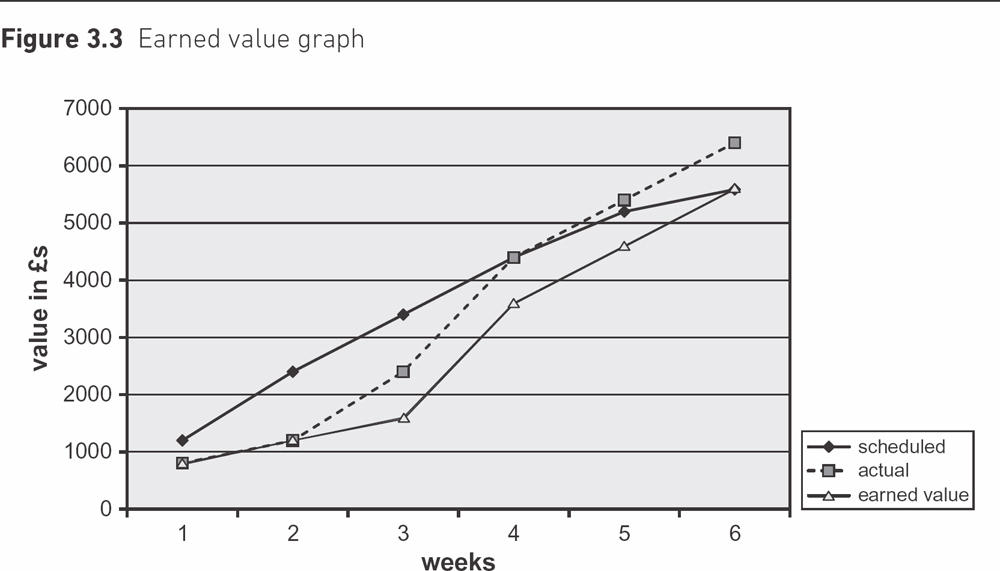
3.7.3 Earned value analysis
If we plot a third line, the earned value, then we can see if we are ahead or behind time, and above or below budget. Earned value analysis (EVA) shows the budget that was originally allocated to items of work that have been completed. When the work is finished, we can say that this value has been ‘earned’. If an external supplier is involved and had a contract with fixed prices to be paid on delivery of various products, they would see these payments as earned value.
As an example, Activity G, Write software, is made up of a number of tasks that can be seen in Figure 2.11. To complete the overall activity within seven weeks, the supplier needs to have completed all the design work by the end of the second week of activity and all coding by the end of the sixth week. If the designers are priced at £400 a week, then at the end of the second week, four staff weeks of design work should have been completed. This means there is a planned value of £400 x 4 – that is, £1,600 – at the end of the second week. Now if, for example, the Design provisional booking function is not completed, because that was originally planned as two weeks’ work, the earned value at this point in time would be only £400 x 2 for completed work – that is, £800.
In Figure 3.3, a line showing earned value has been added to the cumulative resource graph. This shows, for example, that at the end of week 6, the project is on schedule and has completed the work that was planned. However, it can be seen that expenditure is greater than planned. This may be a case where the project manager got the project back on schedule by buying in overtime.
Please note that candidates for the BCS Professional Certification (formerly ISEB) Foundation Certificate are not expected to know the details of how earned value is calculated.
SAMPLE QUESTIONS
1. Which of the following would you most expect to see in a routine report from a project manager to a project board?
(a) Costs and benefits
(b) Progress against plan
(c) Configuration status information
(d) Current activity
2. Which of the following is not involved in collecting progress information?
(a) Team progress meetings
(b) Timesheets
(c) Comparing planned and actual costs
(d) Informal monitoring
3. Which of the following would be most likely to give rise to an exception report?
(a) A new issue being raised
(b) A proposal to make a change to a deliverable
(c) The unexpected loss of a key team member
(d) Project tolerance being exceeded
4. What is the purpose of earned value analysis?
(a) Assessing progress
(b) Collecting progress information
(c) Estimating the required effort
(d) Calculating benefits
ANSWERS TO SAMPLE QUESTIONS
1. (b) 2. (c) 3. (d) 4 (a)
POINTERS FOR ACTIVITIES
ACTIVITY 3.1
(a) If we keep to the original planned installation rate of one boatyard a day, 17 days (that is, about three to four weeks) are needed to complete installation, as there are 17 boatyards left. However, if we decide that the experience of the first week shows that the original installation rate was unrealistic, then we may project that three boatyards can be visited in a week. This would lead to between five and six weeks being needed to complete installation.
(b)(i) In this scenario, the reason for only three boatyards being visited was simply a late start rather than a low installation rate. The remaining estimate of 17 days would seem to be reasonable.
(ii) The reason for lateness here was a lower installation rate. However, as the installation programme proceeds, the installation rate should improve as the nearer boatyards are dealt with, and journey times get shorter. Revising the planned time to five to six weeks would be premature at this point.
This activity should illustrate how informal information gathering can help interpret more formal reports and the risk of extra learning time being needed if a new developer is added to the team who is unfamiliar with the application.
ACTIVITY 3.2
a) Option: be a week late and accept the penalty. The penalty would be £500, but there would also be the cost of an extra week’s work (£400). This would cost £400 + £500 in all – that is, £900.
b) Option: split the functionality into two components that can be developed in parallel. Currently £1,600 (4 x £400) has been allocated to the task. The new plan would increase this to £2,400 (6 x £400) – that is, an overall increase of £800.
c) Option: staggering delivery. There would be an extra week’s work for the delayed enhancement. This would cost £400.
Thus option c) would appear to be the best. Note that this is a very simplified scenario, and does not take into account many issues such as the risk of possible loss of reputation with some of the options.
ACTIVITY 3.3
See Figure 3.4.