
Chapter 6: Blue Team – Collect
In the previous chapter, we discussed and discovered some very important topics to help us understand and deploy our offensive infrastructure. Now, we need to start looking at the implementation of our defensive posture. We will not cover all the applications you must set up and use to analyze all your inbound and outbound flows and hosts. Instead, we will focus on the methods we can implement to gather all the information that will be generated by our security products.
First, we will provide an overview of our infrastructure and the need to map and classify our assets to introduce the interest in collecting logs. Then, we will look at the technical methods we can deploy to centralize our logs using some agents, as well as methods to collect and ship logs without the need to deploy agents. Finally, we will cover Logstash, a solution that's used to extract and transform our logs into valuable and actionable information that we can send in our long-term storage or Security Information and Event Management (SIEM).
In this chapter, we will cover the following main topics:
- High-level architecture
- Agent-based collection techniques
- Agentless collection
- Extract, transform, and load – Logstash
- Secrets from experience
Technical requirements
In this chapter, we will cover several domains in terms of architecture and infrastructure (Windows mostly, but we will also discuss some Linux solutions), which will require some basic usage of command lines. Finally, for the configuration and setup in this chapter, we will need to be able to write and read specific configuration and file formats such as Yet Another Markup Language (YAML), JavaScript Object Notation (JSON), and Extensible Markup Language (XML).
High-level architecture
Deploying and setting up an efficient and secure collection infrastructure that will help us detect and investigate potential security issues and cyber security incidents can be very difficult and time-consuming. To ensure we're going in the right direction, we should start by looking at our infrastructure and our current architecture.
One of the major and most important first steps is to understand and visualize our assets and the links they have with each other. Drawing a good schema is always better than long and inaccurate meetings. Of course, in some cases, a schema is not available, so we will need to gather the right people around the same table during meetings to accurately draw it.
The following diagram shows a simplified architecture schema that comprises multiple virtual local area networks (VLANs), users, demilitarized zones (DMZs), production environments, and servers. All of them are behind firewalls and they can all talk to cloud applications and the internet:
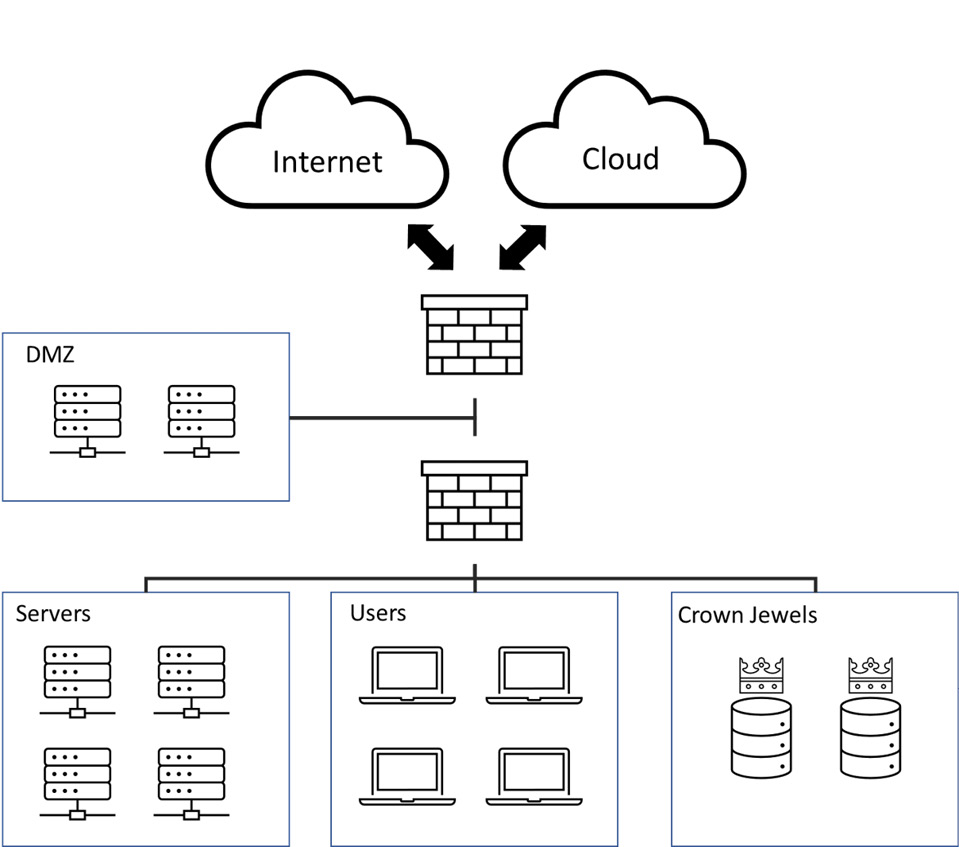
Figure 6.1 – Example of a corporate architecture
Once we can draw and visualize this kind of information, we need to classify and select the most critical assets (also called the crown jewels). Those assets are considered to be business-critical and are highly sensitive for our organization. We should also consider classifying less critical assets as this will help us create a roadmap in terms of security, collection, deployment, and coverage for the following months and years. Depending on the classification, we will need to implement strong controls around the most critical assets to ensure that any suspicious or deviant activities are detected as soon as possible.
When our criticality mapping is done, we can start thinking about the information we can collect. Are the actual assets able to generate interesting information and logs that will help us protect them? Replying to this question will also guide us in terms of creating detection rules since logs are a key step in creating the relevant security use cases. Without this information, we can't define correlation and detection rules to trigger signals for our blue team.
Knowing the criticality of our assets will help us determine and set a collection perimeter. This perimeter will narrow down blind spots in our infrastructure. A blind spot is a place where we don't have information and telemetry inside our infrastructure. Lack of knowledge is considered a weakness in our security posture.
This is exactly where collection comes in – generating and gathering information and security alerts will create knowledge for our security team so that they can determine a normal baseline and detect suspicious behavior. Nevertheless, having accurate knowledge of complex environments requires gathering a lot of data at different levels; this helps us draw a relevant security picture. Therefore, our collection should be implemented over several layers.
For example, if we collect network firewall logs, we will probably have a general knowledge of the flows and the packets that are being exchanged between specific hosts. However, collecting system information directly from the hosts will give us better visibility into, for example, command lines and tasks that are running on the hosts. Then, we can thoroughly understand the relationship between a host, a given application, and a network flow.
All our collection points and layers should be deployed and implemented in as maximum many assets as possible since we want to reduce the number of blind spots. The following are the high-level log collection categories we want to generate and gather:
- Hosts: Systems, processes, authentication, and so on
- Network: Network flows, network solutions, applications, and full packet captures
- Business: Applications, services, and so on
- Security: Anything that generates security information, logs, or alerts (endpoints, networks, email gateways, security solutions, and so on)
These are just examples; there are a lot of frameworks and collection security baselines we can find on the internet.
These layers should then be evaluated and implemented in every criticality group, starting with the crown jewels. Once we've covered our less critical assets, we should validate our implementation using our architecture schema; this will help validate that the collection covers all zones. From our experience, we know that most – if not all – of our infrastructure should be monitored. We don't need to monitor every element inside each zone but having a minimal set of information can make a difference if something happens.
Nevertheless, we should be aware of potential pitfalls regarding log collection as collecting everything everywhere can be time- and resource-consuming and is not always interesting. We should assess each collection point to be sure that it will serve a purpose. The information we want to collect will need to cover the following points:
- Can this information indicate potentially suspicious activity (EDR, process command-line activity, network activity, and so on)?
- Is the information able to help or add context to other information (firewall logs, IDS solutions, Active Directory user information, and so on can add valuable context to an investigation)
Only then can the information be considered valuable for defending our security posture. All the information or logs that cannot answer these questions should be considered less valuable and should not be collected in the first place. Prioritization is key to avoiding pitfalls. Still, they may come in handy later as we start looking at more advanced security use cases or detection rules to identify specific threats. That is why collection must be considered a journey and not a destination – it must be part of a continuous improvement process, and procedures should be defined to integrate more data sources or additional logs from an already integrated data source.
Important Note
This approach – that is, classifying our assets and collecting as much data as possible on them to be able to detect suspicious activities – can be seen as very educational and sometimes the old-fashioned way to implement data collection. In modern infrastructure, we will probably end up collecting terabytes of logs, which are mostly empty of security interest. In Chapter 7, Blue Team – Detect, we will discuss a much less costly approach based on security detection frameworks and the available security products. Instead of starting from what we want to protect and then creating correlation and detections rules, we will start by looking at the relevant and existing detections and correlation rules to implement and prioritize our data collection process.
Now that you know what you want to collect and gather, you are probably wondering how to collect this kind of data across your infrastructure. We want the selected asset and data sources to send/forward the logs we need to a specific collection host or program (that is, the collector) inside or outside our network to apply further analysis and treatment. A quick security consideration to note is that it is very important that the source sends the data whenever possible and not have the collector connect to data sources and hosts to collect logs – this will require storing and using credentials and information for authentication. If the collector host is compromised, the entire infrastructure might be compromised too. On the other hand, sources do not need any type of information to send logs, so it is a much more secure implementation.
Later in this chapter, we will look at some methods and tools we can use to send data across our network for additional processing.
As we explained previously, best practices must be followed whenever possible. Unfortunately, some applications or systems won't necessarily be compatible with the selected methods to collect data in the environment (think of specific ICSs/OTs,mainframes, databases, and so on). In this case, it is important to spend some time thinking about other collection implementations. For instance, in the case of an old database, we could implement custom exports in a local file and send this local information to a collector using some specific protocols. We could even use a local agent to secure the collection mechanism.
As we explained earlier, collection mechanisms should be implemented with agile changes in mind, whether it's to improve or troubleshoot an issue. They should also be flexible and responsive so that we can make swift modifications. For example, we may need to be able to reduce the volume of information we collect from an environment. Many collection and analysis solutions use a pricing model based on the log volumetry or the number of ingested events. In addition, being able to reduce the noise that comes from an infrastructure and data sources should be performed promptly to avoid stress and load on the collection solution, on the analyst's workload, or, worse, on network bandwidth and critical production systems. We can't emphasize the importance of having an agile way of mastering and modifying the collection architecture more than this. This is a critical point to consider in terms of technology, but also procedures and people. Let the other teams know that for the good of the organization, collection mechanisms must be managed well.
Most of the time, we should consider collecting data as close to the source as possible. By using different techniques on the source, we can make customizations, add new information or fields to the logs, or even drop or delete non-pertinent fields or logs. Modifying this information can be a daunting task if it must be done by a system that receives millions of events per second. Being able to remove a specific field from the source that generates it reduces the processing time and the load on core components.
After selecting the data sources and assets we want to cover, we will face various log formats. So, let's see what exists.
A word on log formats
As we can imagine, there are lots of different log formats, each of which has pros and cons. In this section, we will look at the most well-known and used.
By default, JSON is a structured data object that's composed of key-value pairs. These allow us to add or remove fields without having to make additional modifications when we're ingesting information that can be queried, such as databases. It's very interesting and widely used for security monitoring and log management.
Common Event Format (CEF) is composed of three parts: a header, a CEF prefix, and the CEF extension. The last part of the log is composed of key-value pairs, similar to JSON, but the log is an array without opening and finishing markers. Nevertheless, this format is widely available on many security devices. Unfortunately, some solutions implement this format poorly as they change field orders, depending on the log event, which can be a nightmare to parse as it requires a positive lookahead regex or similar methodology.
The Syslog log format is probably the most well-known format; it has a historical presence, but it is also defined by the RFC 5424. It's structured in two parts: a header and a body. The header is defined and structured as it is always composed of, for instance, the "timestamp hostname, version, and application name."
Unfortunately, some solutions will not allow us to select the format we want. In this situation, we should consider using some methods to modify the format on the fly. Based on the advice we provided previously, these methods should be implemented as close as possible to the data source. In the best case, we can implement this type of mechanism directly on the asset we want to collect the logs from. We can do this by modifying the agent that was used to collect the data or by pushing modifications onto the asset, in the case of an agentless collection. Now, let's look at some agent-based collection scenarios.
Agent-based collection techniques
As we mentioned previously, data sources could be collected and managed by an agent that's installed directly on the asset. This type of solution needs to be managed throughout the infrastructure, from deployment through patching and troubleshooting. Managing this type of solution is a challenge, but at the time of writing, a lot of large-scale solutions are used to deploy and maintain a package that can be used to fulfill this need. Also, some agent vendors have started taking this into account and some solutions are now implementing management features with the agent. This approach can also bring the benefit of reducing the bandwidth as we can easily apply filtering at the source, limit the resources that are needed at the end of the collection chain, and increase the security of the transmission by implementing secure protocols via the agent. In this section, we will present and review some of the agents that are available on the market. We will not look at all the available solutions, but before choosing one, we should perform some due diligence testing and validation to find out which one suits our needs.
Beats
Beats is a suite of software that is actively developed and maintained by Elastic. This suite is composed of multiple agents, allowing it to collect almost everything, from flat files to cloud applications logs, through to Windows logs and system metric data. This suite is composed of the following agents:
- FileBeat: Flat file log collection
- Winlogbeat: Windows event logs
- Metricbeat: Collects metrics from assets
- Packetbeat: Monitors and collects network information
- Auditbeat: Linux audit log collection
- Heartbeat: Generates and collects system availability logs
- Functionbeat: Generates and collects cloud-based applications
It's very simple to install on the desired assets – we just need to push a YAML file for the configuration under a path such as %HOME%/conf/filebeat.yaml. This YAML file needs to be configured with specific sections. The inputs section is where we will define the type of logs we want to collect and the path where they are stored on the local asset, while the output section is where we will specify the type of transport and where we want to ship our logs. Depending on the agent, the configuration will be slightly different. For instance, on Winlogbeat, we must use different section names, as shown in the following configuration file:

Figure 6.2 – Winlogbeat configuration file
The configuration file is also where we will define the necessary processing rules. As shown in the preceding screenshot, we can define logical conditions (under processors) to apply to the logs that are based on, for instance, a specified field value. If the condition is met, the agent will apply the desired operations; here, it will drop the event.
Nevertheless, the agents come with some modules that have been pre-configured to gather specific and well-known log formats. For example, when using Winlogbeat, we can collect Sysmon logs by using the Sysmon module, which will collect and process the Sysmon logs using a JavaScript file that performs normalization and enrichment:
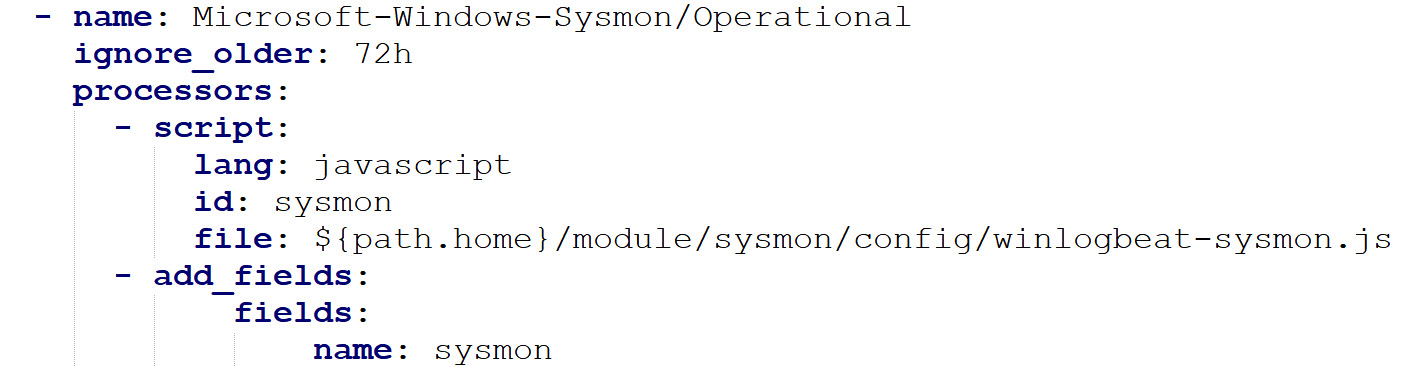
Figure 6.3 – Winlogbeat event channel log collection (Sysmon)
Once all the logs we want to collect have been defined in the YAML file, we need to define the destination and the methods we will use to ship our logs. Once again, the Beats suite is highly customizable and allows us to use multiple protocols and methods to push logs. For instance, we can push our data over Transmission Control Protocol (TCP) with a Secure Socket Layer (SSL), or even by using the Logstash protocols (previously known as Lumberjack) and SSL verifications by using the following configuration (Beats agent also supports load balancing using the Logstash output, allowing us to define multiple Logstash instances):
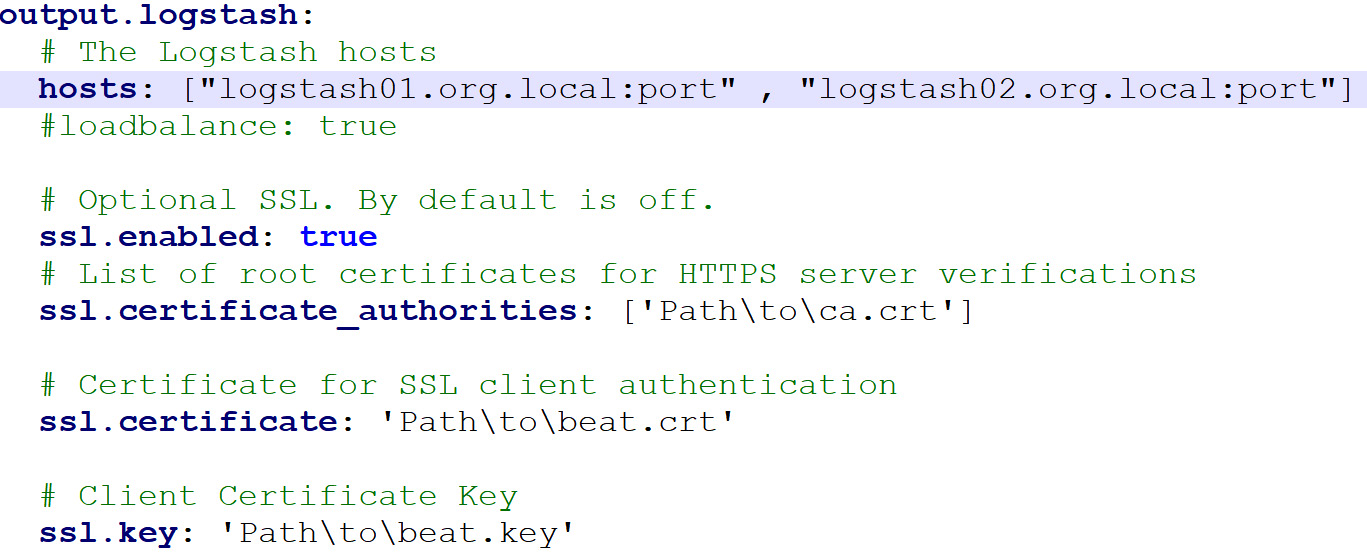
Figure 6.4 – Beats YAML configuration output section
The Beats agent also provides advanced configuration regarding the agent, the host, and the logs files. To learn more about these configurations, take a look at the following very well-written documentation: https://bit.ly/3ma1Uym.
Finally, Beats and Elastic are trendy and community-oriented, which means that we can find a lot of tutorials and information in the official repository, but also on the official Elastic forums. Recently Elastic released the Elastic Agent which combined several Beats' features with the advantage of remote and centralized management thanks to the Fleet module. This is worth looking at as this will help us manage, configure, and use the suite.
Nxlog
Another well-known agent on the market is Nxlog. Created 9 years ago, this solution can be installed on most operating systems, including Windows, Linux, and AIX. It has two licensing modes: Enterprise edition and Community edition. Both are well maintained; the differences between the two mainly concern the OS's compatibility level and some modules we can use and define inside the configuration file.
It's very straightforward to install the agent – you only need an Apache-style configuration file. This file can be split into different sections:
- Global: Defines global variables such as the user, agent configuration, and so on.
- Input: Contains variables related to the file (path, format, and so on).
- Output: Contains all the information related to shipping logs.
- Route: Optional section for rerouting log flows; standard logs will follow the configuration file from top to bottom.
Similar to how the Beats configuration works, the agent allows us to use modules inside each section. These modules are responsible for managing and configuring the section. The Input section lets us configure the method we will use to collect the data sources. For example, in the following screenshot, we see an Input section named Application that's composed of an input module (im) that collects all the log files located in the /var/log/application/ path. Then, the logs will be converted into JSON format using the json module and sent to our log collector, which is located at 192.168.12.100. The Extension section is used to load the module containing the to_json() function in the agent:
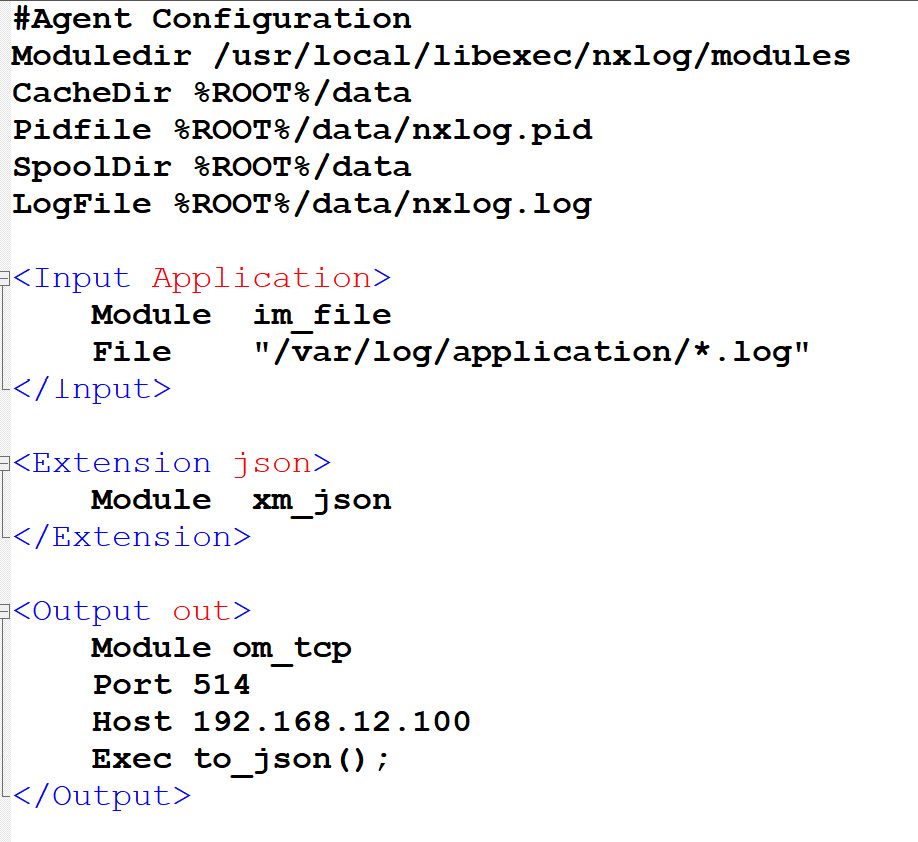
Figure 6.5 – A basic NXLog config file
Finally, an NXLog agent can be configured to perform filtering and processing operations directly on the logs. Thanks to the Exec directives, we can create conditions and actions based on some field values. For example, the following configuration line will drop events if the SourceAddress field contains a value of 224.0.0.1:
Exec if ($SourceAddress =~ /224.0.0.1/) drop();
This capability allows us to perform advanced filtering and noise reduction directly on the host. After performing some tests, we can drastically reduce the number of useless events before even leaving the host.
Compared to Beats, Nxlog has the advantage of being able to collect multiple data sources from the same agent (This is the gap Elastic is trying to close with the Elastic Agent). On a Windows host, Nxlog can be configured to forward local log files, as well as Windows Security logs.
It is also worth mentioning Snare agent, which is like Nxlog and provides a web interface to manage the agent. In addition, those familiar with Splunk will know that the company provides the Splunk Universal Forwarder agent, which is standard in any Splunk Enterprise deployment and has features that are similar to Beats, but has limited capabilities in terms of transformation.
Another key feature that we must keep in mind while implementing an agent-based architecture is the need for central management, which is critical to ensure proper deployment and to ease troubleshooting, as well as change management (remember that we build with continuous improvement in mind). Also, some architectures will require multiple agent outputs to send logs to SIEM for proactive detection; others will be sent to a log management solution for investigation and compliance, thus reducing the storage/indexing cost of SIEM.
Finally, we must emphasize performing testing on various systems before going into production. We will certainly face the skepticism of the IT and operations team in terms of the potential performance impacts that the agent will have on those systems. That's why it's important to remember that the more processing we add to the agent, the better it will be for the SIEM's performance. However, this may not be the case for the local system hosting the agent. As a security team, we don't want to be responsible for production issues and/or bad user experiences; that's why the right balance must be found.
Depending on our environment and solutions, the use of an agent-based architecture is not always a good or even possible option. As an alternative to agent-based collection techniques, there are agentless solutions. In the next section, we will discuss Windows Event Forwarder and Syslog.
Agentless collection – Windows Event Forwarder and Windows Event Collector
Under specific conditions or environments, it is not always possible or desirable to install and deploy an agent to collect data. To overcome these requirements, we can look at agentless collection methods. Often, this will only require us to configure the hosts and collect their logs.
Let's look at Windows Event Collector and Windows Event Forwarder as an example. As their names suggest, both are maintained by Microsoft. Windows Event Forwarder (WEF) is implemented in the WinRM service on a remote host, which will read the local Windows Events logs file and then send it to the Windows Event Collector (WEC), which will be listening. Since both are official Microsoft solutions, some of the configurations will be done using Group Policy Objects (GPOs) at the domain level, allowing us to quickly deploy and update our configurations.
First, let's talk about WEF. To know what to read and what to send to our WEC server, the WEF service uses XML configuration files, known as subscriptions. Those configuration files will be stored on the WEC and available at a given URL, which will be pushed by GPO to our remote Windows endpoints. Subscriptions contain several parameters to manage the frequency and the number of events to forward, but they also contain the XML query that will be applied to read and filter our logs on the endpoints.
The following code shows a subscription configuration file:
< ! --- Redacted -->
<Delivery Mode="Push">
<Batching>
<MaxItems>50</MaxItems>
<MaxLatencyTime>25000</MaxLatencyTime>
</Batching>
<PushSettings>
<Heartbeat Interval="4000000"/>
</Delivery>
<Query><![CDATA[
<QueryList>
<Query Id="0" Path="Security">
<!-- 4624: An account was successfully logged on. -->
<!-- 4625: An account failed to log on. -->
<!-- 4626: User/Device claims information. -->
<Select Path="Security">*[System[(EventID >=4624 and EventID <=4626)]]</Select>
</Query>
</QueryList>]]></Query>
<! -- Redacted -->
For the sake of brevity and readability, the previous configuration file has been condensed and only the most important parameters have been kept. The first parameter, Delivery Mode, indicates how the logs for our WEC server will be collected. Remember to avoid creating security issues, we always want our data sources to send us the logs. Therefore, from the remote host's point of view, we want a Push method. Next, we can see the Batching sections, which is where we give WEF threshold values to meet before sending logs – either the number of events or a frequency. Next, Heartbeat Interval is used by WEF and WEC to detect potential "dead" hosts in the infrastructure.
Finally, we have the core of the configuration – the XML query. This will be used and applied by the WEF process to filter and extract the logs we want to collect and gather. In this case, we defined a query on the Security logs file and specified that we only want events where the EventID field is between 4624 and 4626. The rest of the file is composed of additional XML queries but can only be related to specific Windows event logs or events that are stored in the Windows Event Viewer. For instance, here, we are collecting Windows Security Logs.
Some of the events may need the Windows logging policy to be modified as some events may not be enabled by default. This will allow each host to generate more interesting event logs from a security point of view.
To keep things clear in the WEC configuration, we will separate the subscriptions by category. For instance, we will collect all the security logs inside a single subscription, and the queries to collect system logs inside another subscription. Later, we could also separate large subscriptions (such as security) into multiple categories such as authentication, Sysmon, process, network, and so on.
On the WEC side, we also need to configure GPOs to manage the service – for example, to start at boot. We also need to import all the subscriptions we want to apply and map them to the desired assets groups. Some assets, such as domain controllers (DCs), will generate peculiar events. To avoid wasting computing resources, dedicated subscriptions will only be deployed on them. To manage all our subscriptions, we can use the wecutil command, as shown in the following snippet:
#Requires the wecsvc service to be running
#Create subscription from file
wecutil cs Authentication.xml
#Display a specific subscription in XML format
wecutil gs "Authentication" /format:XML
# Delete subscription
wecutil ds "Authentication"
Finally, we will need to configure a GPO for all our endpoints to start making them download subscriptions and send the required logs to our WEC server. The following code shows the XML part of the GPO that will be responsible for this feature:
<q2:Category>Windows Components/Event Forwarding</q2:Category>
<q2:ListBox>
<q2:Name>SubscriptionManagers</q2:Name>
<q2:ExplicitValue>false</q2:ExplicitValue>
<q2:Additive>false</q2:Additive>
<q2:Data>Server=http://wec01.mydomain.com:5985/wsman/SubscriptionManager/WEC,Refresh=3600</q2:Data>
</q2:Value>
</q2:ListBox>
As we can see, we have to use the WEC domain name, not the IP address. This will not work with an IP as WEF relies on the Kerberos protocol, which needs FQDN for authentication. We also defined the Refresh parameter at the end, which will be responsible for defining the frequency where the endpoints will contact the collector to receive updates on the subscriptions. This GPO will need to be applied to all Windows endpoints (servers, domains, and workstations), but we will exclude the WEC servers.
Once everything has been deployed on the testing assets, we should start receiving events under the Forwarded Events section of the Windows Events viewer on the WEC server. Despite being an agentless-based architecture, we will need to configure a collection agent on the WEC servers to gather all the logs that have been stored in the Forwarded Events log path to our processing server or SIEM.
As we saw previously, WEF and WEC are very powerful tools that allow us to collect Windows Events logs consistently (new devices will inherit from GPO and will automatically forward logs to WEC). Like any other solution, there are some cons, especially regarding debugging and troubleshooting. The learning curve is pretty hard in terms of issues. Therefore, all the previous configuration parameters (refresh rate, heartbeat interval, and MaxLatency) can be used as-is; we use them in some production environments.
Important Note
To start deploying and using the WEC/WEF collection method, look at the following GitHub repository from Palantir: https://bit.ly/2XxeYpd.
It contains all the configuration and files we will need to start collecting events with WEC/WEF. This repository is a very good starting point for our collection but requires the configuration to be reviewed before we implement it in a production environment. Nevertheless, using our previous advice on some parameters, we should have better performance and coverage. The value that's given for the Refresh parameters in the previous GPO, as well as MaxItems, MaxLatencyTime, and HeartBeat Interval in the subscriptions presented earlier, have been tested and experienced in highly populated environments without any issues. However, as always, before you implement them in production: test, troubleshoot, and review.
In the next section, we will address a very well-known way to handle all types of endpoints (Windows and non-Windows endpoints) that is also the only option on some systems and applications: Syslog.
Agentless collection – other techniques
Besides WEC, many other agent-free collection techniques and protocols exist. However, we have decided to only explain Syslog here as it is the most well-known protocol and because most security solutions and tools allow us to configure log forwarding using this solution.
Syslog
The name syslog refers to a protocol that is used to send and centralize events, but it is also a specific log format and software. Developed in the 80s, it is now used in most Unix environments but also on many other systems and solutions, including security solutions such as antivirus and firewalls, which allow us to send events using the syslog protocols. This protocol uses port 514 on UDP by default to forward logs to a centralized repository. The latter can be a dedicated syslog server, a SIEM, or a log processing server, as we will see later in this chapter.
The Syslog protocol and format are both defined in RFC5424, which standardizes the entire process, from events being created to being emitted.
Based on the RFC, the syslog log format is as follows:
<Priority>VERSION TIMESTAMP HOSTNAME APPLICATION PID MESSAGEID STRUCTURED-DATA MSG
<165>1 2021-09-20T13:51:27.003Z server1 su 201 3104 - su failed to run
As this format is defined by RFC, each field has properties and valid values, but the most interesting part resides in the MSG field. This is where we will be able to ship our information. This field can comprise any type of message in any format, such as CEF, JSON, and many more, as we saw at the beginning of this chapter. We will learn more about this in the next section.
Since the 80s, the syslog application has evolved and has been forked to introduce new features and capabilities. Syslog-ng and Rsyslog are both newer implementations of syslog and let us implement syslog over TCP, cipher communication data, and perform advanced processing on the events that will be sent.
Now that we've covered some definitions, let's learn how to configure Rsyslog on Unix servers to send some of the logs to our processing server. To do so, after installing the rsyslog client with the packet manager, go to /etc/rsyslog.conf and add the following line to the configuration:
*. * @@collector.domain.local:514
This configuration line will forward all our logs from the hosts to our server, collector.domain.local, using TCP (thanks to @@, we define the transport protocol as TCP; if we use @, it means we want to send our logs over UDP) on port 514. Once the rsyslog service is restarted, we should start receiving our logs on our host. As we explained earlier, we could also implement some filtering. For instance, if we only want to collect specific log files or log types, we can modify the first wildcard (*) character since it defines the facility (the source channel; please refer to the RFC) we want to collect logs from. We can also filter the priority of logs (please refer to the RFC) by adding a . and a priority to the name of the targeted log type. In the following example, we have set the priority to info for the log type; that is, authpriv. Both parameters can be composed of specific values that are well documented in the RFC; for example, if we only want to send authentication logs from our Unix server where the priority is greater than or equal to info:
auth,authpriv.info @@collector.domain.local:514
If we wish, we can also send specific log files or application logs. syslog provides some customizable facilities named local. These allow us to send logs using a dedicated facility and rename them in a rsyslog configuration file, such as auth. This feature allows us to send any applications logs to our processing server. From this new stream, we can apply conditions and additional filtering using some expressions directly on the configuration file (see the official documentation for more details: https://bit.ly/3vRgO0K).
With all the methods we've covered, we should be able to forward and send most of the logs we need from our Unix/Linux environments. As we explained previously, the syslog protocol is often included in some security products; check the vendor's documentation to find out. This can usually be found via the settings menu, under Logging or Forwarding Events.
With all the methods and techniques we've covered here, we should be able to gather almost every type of log we need across our infrastructure. Nevertheless, this information will usually still be raw and not friendly to read and understand. This is exactly why we need some intermediate servers to gather and process the diverse types of data sources (sources of logs); this will allow us to build detection rules on top of them. This type of server or solution is referred to as extract, transform, and load (ETL).
Extract, transform, and load – Logstash
Regardless of the collection method you choose, the collected logs will need to be sent to a log collector. It will (or at least should be able to) perform additional processing and transformation based on predefined conditions. Finally, the log collector will send the normalized and processed logs to our log management solution or SIEM for correlation and analysis by our blue team. The solution we want to install on our log collector to perform these additional modifications and transformations is called an ETL. This is a piece of software and solution that's designed to listen to or gather input data and apply a transformation before storing or sending the data to storage.
For this book and because this solution is reliable, fully featured, free and open source, we decided to use Logstash to explain the workflow that our logs will follow once they arrive at our log collector.
Logstash, previously known as Lumberjack, is a solution that's maintained and developed by Elastic. Very flexible and powerful, it allows us to ingest data from an exceptionally large range of inputs. Logstash processing workflows can be configured using three types of plugins: Inputs, Outputs, and the optional but particularly important one for us, Filter.
We will begin with the Input plugins as it is the first stage we will need to write and configure to start receiving and ingesting our data sources. To help us connect to our transport methods from our assets, Elastic has developed – and keeps developing – a huge library of different plugin types, from local files to database connections, through to applications and specific protocols.
To configure a plugin, we need to create a file in the conf.d directory of Logstash's installation path. Let's look at an example where Logstash will receive the Windows events from our WEC server and the logs arrive on port 514 over TCP. The input configuration file will look as follows:
input {
tcp{
port => 514
codec => json
add_field => {"datasource" => "WEC"}
}
}
Here, codec indicates the format of the logs that Logstash will receive from this channel. So, the logs will be pre-processed and we will be able to use and interact with the values in the logs. Regarding JSON format, we will be able to directly call the keys to retrieve values. This is unbelievably valuable as it will reduce the processing that's done by Logstash. In addition, using the same plugin, we can also add a field and value directly to the logs thanks to the add_field option. This is known as enrichment.
If the logs have already been parsed because they met some specific data format, we can move to the Output plugins section. As its name suggests, this plugin is responsible for shipping the logs to our storage. Similar to how Input has been developed, the Output section is composed of tens of plugins, allowing us to send our data how and where we want.
Let's have a look at some of the plugins we can use, such as the elasticsearch plugin. At a minimum, it requires hosts, which indicates the IP of our elasticsearch server. However, we also want to use the field we added to our log in the Input plugin to specify where we want to store our logs inside elasticsearch; this can be done using the index parameter. The value of the index parameter is composed of the datasource value we called using %{datasource}. Thanks to this mechanism, we can perform very advanced operations, some of which we are going to cover in the upcoming sections.
The following simple configuration will allow us to ingest and forward logs from our WEC servers to our correlation and storage servers. In this example, we are using Elasticsearch:
input {
tcp{
port => 514
codec => json
add_field => {"datasource" => "WEC"}
}
}
output{
elasticsearch{
index => "logs-%{datasource}"
hosts => "192.168.10.121"
}
}
Nevertheless, this standalone configuration will rapidly fade away once we start receiving several unnormalized data sources in parallel. This is where Logstash's configuration kicks in, which allows us to use its pipelining configuration. Using this setup, Logstash will treat configuration files and log flows as separate entities, where we can manage the flow of logs between different configuration files. For example, we could handle Sysmon logs and Linux audit logs in two separate pipelines but merge the two pipelines in an enrichment and filtering pipeline, before re-splitting them at the Output section or pipeline, based on predefined conditions.
The pipeline configuration allows us to easily manage multiple data sources arriving simultaneously. In the next section, we will learn how to normalize logs and perform enrichment thanks to the Filter section.
Enrichment
Before jumping into enrichment mechanisms, let's look at the role of the Filter section. Its primary purpose is to normalize logs before we can use fields and values as variables. Logstash needs to know the format and the components in the logs it will receive before being able to interact and work with them. Defining a pattern to extract value from logs is known as parsing.
To parse our logs in case they don't follow any known format, we can use the grok plugin. This plugin allows us to define regex-like patterns to split our logs into key-value objects.
Looking at the following log, which is from one of our data sources, we can see it is composed of two types of sections – a header, similar to a syslog one (in bold), and a JSON object:
Sep 17 10:08:44 redteam-vm.soc.local -: {"@timestamp": "2021-09-07T10:08:44.409Z","datasource": "Microsoft-Windows-Windows Defender","event_id": "1116","computer_name": "REDTEAM-VM","channel": "Microsoft-Windows-Windows Defender/Operational","Detection User": "REDTEAM-VM\zeuhl","user": {"domain": "NT AUTHORITY","name": "SYSTEM","type": "User"},<--redacted-->}
As we can see, we need to parse the syslog header and then, to avoid too much pain, call another plugin, called json, to parse the remaining part of the logs:
filter{
grok{
match => {"message" => "%{SYSLOGBASE} %{GREEDYDATA:json_body}"}
tag_on_failure => "defender_grok_failure"
}
json{
source =>"json_body"
tag_on_failure => "defender_json_failure"
}
}
Additionally, we must add tags that will be applied if any issues arise during the processing. These tags are specific fields that we can use later in our storage solution or SIEM solution as it can be used to record computed information within an event.
At this stage in every pipeline, we can play with our extracted fields. This is where filter plugins come into the picture. Using some plugins will help us add security value and intelligence to our logs.
Important Note
Parsing the logs will come hand in hand with the naming convention for the field we extract from them. It's pretty cool to be able to query the src_ip =192.168.1.1 field in our SIEM to retrieve all the logs from all the data sources we collect containing the src_ip field where the value is 192.168.1.1.
If not, we will experience difficulties. Imagine if we needed to query the src_ip, source_ip, and source fields instead because each of our data sources uses a different naming convention to classify the source IP address. It would be very difficult, even impossible, to create generic detection rules in our SIEM based on all those fields.
We could implement and maintain a naming convention that will be applied when we parse our logs, but this would require a lot of reviews to make it consistent across all the data sources we will collect. To avoid such issues, some security providers develop and actively maintain naming standards that can be applied to normalize logs across multiple data sources. For example, we should look at the Common Information Model (CIM) from Splunk and the Elastic Common Schema (ECS) from Elastic.
Now, let's look at the geoip plugin. As its name suggests, this plugin localizes and adds localization data to any given IP. By default, this plugin uses a public database from Maxmind, but we could also use our own. To avoid useless computing from Logstash, we will also add some conditions to exclude internal IP addresses. Like many other plugins, the output of this lookup will be added to a separated field that can be manipulated later:
geoip {
fields => [city_name, continent_code, country_code3, country_name, region_name , location]
source => "source_ip"
target => "source_geo"
}
This plugin can be used on any IP field; we only need to change the source parameter. This will enhance any log that contains source_ip with various fields, such as city_name, continent_code, country_code3, country_name, region_name, and location, a tuple that indicates the longitude and latitude of a given IP. Then, we can implement some additional mechanisms to use this information. For instance, we can classify logs based on their country code, name, and so on. This is important as this empirical logic is at the heart of the enrichment process. But what about internal IP addresses? For them, we could, for example, perform a lookup in a inventory database or a local exported file to enrich the logs with internal IP data.
Let's dive into more technical enrichment by adding cyber threat data lookups to our pipelines. This will automate the usage of our collected artifacts and will also allow us to quickly detect well-known intruders or malware by giving additional context to logs.
To do so, we will need the memcached plugin and some Indicators of Compromise (IOCs). Memcached such as Redis is an immensely powerful caching system. To use it, we will need to install a server daemon using the packet manager of our system. Once installed, we can configure the Logstash plugin to act as a local client to connect to the listening daemon to get or set specific keys and values. It allows us to store, query, and retrieve objects. Once our IOCs have been ingested into Memcached from an asynchronous process, Logstash will be able to perform lookups on these databases. For example, file hashes can be searched during log ingestion. If a match is found in the database, we can add a field named CTI_match:
memcached{
hosts => ["127.0.0.1:11211"]
namespace => "hash"
get => {
"%{file_hash}" => "[CTI_match]"
}
}
The namespace parameter will add a prefix to our hash value, which allows us to use Memcached to store different pieces of information – not only hashes but also IP addresses that we can perform IOC matching on. The Memcached plugin also lets us set some key-value pairs from our logs. This can be useful if we want to dynamically query and store the session ID or GUID to link related events to create the first level of log aggregation.
If we need something much more flexible, we could also call the ruby filter. This allows Logstash to directly execute commands or scripts on our logs. One very useful use case we would like to introduce is using Redis by executing ruby code to detect if some command lines or creative processes are suspicious. This plugin allows us to interact with our logs by using the event class name, from which we can call the get function to query a specific field or even the set function to add some data to our events.
In the following example, we are checking if the value of the command_line field contains any suspicious arguments. Nevertheless, to avoid complex and difficult regular expressions, we will check if the image value is in Redis database 1. If this first condition is true, we will compare the command_line value to find any match within our suspicious command-line regex. If both conditions are true, this means that this command line is very suspicious, so we will want to add a tag of suspicious_command_line to help the SOC analysts with their investigation. Furthermore, we could leverage this new tag in the SIEM correlation engine to create a detection rule and therefore trigger an alert. This method can help us reduce the compute on our SIEM and perform pre-correlation methods and rules that are applied during the parsing process:
ruby {
init => "require 'redis'"
code => 'redis = Redis.new(host: "localhost", db: 1)
if redis.exists?(event.get("image").split("\").last) and event.get("command_line").match(/#{redis.get(event.get("image").split("\").last)}/i)
event.tag("suspicious_command_line_argument")
redis.close
return
end
}
}
The Redis database should be filled with keys such as certutil.exe, powershell.exe, mshta.exe, and so on that correspond to the image of the program that we want to analyze. The value must be a regex pattern that Logstash will try to match on the logs' command_line value. The Redis databases should look like this:
"certutil.exe" : ".*(-ping|-decode|-decodehex|-urlcache.*http|-ftp).*"
"powershell.exe" : ".*(-encode|-enc|-iex|download).*"
This enrichment can and must be implemented on multiple fields, but all the data we use to perform lookups must also be updated and maintained with the latest threat techniques and detection methods. Additional enrichment can be performed using a wide variety of plugins such as convert, http, jdbc_static, urldecode, and so on. These plugins can be configured and modified as needed; the only thing you must do is analyze and create lookups and enrichment so that we can add context and value to our logs. Finally, one remarkably interesting concept is enriching logs using previous logs and events. For instance, it could be interesting to store key information such as Windows Session IDs, Process IDs, or even DHCP information so that we can enrich new events with this information. This will link several events together and enhance our visibility and threat hunting capabilities.
Nevertheless, as we mentioned earlier in this chapter, one of the major pitfalls in data source collection is being overloaded and flooded with events and logs. In this situation, there are a lot of mechanisms and logical equations we can implement using specific plugins. This mechanism is called filtering or noise reduction.
Filtering
Although it's important to understand and apply the filtering process to reduce the number of events but also the number of alerts, it cannot always be applied at the source. Due to this, we must find a way to reduce the volume of events. To help us with this, we can implement a method that drops events when they're being processed within Logstash. The drop plugin is designed for this purpose. By default, this plugin will drop all the events that are going through it, to avoid dropping all the events we need to implement Boolean logic to route events. As we learned when we covered the enrichment process and techniques, we could use some specific fields or tags to decide if an event needs to be processed further:
filter{
if [syslog_priority] == "info" {
drop{}
}
if [datasource] == "Windows-Defender" and [Event_Id] in ["800","700"] {
drop{}
}
}
The previous configuration file shows two Boolean conditions. The first will drop any events where the syslog_priorty field has a value of info, while the second will drop any events where the data source is Windows-Defender and the Event_Id value is either 800 or 700. This logic can be made more complex and extended to more advanced use cases, but we must be aware that dropping events will permanently delete and remove all traces of such events. Thus, if we misconfigure or misjudge the value of a log, some severe lack of information may occur during an incident. To avoid this situation, we can look at another mechanism at the output level. Instead of deleting events, we can simply route the events to a local file using the file output plugin. Then, we will be able to ingest those files as local data sources in Logstash or simply perform some manual queries with them. The routing conditions are also created using a Boolean condition. Let's take our previous drop filter configuration and our output configuration file and merge them to forward logs to a local file:
output{
if [syslog_priority] == "info" {
file{
path => "/var/log/syslog-info.log"
}
}else {
elasticsearch{
index => "logs-%{datasource}"
hosts => "192.168.10.121"
}
}
}
As we can see, this configuration is a bit more complex as we're implementing multiple potential output conditions. In this case, if the syslog_priority value of our logs is equal to info, the logs will be routed to a local log file. This simple example can be quickly expanded to classify our logs based on other fields, such as a data source's name or event ID. Thus, we can manage every data source separately. This logic allows us to also add additional outputs if other technical teams or business needs arise; we can collect some firewall logs and then, after processing them with a pipeline, reroute them in a log management solution and/or in the network team's log solution.
By utilizing the previous configuration examples and with the help of Logstash's official documentation, we can implement and customize our data ingestion process, where events will not only be normalized but also enriched with context. We can also develop and improve our process thanks to the flexibility of Logstash. The following is a logical schema of the workflow of the logs inside Logstash. As we explained previously, we must have a continuous improvement mindset. This is just the beginning - as more and more advanced detection are needed, the need for more filtering and enrichment will arise.
Later in the life cycle of our processing platform, we could end up with the following kind of pipeline and processing workflow:
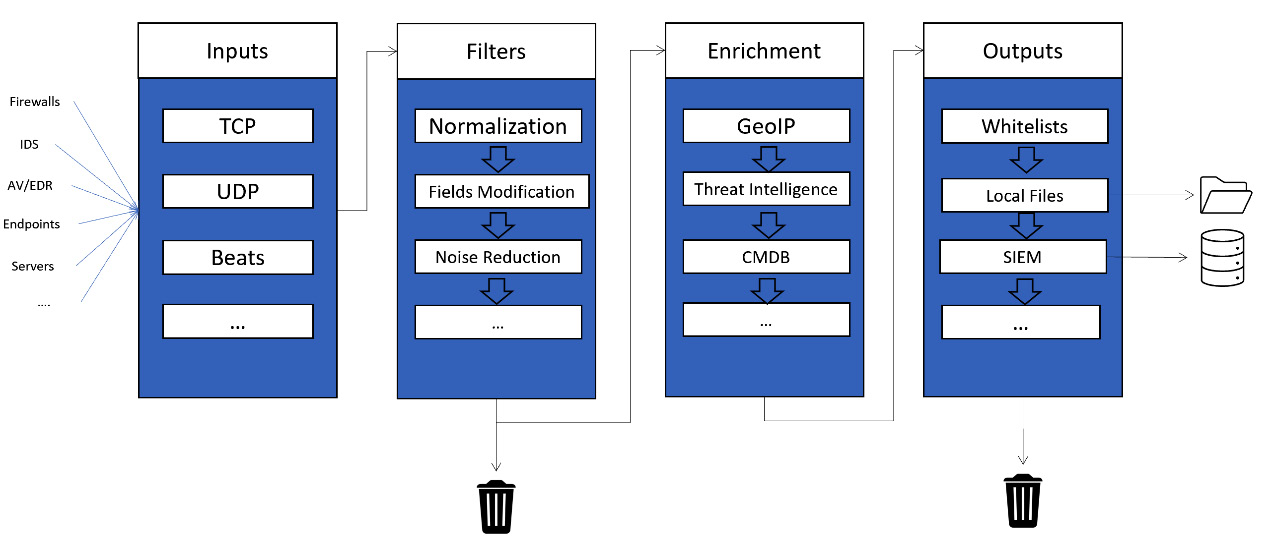
Figure 6.6 – Logical Logstash workflow
Depending on the infrastructure and the number of assets we have, we will probably need to deploy several Logstash servers across our domain, some of them with special configurations and pipelines. Updating our configuration and managing all our Logstash infrastructure can be done using GitHub repositories and Ansible playbooks. Both technologies will be discussed in Chapter 9, Purple Team Infrastructure, and Chapter 12, Purple Teaming eXtended.
Nevertheless, before we automate how we will deploy our parsing servers, we should consider implementing monitoring on those servers. This is what we are going to talk about in the next section.
Secrets from experience
Ingesting and processing thousands of events every second correctly without errors is a key factor for our blue team to efficiently correlate and detect suspicious activities. This can be reduced if the processing servers face issues or are misconfigured. This is exactly why we need to implement monitoring for such a critical process. The monitoring process must be able to detect issues when logs are being processed and ingested, but also detect if some endpoints or solutions are not sending logs anymore. The latter is one of the first use cases you should implement within an SOC.
To fulfill those needs, we need to monitor our hardware to detect potential failures, but also the processing part related to the pipelines to be able to troubleshoot any issues swiftly. Detecting dead data sources can be addressed at the SIEM or database level with the help of aggregation and statistical calculation. For example, we can measure and assess the number and the quality of the logs we have gathered.
With regards to Logstash servers, we can monitor them using the API that is published on port 9600 to query the application and retrieve valuable information, such as the following:
- Node information, which contains information about the OS, the process's Java Virtual Machine (JVM), and some other basic information on pipelines.
- The plugin's information, which will provide details about the plugins that have been installed.
- Stats information, which is composed of pipeline, events, and process statistics.
This information can be queried and used to detect potential anomalies in the processing flow. We can also send it through dedicated storage to perform remote monitoring.
Technically, you will need to install and set up a Beats agent on the Logstash server. Metricbeat contains a dedicated module that can be used to monitor Logstash, which will send data to an Elasticsearch server. Then, we can view and watch that monitoring data on Kibana. This module allows us to investigate and monitor every pipeline on every Logstash node. For example, we can monitor the number of events that are going through a specific Boolean condition or even inside a specific plugin to detect bottlenecks in the parsing process.
Summary
In this chapter, we started by discussing the importance of defining and classifying our assets to help us determine what data will be collected so that we can create our correlation rules in the SIEM. We then looked at practical methods and solutions we can implement for collecting the data we need on the previously defined assets. Finally, we presented the role and the importance of ETL solutions to help us parse, normalize, and add context to the logs it received, but also the methods and logic to modify the outputted volume and flows, directly during the parsing process, that will be forwarded to our SIEM for advanced correlations.
In this chapter, the method we detailed at the beginning is the educational way of thinking about implementing log collection. However, as we will see in the next chapter, we could also start this process directly by defining the rules, the security detections, and the security measures we want to implement and then deploy and configure the desired assets to send specific information and logs.
Summary