Chapter 14: Exercise Wrap-Up and KPIs
Now that you have a better overview of the multiple purple team strategies and the required technical components and outputs behind them, let's wrap up our journey. Consolidation through reports is critical to managing the whole process and offers both technical staff and managers an overview of people, process, and technology efficiency.
This approach allows managers to assess their global security posture, prepare investments for both products and staff with reliable key performance indicators (KPIs), and provide risk visibility to the top management.
Thanks to what we covered in the previous chapters, we can start working on continuous improvement. While considering all the concepts and technical examples that were covered in this book, we will discuss what the future of purple teaming holds.
In this chapter, we will cover the following topics:
- Reporting strategy overview
- Purple teaming report
- Ingesting data for intelligence
- Key performance indicators
- The future of purple teaming
Technical requirements
For this chapter, you need to have a minimal understanding of Python code even though this chapter is mostly management-oriented. You don't need to understand additional technical knowledge except for generic concepts and the purple teaming strategies we have covered throughout this book.
Reporting strategy overview
Reporting should help both technical staff and managers get a global overview of the past, present, and future. The reporting strategy we will look at will cover the three main security pillars: people, processes, and technologies.
Reporting must show increases or decreases in the tasks and actions that are generated by these three pillars over time.
While building purple teaming dashboards, you may rely on the following data sources:
- Documentation:
- Emulation plans
- Purple teaming reports
- Collaboration templates (in particular, those that highlight the gap in analysis)
- Cybersecurity project roadmap and investment plans
- Technical:
- Access to the blue team/SOC case management system
- Alerts from SIEM or analytics solutions (or EDR/XDR)
- Detection rules catalog
- MITRE ATT&CK references in CSV format (https://attack.mitre.org/docs/subtechniques/subtechniques-csv.zip)
- If relevant, Ansible logs (for Purple Teaming eXtended (PTX)
The next few sections will be dedicated to the generic purple teaming report content.
Purple teaming report
In Chapter 2, Purple Teaming – a Generic Approach and a New Model, we saw one example of a purple teaming exercise log and report, which can be found at the book's GitHub repository here: https://github.com/PacktPublishing/Purple-Team-Strategies/tree/main/Chapter-11. Now, let's look at another example of a report based on exercise logs.
This report contains your purple teaming results and is the source of the gap analysis for missing detections and blocking. For ease of management, it should contain the following fields:
- DATE: This should contain the exact timestamp of the attack.
- ID: An iterated ID that allows you to identify the tests, especially for your change management process.
- OBJECTIVE: The objective of the exercise, such as APT3 emulation, ransomware generic simulation, or vulnerability Log4j assessment.
- MITRE_TACTIC: The MITRE ATT&CK tactics must be documented for each test.
- MITRE_TECHNIQUE: The MITRE ATT&CK technique must be documented for each test. This can typically be done by using tags.
- ATTACK_REPLAY: How the test was conducted, such as via an atomic red team reference or command-line details.
- ATTACK_DESCRIPTION: Additional information about the attack if required.
- RESULT: The result of the test that was conducted, following a predefined nomenclature such as OK for a test detected or blocked, or PARTIAL and NOK if unsuccessful. The gaps can easily be identified with the PARTIAL and NOK tests.
- RESULT_DETAILED: This is an additional field (if necessary) that details exactly what the result was, such as whether it was detected, alerted, blocked, failed, or not applicable.
- REASONS: If the result was a failure, then this part should be filled with the reason why it was not blocked or detected. You could also try to standardize as much as possible by providing information such as the fact that the data source was missing, there were no detection rules, or block-mode was not enabled.
- ACTIONS: This column contains the required actions to enhance the security strategy for the specific test. Actions are standardized and we use the following terms: none if no actions are required; change if a change is required; and control if additional controls are required.
- ACTIONS_DETAILS: This column should contain additional details or comments about the action that's required.
- OTHER_NOTES: Other useful information (unstructured).
The spreadsheet for this may look as follows (data from the APT3 Adversary Emulation Field Manual – MITRE ATT&CK website was used here):
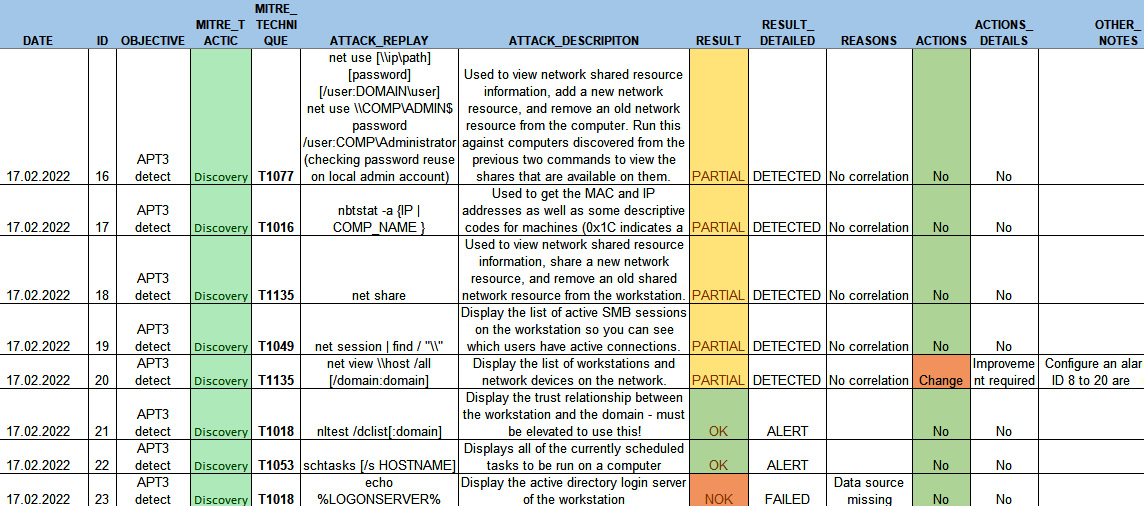
Figure 14.1 – Purple teaming report (partial extract)
The interesting part of using this reporting format is that you can centralize all the results per date in a shared folder, which means that your reports can be generated manually, or with a tool that can easily be aggregated afterward and even sent to your SIEM to automate the reporting process. Of course, some solutions provide structured metrics and reporting, as we saw in Chapter 9, Purple Teaming Infrastructure, with the VECTR solution.
Ingesting data for intelligence
A purple teaming report is an extremely valuable source of information for a company. Being able to correlate this data effectively can offer great visibility into the global security posture of an organization.
In this section, we will rely on this data and perform queries to generate reports and dashboards. To achieve this, we will look at how Splunk can be used as an intelligence engine. The purpose of generating intelligence is to offer an actionable product where a decision can be made regarding it. In the following pages, we will learn how to ingest the data that's been generated by our purple teaming exercises and present several KPI examples that can be used to articulate the relevant intelligence items.
By using Splunk, we can natively ingest CSV files to perform queries on it, but we recommend the indexation approach as it allows the SIEM to ingest and store the data over time, offering a history of the data.
The following screenshot shows a purple teaming report that can be read using pandas, a Python library:
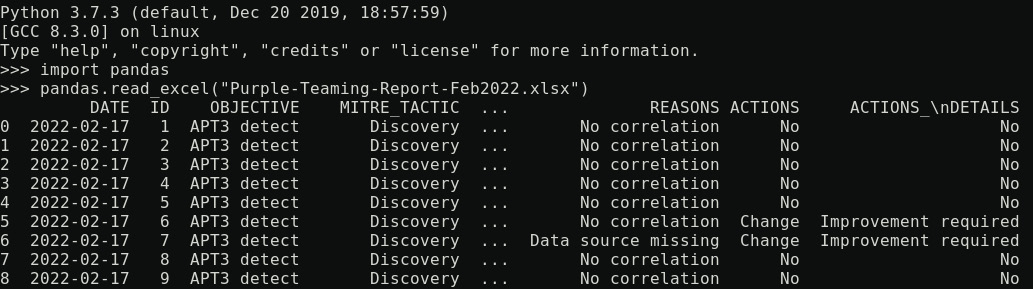
Figure 14.2 – Purple teaming report read using pandas 1/2
Converting this into other formats, such as CSV or JSON, is as simple as adding the to_csv() or to_json() methods to the function, respectively:

Figure 14.3 – Purple teaming report read using pandas 2/2
Writing this to a new file is also very easy:
pandas.read_excel("Purple-Teaming-Report-Feb2022.xlsx").to_csv("Purple-Teaming-Report-Feb2022.csv", index=None, mode='w')
Please note the usage of index=None – this option avoids us having an additional column containing an additional integer ID for each line. mode='w' means that we are in write mode, which basically overrides the existing file. It is possible to set mode='a' for append, which will append the content to an existing file without overriding it. Please note that if you want to append all your reports to an existing file, you should also add the header=None option. This will prevent the existing column headers from being added at each execution. So, in the case of a global CSV file, you would use the following code:
pandas.read_excel("Purple-Teaming-Report-Feb2022.xlsx").to_csv("Purple-Teaming-Report-global.csv", index=None, header=None mode='a')
Alternatively, all the reports can be saved in CSV format via Excel directly.
As we will call the same content multiple times with specific options through the Splunk Query Language (SPL), let's create a macro (https://docs.splunk.com/Documentation/Splunk/8.2.4/Knowledge/Definesearchmacros) called purple_report_macro to avoid repeating the same base query everywhere. This macro will contain the following information:
| inputlookup Purple-Teaming-Report-global.csv
| eval _time=strptime(DATE, "%Y-%m-%d")
| addinfo
| where _time>=info_min_time and _time<info_max_time
The eval command will tell Splunk to use the DATE field as a _time reference.
The addinfo command will instruct Splunk to include the requested parameter in the output of the Splunk query; we will rely on this to use the time picker with our CSV file.
The where condition will then rely on the info_min_time and info_max_time parameters provided by the addinfo command to limit our query to the specified time window regarding the selection that was made in the Splunk time picker.
In the next section, we will rely on examples that use the visualization mode of a CSV file while considering that a global CSV file is read by Splunk using the inputlookup function.
Key performance indicators
There are a lot of theories and best practices around creating and selecting KPIs and for good reason. How many times have you seen a meaningful dashboard within a SOC or even any other department? The answer is likely very few. We, as humans, tend to like what is easy. And it is easy to create KPIs without thinking about the meaning behind them or the message you are trying to convey.
A KPI must have an objective and should help answer a question, therefore it requires a bit more effort – have we improved our security posture since the last adversary emulation exercise? It should also have a goal that should be aligned with an overall strategy.
All these parameters will also help you decide what visualization is better suited to represent the message and the goal of the KPI. A histogram or timeline chart might be better suited to compare values over time compared to a pie chart, which is better suited to represent proportions. For those of you who want to explore the path toward better KPIs, the following link should be a good start: https://www.g2.com/articles/kpi-key-performance-indicator.
Every organization is different, so it is complex to define a standard dashboard that would suit them all. Therefore, we have created various KPI examples that leverage the ingestion of our purple teaming reports in CSV. We will try to provide metrics for each of the security pillars – people, process, and technology.
Number of exercises performed during the year
To obtain this metric, we will count the distinct number of exercise objectives, coupled with the distinct number of dates that exist in the report. To achieve this, we can use the following query in Splunk:
'purple_report_macro'
| eval defined_objective=3
| stats dc(OBJECTIVE) AS number_of_reports_generated
This metric allows us to see the number of purple teaming assessments that have been performed throughout the year. This is because we can select the correct time window from the Splunk time picker.
Proportion of manual tests performed
This metric can show the amount of manually tested techniques (by tactic and in total). It can also help management check whether too many activities have been performed manually, hence identifies automation opportunities:
'purple_report_macro'
| eval atomic_based=if(match(ATTACK_REPLAY, ".*atomic.*"),1,0)
| eventstats count(eval(atomic_based=0)) AS RAW_MANUAL_JOB by MITRE_TACTIC
| eventstats count(eval(atomic_based=1)) AS RAW_AUTO_JOB by MITRE_TACTIC
| stats values(RAW_AUTO_JOB) AS RAW_AUTO_JOB values(RAW_MANUAL_JOB) AS RAW_MANUAL_JOB by MITRE_TACTIC
| eval TOTAL=RAW_MANUAL_JOB+RAW_AUTO_JOB
| eval MANUAL_JOB=ROUND(RAW_MANUAL_JOB/TOTAL*100,0) . "% (".RAW_MANUAL_JOB.")"
| eval AUTO_JOB=ROUND(RAW_AUTO_JOB/TOTAL*100,0) . "% (".RAW_AUTO_JOB.")"
| appendpipe [ |stats sum(RAW_MANUAL_JOB) AS MANUAL_JOB |eval MITRE_TACTIC="TOTAL_MANUAL" ]
| appendpipe [ |stats sum(RAW_AUTO_JOB) AS AUTO_JOB |eval MITRE_TACTIC="TOTAL_ATOMIC"]
| eventstats sum(TOTAL) AS TOTAL_GLOBAL
| eval MANUAL_JOB=if( MITRE_TACTIC="TOTAL_MANUAL", ROUND((MANUAL_JOB/TOTAL_GLOBAL)*100,0) . "% (". MANUAL_JOB . ")",MANUAL_JOB )
| eval AUTO_JOB=if( MITRE_TACTIC="TOTAL_ATOMIC", ROUND((AUTO_JOB/TOTAL_GLOBAL)*100,0) . "% (". AUTO_JOB . ")", AUTO_JOB )
|fields - RAW*, TOTAL_GLOBAL
The output of this query should look as follows:
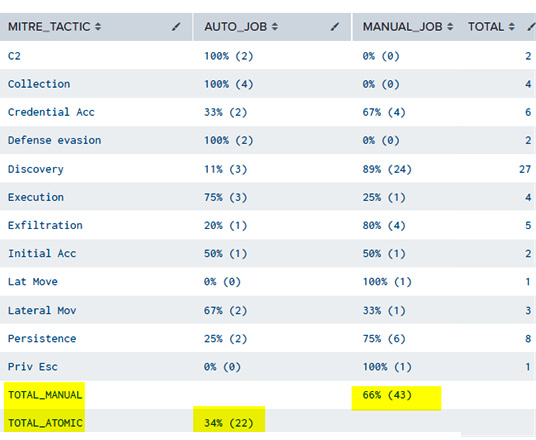
Figure 14.4 – Metric comparison of manual and automated tests by tactic
We could also opt for a graphical overview of this metric by using a simplified version of the previous SPL query:
'purple_report_macro'
| eval atomic_based=if(match(ATTACK_REPLAY, ".*atomic.*"),1,0)
| eventstats count(eval(atomic_based=0)) AS RAW_MANUAL_JOB by MITRE_TACTIC
| eventstats count(eval(atomic_based=1)) AS RAW_AUTO_JOB by MITRE_TACTIC
| stats values(RAW_AUTO_JOB) AS AUTO_JOB values(RAW_MANUAL_JOB) AS MANUAL_JOB by MITRE_TACTIC
This query will produce the following visualization:
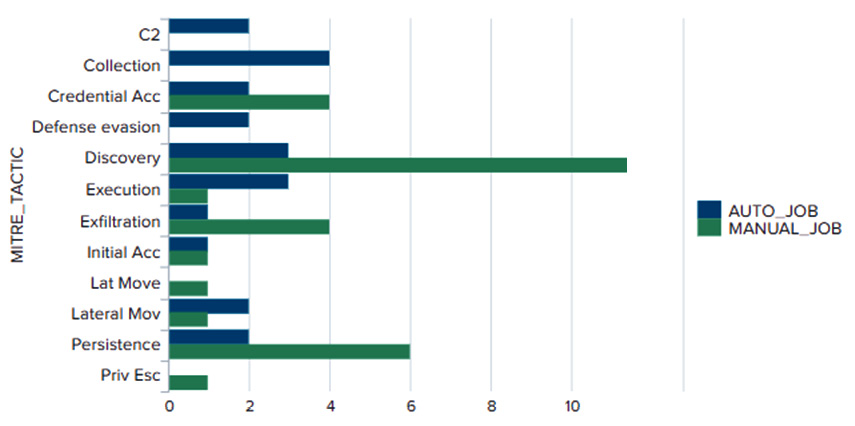
Figure 14.5 – Visualization comparison between manual and automated tests by tactic
Now, let's look at another example that involves changing the infrastructure. Purple teaming activities lead to security controls being implemented and modified, which generates changes.
Number of changes triggered by purple teaming exercises
This metric measures the remediation part of the process.
It can help managers measure how the purple teaming process was efficient in improving the global security posture:
'purple_report_macro'
| where ACTIONS="Change"
| stats count by MITRE_TACTIC
|appendpipe [|stats sum(count) AS TOTAL |eval MITRE_TACTIC="TOTAL"]
| sort - count
The output of the preceding code will look as follows:
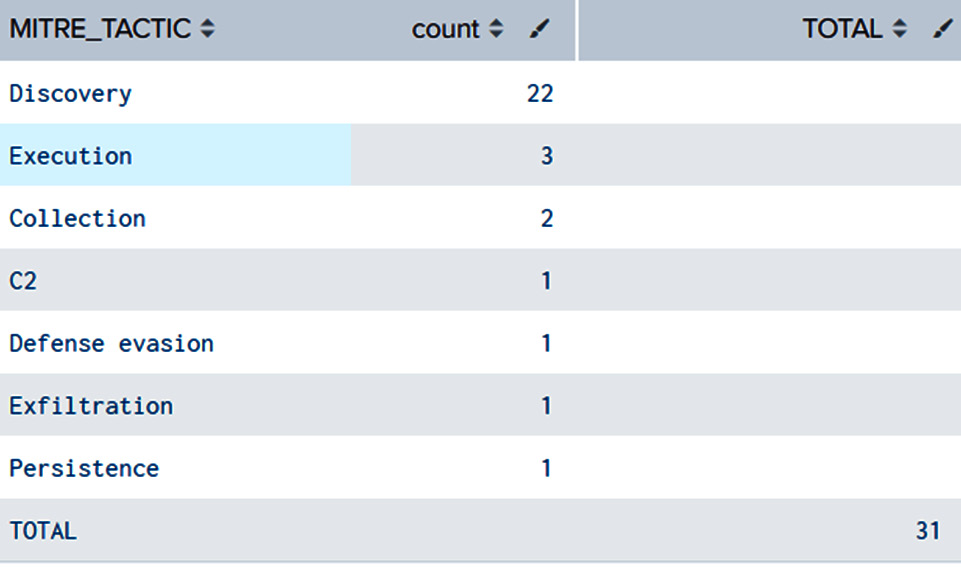
Figure 14.6 – Purple teaming remediation changes by tactics
A global overview of this remediation over time can also be obtained using the following query:
'purple_report_macro'
| bin span=1y _time
| where ACTIONS="Change"
| timechart count(MITRE_TACTIC)
This will result in the following line chart visualization:
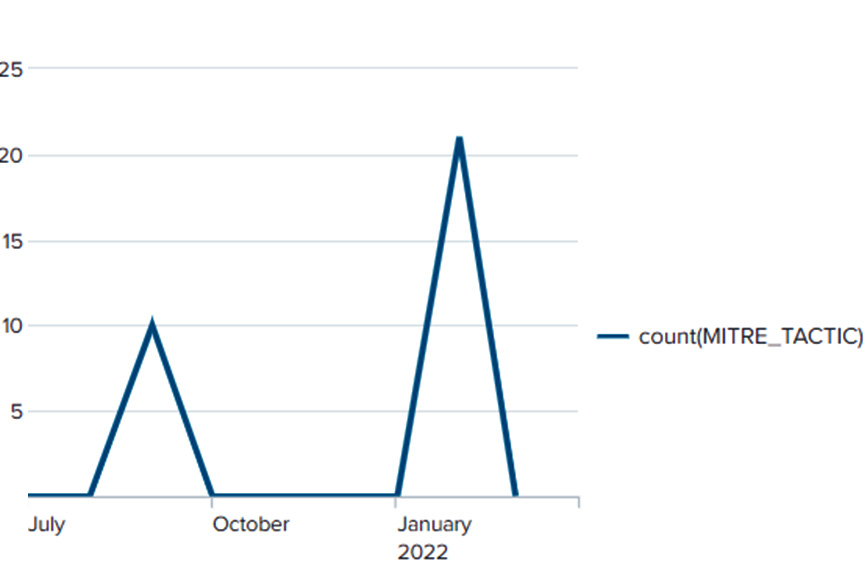
Figure 14.7 – Purple teaming remediation changes and their evolution over time
Remediations can be also linked to the security gaps that have been identified. In the next section, we'll use this metric as a KPI.
Failed security controls per MITRE ATT&CK tactic
This indicator is important for identifying the benefit of purple teaming activities and helping to prioritize improvement opportunities to the management team:
'purple_report_macro'
| fillnull ACTIONS_DETAILS
| stats count by RESULT,REASONS,ACTIONS
| stats sum(count) AS TOTAL_GAPS_IDENTIFIED
This results in the total number of gaps being identified for the selected period, as shown in the following screenshot:
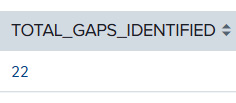
Figure 14.8 – Purple teaming – total gaps identified
A more detailed view can be obtained by using tactics to help management understand where their efforts should be focused:
'purple_report_macro'
| where RESULT!="OK"
| fillnull ACTIONS_DETAILS
| stats count by MITRE_TACTIC
| sort - count
This information can be represented as a pie chart:
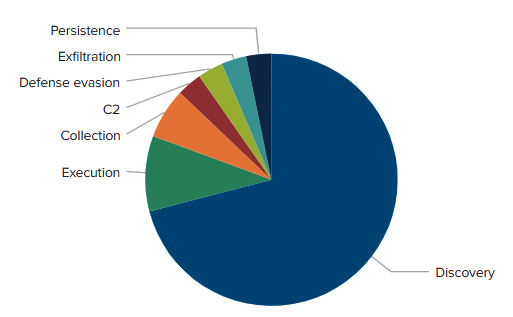
Figure 14.9 – Purple teaming – the total gaps identified by MITRE tactics
Now, let's look at a simple metric that shows the different objectives that have been performed throughout the year.
Purple teaming assessments objectives
By setting Splunk statistics in the OBJECTIVE field, we can group the number of assessments that have been made over the year for each defined objective. This will allow us to see where the emphasis was put in terms of testing:
'purple_report_macro'
| stats count by OBJECTIVE
The following screenshot shows the output of this simple query:
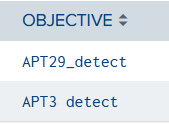
Figure 14.10 – Purple teaming objectives
Defined objectives contain techniques, but compared to the whole MITRE ATT&CK framework, it is interesting to assess our coverage. This is where the next report will help.
MITRE ATT&CK framework testing coverage
This report will show what has been evaluated in terms of some techniques versus all the techniques (we will also need the full MITRE ATT&CK framework as a CSV file to perform comparisons). The dataset is available at https://attack.mitre.org/docs/enterprise-attack-v10.1/enterprise-attack-v10.1.xlsx.
Using a few lines of Python, as described at the beginning of this chapter, it is possible to convert this into a CSV file with pandas so that it can be imported into Splunk:
| inputlookup MITRE-ATTACK-enterprise10.csv
| eval dataset="mitre_attack"
| append
[ 'purple_report_macro'
| stats count by MITRE_TECHNIQUE
| rename MITRE_TECHNIQUE AS ID |fillnull description
| eval dataset="report"]
| eventstats values(dataset) AS dataset values(description) AS description values(tactics) AS MITRE_TACTIC count by ID
| eval covered=if(mvcount(dataset) > 1, "Covered techniques", "Not covered techniques")
| stats count by covered
The output should look as follows:
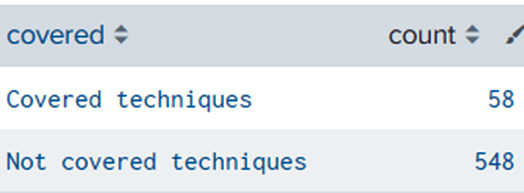
Figure 14.11 – Tested techniques versus MITRE ATT&CK coverage
Tips and Tricks
The CSV file that's been generated can be extremely useful for performing data enrichment on your reports as it contains juicy information, such as the required data sources, full technique descriptions, detection information, and more. This can also be used as a generic enrichment in your alarm output. Sigma rules, for example, now use the MITRE ATT&CK tags, so it will be easy to build enrichment over these detections based on this CSV file and the tags as a common correlation key.
Now that we have learned how to leverage the MITRE ATT&CK framework for current report enrichments, comparison, and project prioritization, we will show you how to present use case coverage in a nice view for management using MITRE ATT&CK Navigator.
MITRE ATT&CK framework detection coverage
This report helps organizations consolidate existing detection techniques by identifying existing security gaps, even in supposedly covered techniques by relying on the analyses of the results of global purple teaming exercises. Different attackers can use variations of an existing technique, which is why this report is important – ensure that even variations of a technique can be detected:
'purple_report_macro'
| stats count by MITRE_TACTIC,MITRE_TECHNIQUE,RESULT,OBJECTIVE
| eval RESULT_SCORE_RAW=case(RESULT="OK", "1", RESULT=="PARTIAL", "0.5", RESULT="NOK", "0")
| eventstats sum(count) AS TOTAL by MITRE_TECHNIQUE
| eval MITRE_TECHNIQUE=MITRE_TACTIC." - ".MITRE_TECHNIQUE
| fields - MITRE_TACTIC
| rename count as sub_total
| eval TECHNIQUE_COVERAGE_RATIO=(((ROUND(sub_total*RESULT_SCORE_RAW,0)/TOTAL))*100)."%"
| stats count by MITRE_TECHNIQUE,TECHNIQUE_COVERAGE_RATIO
| fields - count
| sort + TECHNIQUE_COVERAGE_RATIO
The output will be as follows:
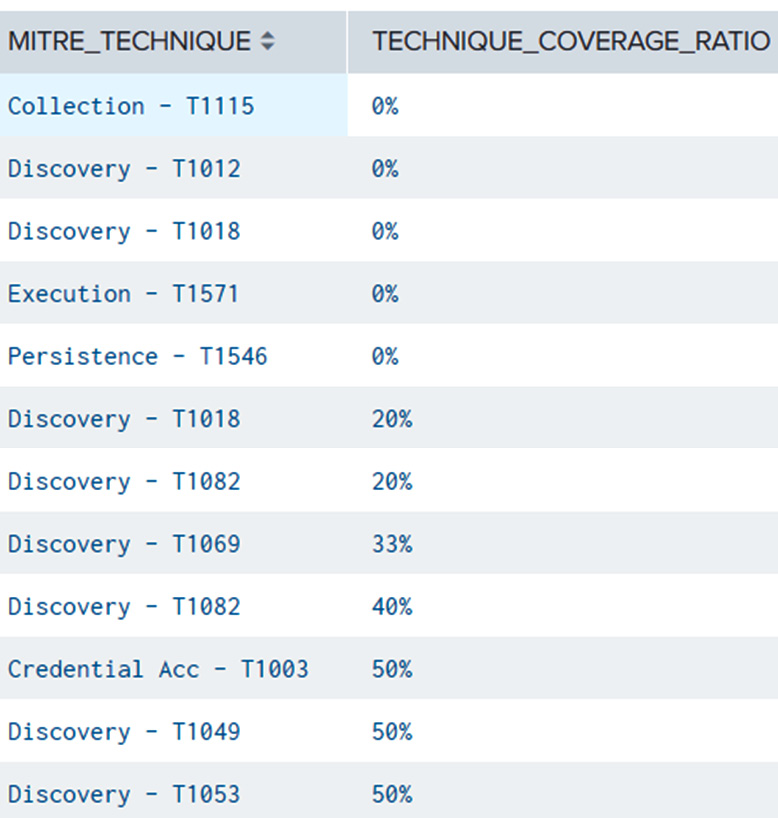
Figure 14.12 – MITRE ATT&CK techniques detection ratio
The previous reports helped us determine our gaps in terms of detection. From there, mitigation can be a long way. This is why we need to prioritize. The next report will be the key to prioritization by analyzing which data sources should be prioritized in terms of missing coverage.
Data source integration prioritization
As demonstrated previously, a simple variation of the previous search will allow us to identify which data source integration should be prioritized to increase your detection capabilities efficiently:
| inputlookup MITRE-ATTACK-enterprise10.csv
| eval dataset="mitre_attack"
| append
[ 'purple_report_macro'
| stats count by MITRE_TECHNIQUE
| rename MITRE_TECHNIQUE AS ID |fillnull description | eval dataset="report"]
| eventstats values(dataset) AS dataset values(description) AS description values(tactics) AS MITRE_TACTIC count by ID
| eval covered=if(mvcount(dataset) > 1, "Covered techniques", "Not covered techniques")
| where covered="Not covered techniques"
| rename "data sources" AS datasources
| rex field=datasources "(?<datasource_shortened>.+?):"
| stats count by datasource_shortened
| sort - count
The output will be as follows:
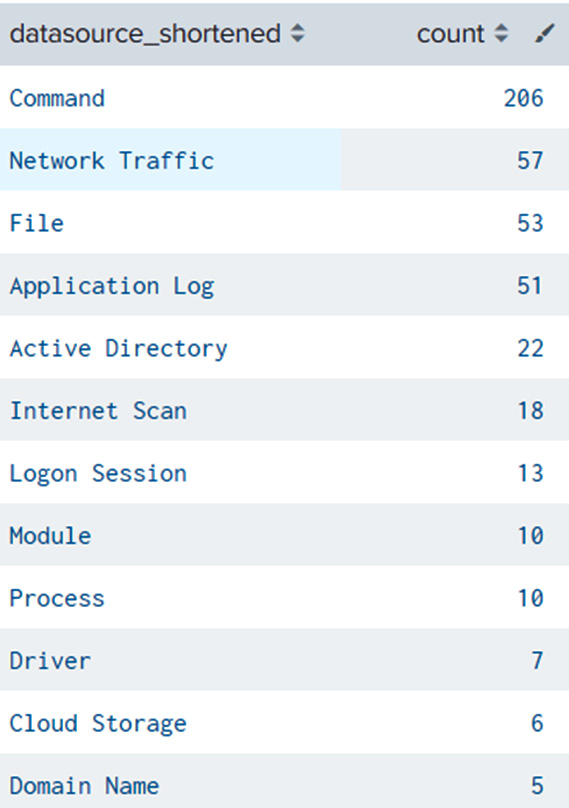
Figure 14.13 – Data source integration prioritization
From Sigma to MITRE ATT&CK Navigator
If you use Sigma rules for your detection, you can represent your MITRE ATT&CK coverage using MITRE ATT&CK Navigator (https://mitre-attack.github.io/attack-navigator/). While this is not directly related to the purple teaming exercises, the latter should have a great influence on the improvement of these detection rules. Therefore we think that this metric is relevant and should be evaluated when we need to report on our purple teaming exercises' efficacy.
The sigma2attack tools provided in Sigma's GitHub repository allow us to generate JavaScript Object Notation (JSON) that can be directly ingested into MITRE ATT&CK Navigator. The first step is to use your rule repository as an argument, followed by the name of your output file, in our case heatmap.json, as shown in the following code:
./sigma2attack --rules-directory /sigma_rules/ --out-file heatmap.json
This action will generate the required JSON file so that you can import it into the Navigator interface:
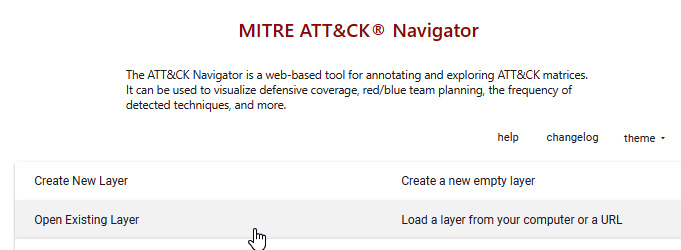
Figure 14.14 – MITRE ATT&CK Navigator
MITRE ATT&CK Navigator can be found at https://mitre-attack.github.io/attack-navigator/.
Once imported, you will obtain the following heatmap:
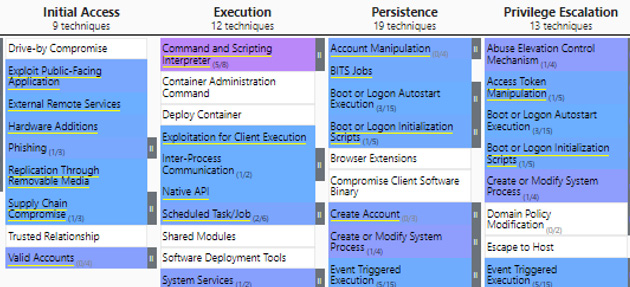
Figure 14.15 – MITRE ATT&CK Navigator generated heatmap extract
Reports and KPIs exist because they can be used to become actionable. They can help managers and teams to better understand the current activities, plan for the future, estimate budgets from one year to another, identify risks, prioritize activities in accordance, and so on.
This topic by itself could be covered in an entire book; in this chapter, we tried to highlight interesting KPIs and reports, but we also know that it depends on your organization.
Additionally, we have seen that by using minimal data (a simple Excel spreadsheet), it is possible to create actionable outputs for both technical and management functions.
The following are some extra ideas that could be explored to generate relevant KPIs for your organization: Return on Investments (ROI) on a security device, evolution of security investments, measuring collaboration between teams and PTX metrics.
Now that we have looked at different examples of metrics that can be incorporated into scheduled reporting or within a dashboard, we must ensure that decisions are made to respond to the findings that have been observed.
As we've mentioned several times throughout this book, the importance of any process is to learn and improve over time. The famous incident response process step known as lessons learned is key if we don't want to make the same error repeatedly. The same principle must apply here, and we strongly believe that purple teaming, if done correctly (documented and communicated correctly), will ensure any organization invests effort and resources in the right domain. One last question remains, though – what will the future hold? What is on the horizon of purple teaming and how will it evolve? That is what we are going to discuss in the next section.
The future of purple teaming
We are reaching the end of this book and we hope it was as interesting a journey for you as it has been for us. Now, it is time to conclude this final chapter by discussing the future of purple teaming and what is waiting for us in the coming years.
When it comes to predictions and future thoughts about security concepts and technologies, there is one resource that helps open ideas for debate – The Hype Cycle for Security Operations, by Gartner Research. This can be found at https://www.gartner.com/en/doc/security-operations.
The hype cycle is a conceptual representation of the maturity life cycle of a piece of technology over time. It starts with an innovation trigger, which is a representation of a product or new concept that creates expectations for the public. This is followed by the peak of inflated expectations, which results in "unrealistic projections" as the technology is pushed to its limits. Following the various failures of the previous phase, the technology ends up in the trough of disillusionment phase, making it less attractive and less publicized. Once these expectations have been readjusted and the technology is truly understood, it enters the slope of enlightenment phase. Finally, once the technology has matured, more and more organizations adopt the technology to reach its plateau of productivity.
Unfortunately, Gartner does not talk specifically about purple teaming. However, they do mention breach and attack simulation (BAS) as a, currently, immature solution that will bring a high value to organizations in the future. They see the mainstream adoption of such solutions happening in 5 to 10 years:
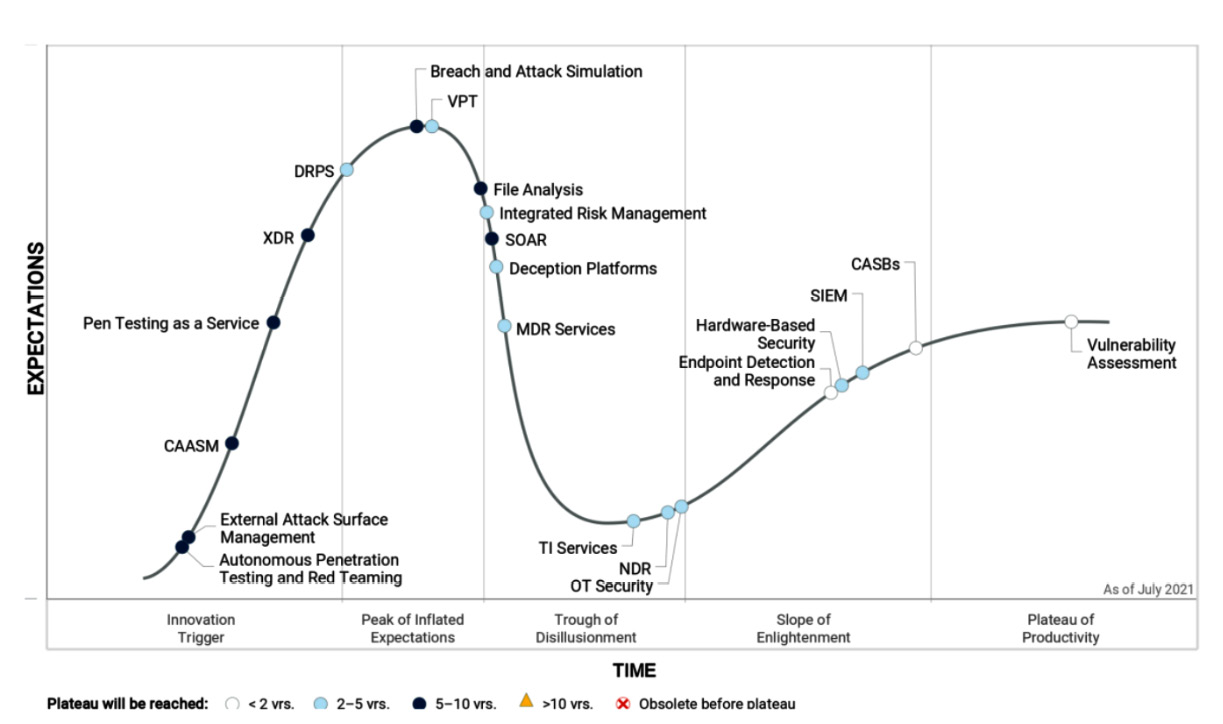
Figure 14.16 – The Hype Cycle for Security Operations, by Gartner Research
From our point of view, we see security testing solutions and, more generally, BAS for continuous testing as the first step for organizations to start adopting a purple teaming mindset. Later on, the idea is to move on with adversary emulation, but this doesn't mean that we abandon our security testing and BAS activities. Therefore, it may take longer for organizations to adopt a true purple teaming approach.
Another key point to mention is the dependency of purple teaming adoption over the maturity of cyber threat intelligence (CTI). As we've mentioned throughout this book, MITRE ATT&CK has helped with this for a few years. However, we must highlight that covering the entire framework is not an end goal by itself as we know that it is not exhaustive and is mostly there to provide a common language between operational teams. Even though we are excited to see its evolution in the future, especially with initiatives such as the Center for Threat-Informed Defense (CTID), the maturity of organizations' CTI functions, as well as community-based feeds and commercial CTI solutions, will greatly help people understand that we must test our defenses against the threat actors we are likely to face. This means we must focus our efforts on what really matters. The more "actionable" the CTI is, the more it will be adopted.
Another interesting topic that purple teaming can help address is the ROI of an overall cybersecurity program. For decades, it has been an unanswered need for Chief Information Security Officers (CISOs) to understand whether their investments were effective and timely. Once again, as purple teaming focuses on the emulation of adversaries that we are likely to face in the close future, getting results, gaps, and recommendations should help CISOs shape their cybersecurity roadmap. It must also provide relevant metrics to management and to the enterprise risk management function to give them a more realistic picture of the security posture of the organization.
In Chapter 1, Contextualizing Threats and Today's Challenges, we mentioned several issues that purple teaming aims at solving. The main issue is the toxic rivalry between the red and blue teams, which is, today, not working for the good of organizations. This mindset must be ended by adopting a collaborative approach. Teams must sit at the same table to exchange, discuss, and share their knowledge to create value and better decision-making that will benefit the overall organization's cyber resilience. Purple teaming is the glue that will help create bonds between teams and help them to aim at a common goal.
We also think that purple teaming will play a role in creating awareness among organizations regarding the importance of people. Purple teaming can be supported by tools and solutions, but it highlights the fact that a workforce is needed to maintain, configure, and improve the defenses of an organization throughout. We might have the best-of-breed solutions from the market and still perform poorly during a purple teaming exercise because our people are not trained, they don't practice, they don't learn. Hence, the hope for a shift of investments from tools-only to a balanced approach of people, processes, and technologies could be expected.
Finally, we also hope that the mindset of purple teaming, "teamwork makes the dream work", will be adopted for broader use than just for adversary emulation. That is what we tried to infuse with our work on PTX. This acronym was of course a nod at the recent XDR market. Besides that, we are convinced that a collaborative approach is necessary to face tomorrow's threats.
The recent threat landscape has shown us that the attackers are extremely well organized, as we've seen in the recent leak from the Conti Ransomware group (we recommend this article from Brian Krebs: https://bit.ly/3CMIrM3). We also saw malware code being exchanged, shared, and sold, which demonstrates a high level of collaboration between threat actors.
It is time to stop fighting and comparing with our colleagues, peers, and competitors. We must act as one. Together, we are stronger.
Summary
In this chapter, we covered the different KPIs and reports that managers and technical teams can use to analyze and plan resources in terms of people, process, and technology improvements. This can help organizations analyze the ROI of a security strategy. We also introduced various practical approaches to automatically extract intelligence from simple data, such as purple teaming reports.
Finally, we concluded this chapter with our vision of the future for purple teaming activities, especially what could be an expected timeline for broad adoption. We also discussed how it is related to the organizations' CTI maturity and we highlighted some hopes for having security functions focusing more on the people and not just the technology.
Thank you so much for your interest in this topic. We hope you are as excited as we are for what the future holds.
Also we'd really love to hear your story about purple teaming whether you are an experienced practitioner or a complete begineer, so please don't hesitate to reach out to us on any social media.