
15
Debugging
Generally speaking, the cycle for debugging problems has the following steps:
- Detecting the problem. A new problem or defect is discovered
- Analyzing and assigning priority to this problem, to be sure that we spend time on meaningful problems and focus on the most important ones
- Investigating what exactly causes the problem. Ideally, this should end with a way of replicating the problem in a local environment
- Replicating the problem locally, and getting into the specific details on why it happens
- Fixing the problem
As you can see, the general strategy is to first locate and understand the problem, so we can then properly debug and fix it.
In this chapter, we'll cover the following topics to see effective techniques on how to work through all those phases:
- Detecting and processing defects
- Investigation in production
- Understanding the problem in production
- Local debugging
- Python introspection tools
- Debugging with logs
- Debugging with breakpoints
Let's take a look at the very first step when dealing with defects.
Detecting and processing defects
The first step is actually detecting the problem. This can sound a bit silly, but it's a quite crucial stage.
While we will mainly use the term "bug" to describe any defect, remember that it may include details like bad performance or unexpected behavior that may not be properly categorized as a "bug." The proper tool to fix the problem could be different, but the detection is normally done in a similar way.
Detecting problems can be done in different ways, and some may be more evident than others. Normally, once the code is in production, defects will be detected by a user, either internally (best case) or externally (worst case), or through monitoring.
Keep in mind that monitoring will only be able to capture obvious, and typically serious, errors.
Based on how problems are detected, we can categorize them into different severities, for example:
- Catastrophic problems that are completely stopping the operation. These bugs mean that nothing, not even non-related tasks in the same system, works
- Critical problems that stop the execution of some tasks, but not others
- Serious problems that will stop or cause problems with certain tasks, but only in some circumstances. For example, a parameter is not checked and produces an exception, or some combination produces a task so slow that it produces a timeout
- Mild problems, which include tasks containing errors or inaccuracies. For example, a task produces an empty result in certain circumstances, or a problem in the UI that doesn't allow calling a functionality
- Cosmetic or minor problems like typos and similar
Because every development team is limited, there will always be too many bugs and having the proper approach on what to pay attention to and what to fix first is critical. Normally bugs in the first group will obviously be quite pressing to fix and will require an immediate all-hands reaction. But categorization and prioritization are important.
Having a clear signal on what things to look for next will help developers have a clear view and be efficient by spending time on important problems and not whatever is the latest. Teams themselves can perform some triage of problems, but it's good to add some context.
Keep in mind that usually, you need to both correct bugs and implement new features, and each of these tasks can distract from the other.
Fixing bugs is important, not only for the resulting quality of the service, as any user will find working with a buggy service very frustrating. But it's also important for the development team, as working with a low-quality service is also frustrating for developers.
A proper balance needs to be struck between bug fixing and introducing new features. Also remember to allocate time for the corresponding new bugs introduced for new features. A feature is not ready when released, it's ready when its bugs are fixed.
Any detected problem, except the catastrophic ones, where context is irrelevant, should capture the context surrounding the steps that were required to produce the error. The objective of this is to be able to reproduce the error.
Reproducing the error is a critical element of fixing it. The worst-case scenario is that a bug is intermittent or appears to happen at random times. More digging will be required in order to understand why it is happening when it's happening.
When a problem can be replicated, you're halfway to the solution. The problem can be ideally replicated into a test, so it can be tested over and over until the problem is understood and fixed. In the best situations, this test can be a unit test, if the problem affects a single system and all the conditions are understood and can be replicated. If the problem affects more than one system, it may be necessary to create integration tests.
A common problem during an investigation is to find out what the specific circumstances are that are provoking the problem, for example, data that's set up in a particular way in production and that triggers some issue. Finding exactly what is causing the problem can be complicated in this environment. We will talk later in the chapter about finding a problem in production.
Once a problem is categorized and replicable, the investigation can proceed to understand why.
Visually inspecting the code and trying to reason where problems and bugs are is normally not good enough. Even very simple code will surprise you in terms of how it's executed. Being able to analyze how, in a particular case, the code is executing with precision is critical for analyzing and fixing problems that are found.
Investigation in production
Once we are aware that we have a problem in production, we need to understand what is happening and what the key elements that produce it are.
It's very important to remark on the importance of being able to replicate a problem. If that's the case, tests can be done to produce the error and follow the consequences.
The most important tools when analyzing why a particular problem is produced are the observability tools. That's why it is important to do preparation work in advance to be sure to be able to find problems when required.
We talked in previous chapters about logs and metrics. When debugging, metrics are normally not relevant, except to show the relative importance of a bug. Checking an increase in returned errors can be important to detect that there's an error, but detecting what error will require more precise information.
Do not underestimate metrics, though. They can help quickly determine what specific component is failing or if there's any relationship with other elements, for example, if there's a single server that's producing errors, or if it has run out of memory or hard drive space.
For example, a problematic server can produce apparently random errors, if the external requests are directed to different servers, and the failure is related to a combination of a specific request addressed to a specific server.
But in any case, logs will generally be more useful in determining which part of the code is behaving badly. As we saw in Chapter 12, Logging, we can describe error logs as detecting two kinds of problems:
- Expected errors. In this case, we did the work of debugging the error beforehand and knowing what happened should be easy. Examples of this can be an external request that returns an error, a database that cannot be connected to, etc.
Most of these errors will be related to external services (from the point of view of the one raising the error) that are misbehaving. This could indicate a network problem, misconfiguration, or problems in other services. It is not rare that errors propagate through the system as an error may provoke a cascading failure. Typically, though, the origin will be an unexpected error and the rest will be expected ones, as they'll receive the error from an external source.
- Unexpected errors. The sign of these errors are logs indicating that something has gone wrong, and in most modern programming languages, a stack trace of some sort in the logs detailing the line of code when the error was produced.
By default, any kind of framework that executes tasks, like a web framework or task management system, will produce an error, but keep the system stable. This means that only the task producing the error will be interrupted and any new task will be handled from scratch.
The system should provide the proper handling for the task. For example, a web server will return a 500 error, and a task management system may retry the task after some delay. This may lead to the error being propagated, as we saw before.
In any of the two cases, the main tool to detect what the problem was will be logs. Either the logs show a known problem that is captured and properly labeled, or the logs show a stack trace that should indicate what specific part of the code is showing the error.
Finding the element and part of the code that is the source of the error is important for understanding the problem and for debugging the specific problem. This is particularly important in microservices architectures, as they'll have multiple independent elements.
We talked about microservices and monolithic architectures in Chapter 9, Microservices vs Monolith. Monoliths are easier to deal with in terms of bugs, as all the code is handled on the same site, but anyway they'll become more and more complex as they grow.
Keep in mind that sometimes it is not possible to totally avoid errors. For example, if there's an external dependency calling an external API and it has a problem, this may trigger internal errors. These can be mitigated, failing gracefully, or generating a state of "service not available." But the root of the error may not be possible to fix totally.
Mitigating external dependencies may require creating redundancy, even using different suppliers so as not to be dependent on a single point of failure, though this may not be realistic, as it can be extremely costly.
We can have these cases be notified to us, but they won't require further short-term action.
In other cases, when the error is not immediately obvious and further investigation needs to be done, it will require some debugging.
Understanding the problem in production
The challenge in complex systems is the fact that detecting problems becomes exponentially more complicated. As multiple layers and modules are added and interact with each other, bugs become potentially more subtle and more complex.
As we saw before, microservice architectures can be especially difficult to debug. The interaction between different microservices can produce complex interactions that can produce subtle problems in the integration of its different parts. This integration can be difficult to test in integration tests, or perhaps the source of the problem is in a blind spot of the integration tests.
But monoliths can also have problems as their parts grow more complex. Difficult bugs may be produced due to the interaction of specific production data that interacts in an unexpected way. A big advantage of monolithic systems is that the tests will cover the whole system, making it easier to replicate with unit or integration tests.
The objective in this step, though, should be to analyze enough of the problem in production to be able to replicate it in a local environment, where the smaller scale of the environment will make it easier and less invasive to probe and make changes. Once enough information has been collected, it's better to leave any production environment alone and focus on the specifics of the problem.
Remember that having a replicable bug is more than half the battle! Once the problem can be categorized as a replicable set of steps locally, a test can be created to produce it over and over and debug in a controlled environment.
Sometimes, general logging enabled is enough to determine exactly what the bug is or how to replicate it locally. In those cases, it may be necessary to research the circumstances that trigger the problem.
Logging a request ID
One of the problems when analyzing a large number of logs is correlating them. To properly group logs that are related to each other, we could filter by the host that generates them and select a short window of time, but even that may not be good enough as two or more different tasks can be running at the same time. We need a unique identifier per task or request that can trace all logs coming from the same source. We will call this identifier a request ID, as they are added automatically in many frameworks. This sometimes is called a task ID in task managers.
In cases where multiple services are involved, like in microservice architectures, it is very important to keep a common request ID that can work to trace the different requests between different services. That allows you to follow and correlate different logs in the system from different services that have the same origin.
The following diagram shows the flow between a frontend and two backend services that are called internally. Note that the X-Request-ID header is set by the frontend and it's forwarded to service A, which then forwards it toward service B.
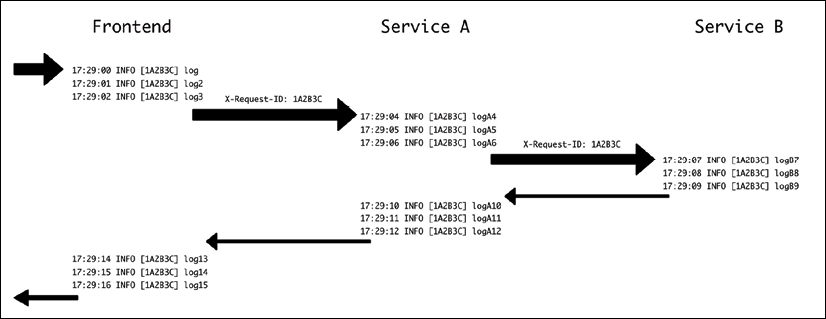
Figure 15.1: Request ID across multiple services
Because all of them share the same request ID, logs can be filtered by that information to obtain all the information about a single task.
To achieve this, we can use the module django_log_request_id to create a request ID in Django applications.
You can see the whole documentation here: https://github.com/dabapps/django-log-request-id/.
We show some code in GitHub at https://github.com/PacktPublishing/Python-Architecture-Patterns/tree/main/chapter_15_debug following the example across the book. This requires creating a virtual environment and installing the package, alongside the rest of the requirements.
$ python3 -m venv ./venv
$ source ./venv/bin/activate
(venv) $ pip install -r requirements.txt
The code has been changed to include some extra logs in the microposts/api/views.py file (as seen at https://github.com/PacktPublishing/Python-Architecture-Patterns/blob/main/chapter_15_debug/microposts/api/views.py):
from rest_framework.generics import ListCreateAPIView
from rest_framework.generics import RetrieveUpdateDestroyAPIView
from .models import Micropost, Usr
from .serializers import MicropostSerializer
import logging
logger = logging.getLogger(__name__)
class MicropostsListView(ListCreateAPIView):
    serializer_class = MicropostSerializer
    def get_queryset(self):
        logger.info('Getting queryset')
        result = Micropost.objects.filter(user__username=self.kwargs['username'])
        logger.info(f'Querysert ready {result}')
        return result
    def perform_create(self, serializer):
        user = Usr.objects.get(username=self.kwargs['username'])
        serializer.save(user=user)
class MicropostView(RetrieveUpdateDestroyAPIView):
    serializer_class = MicropostSerializer
    def get_queryset(self):
        logger.info('Getting queryset for single element')
        result = Micropost.objects.filter(user__username=self.kwargs['username'])
        logger.info(f'Queryset ready {result}')
        return result
Note how this is now adding some logs when accessing the list collections page and the individual micropost page. We will use the example URL /api/users/jaime/collection/5.
To enable the usage of the request ID, we need to properly set up the configuration in microposts/settings.py (https://github.com/PacktPublishing/Python-Architecture-Patterns/blob/main/chapter_15_debug/microposts/microposts/settings.py):
LOG_REQUEST_ID_HEADER = "HTTP_X_REQUEST_ID"
GENERATE_REQUEST_ID_IF_NOT_IN_HEADER = True
LOGGING = {
    'version': 1,
    'disable_existing_loggers': False,
    'filters': {
        'request_id': {
            '()': 'log_request_id.filters.RequestIDFilter'
        }
    },
    'formatters': {
        'standard': {
            'format': '%(levelname)-8s [%(asctime)s] [%(request_id)s] %(name)s: %(message)s'
        },
    },
    'handlers': {
        'console': {
            'level': 'INFO',
            'class': 'logging.StreamHandler',
            'filters': ['request_id'],
            'formatter': 'standard',
        },
    },
    'root': {
        'handlers': ['console'],
        'level': 'INFO',
    },
}
The LOGGING dictionary is a characteristic in Django that describes how to log. filters adds extra information, in this case, our request_id, formatter describes the specific format to use (note that we add request_id as a parameter, which will be presented in brackets).
handlers describes what happens to each message, joining filters and formatter with information about levels to display and where to send the info. In this case, StreamHandler will send the log to stdout. We set all the logs on the root level to use this handler.
Check the Django documentation for more information: https://docs.djangoproject.com/en/3.2/topics/logging/. Logging in Django may take a bit of experience in setting all the parameters correctly. Take your time when configuring it.
The lines,
LOG_REQUEST_ID_HEADER = "HTTP_X_REQUEST_ID"
GENERATE_REQUEST_ID_IF_NOT_IN_HEADER = True
state that a new Request ID parameter should be created if not found as a header in the input and that the name of the header will be X-Request-ID.
Once all of this is configured, we can run a test starting the server with:
(venv) $ python3 manage.py runserver
Watching for file changes with StatReloader
2021-10-23 16:11:16,694 INFO     [none] django.utils.autoreload: Watching for file changes with StatReloader
Performing system checks...
System check identified no issues (0 silenced).
October 23, 2021 - 16:11:16
Django version 3.2.8, using settings 'microposts.settings'
Starting development server at http://127.0.0.1:8000/
Quit the server with CONTROL-C
On another screen, make a call to the test URL with curl:
(venv) $ curl http://localhost:8000/api/users/jaime/collection/5
{"href":"http://localhost:8000/api/users/jaime/collection/5","id":5,"text":"A referenced micropost","referenced":"dana","timestamp":"2021-06-10T21:15:27.511837Z","user":"jaime"}
At the same time, you'll see the logs on the server screen:
2021-10-23 16:12:47,969 INFO     [66e9f8f1b43140338ddc3ef569b8e845] api.views: Getting queryset for single element
2021-10-23 16:12:47,971 INFO     [66e9f8f1b43140338ddc3ef569b8e845] api.views: Queryset ready <QuerySet [<Micropost: Micropost object (1)>, <Micropost: Micropost object (2)>, <Micropost: Micropost object (5)>]>
[23/Oct/2021 16:12:47] "GET /api/users/jaime/collection/5 HTTP/1.1" 200 177
Which, as you can see, added a new request ID element, 66e9f8f1b43140338ddc3ef569b8e845 in this case.
But the request ID can also be created by calling with the proper header. Let's try again, making another curl request and the -H parameter to add a header.
$ curl -H "X-Request-ID:1A2B3C" http://localhost:8000/api/users/jaime/collection/5
{"href":"http://localhost:8000/api/users/jaime/collection/5","id":5,"text":"A referenced micropost","referenced":"dana","timestamp":"2021-06-10T21:15:27.511837Z","user":"jaime"}
You can check the logs in the server again:
2021-10-23 16:14:41,122 INFO     [1A2B3C] api.views: Getting queryset for single element
2021-10-23 16:14:41,124 INFO     [1A2B3C] api.views: Queryset ready <QuerySet [<Micropost: Micropost object (1)>, <Micropost: Micropost object (2)>, <Micropost: Micropost object (5)>]>
[23/Oct/2021 16:14:41] "GET /api/users/jaime/collection/5 HTTP/1.1" 200 177
This shows that the request ID has been set by the value in the header.
The request ID can be passed over other services by using the Session included in the same module, which acts as a Session in the requests module.
from log_request_id.session import Session
session = Session()
session.get('http://nextservice/url')
This will set the proper header in the request, passing through it to the next step of the chain, like service A or service B.
Be sure to check the django-log-request-id documentation.
Analyzing data
If the default logs are not enough to understand the problem, the next stage in those cases is understanding the data related to the problem. Typically, the data storage may be inspected to follow up on the related data for the task, to see if there's any indication about that.
This step may be complicated by either missing data or data restrictions that make it difficult or impossible to obtain the data. Sometimes only a few people in the organization can access the required data, which may delay the investigation. Another possibility is that the data is impossible to retrieve. For example, data policies may not store the data, or the data may be encrypted. This is a regular occurrence in cases involving Personally Identifiable Information (PII), passwords, or similar data.
Analyzing the stored data may require performing ad hoc manual queries to databases or other kinds of data storage to find out if the related data is consistent or if there is any combination of parameters that's not expected.
Remember that the objective is to capture information from production to be able to understand and replicate the problem independently.In some cases, when investigating a problem in production, it is possible that changing the data manually will fix the issue. This could be necessary in some emergency situations, but the objective still needs to be to understand why this inconsistent situation of the data has been possible or how the service should be changed to allow you to deal with this data situation. Then the code can be changed accordingly to ensure that the problem doesn't happen in the future.
If investigating the data is not enough to be able to understand the problem, it may be necessary to increase the information on the logs.
Increasing logging
If the regular logs and an investigation of the data don't bear fruit, it may be necessary to increase the level of logging with special logs, following the problem.
This is a last-resort method, because it has two main problems:
- Any change in the logs needs to be deployed, which makes it costly and expensive to run.
- The number of logs in the system will be incremented, which will require more space to store them. Depending on the number of requests in the system, this can create pressure on the logging system.
These extra logs should always be short term, and should be reverted as soon as possible.
While enabling an extra level of logging, like setting logs to DEBUG level, is technically possible, this will probably increase the logs too much, and will make it difficult to know what the key ones are in the massive amount of logs. With some DEBUG logs, specifics of the area under investigation can be temporally promoted to INFO or higher to make sure that they are properly logged.
Be extra careful with information that's logged temporally. Confidential information like PII should not be logged. Instead, try to log surrounding information that can help find out the problem.
For example, if there's a suspicion that some unexpected character may be producing a problem with the algorithm to check the password, instead of logging the password, some code can be added to detect whether there's an invalid character.
For example, assuming there's a problem with a password or secret that has an emoji, we could extract only non-ASCII characters to find out if this is the problem, like this:
>>> password = 'secret password '
>>> bad_characters = [c for c in password if not c.isascii()]
>>> bad_characters
['']
'
>>> bad_characters = [c for c in password if not c.isascii()]
>>> bad_characters
['']
The value in bad_characters can be then logged, as it won't contain the full password.
Note that this assumption is probably easier to test quickly and without any secret data with a unit test. This is just an example.
Adding temporal logs is cumbersome, as it typically will involve several deployments until finding out the problem. It's always important to keep the number of logs to a minimum, cleaning up the useless ones as quickly as possible, and remember to remove them completely after the work is done.
Remember that the work is just to be able to reproduce the problem locally, so you can more efficiently investigate and fix the problem locally. Sometimes the problem may be deemed obvious after some temporal log, but, good TDD practice, as we saw in Chapter 10, Testing and TDD, tests displaying and then fixing the bug.
Once we can detect the problem locally, it is time to go to the next step.
Local debugging
Debugging locally means exposing and fixing a problem once we have a local reproduction.
The basic steps of debugging are reproducing the problem, knowing what the current, incorrect result is, and knowing what the correct result should be. With that information, we can start debugging.
A great way of creating the reproduction of the problem is with a test, if that's possible. As we saw in Chapter 10, Testing and TDD, this is the basis of TDD. Create a test that fails and then change the code to make it pass. This approach is very usable when fixing bugs.
Taking a step back, any debugging process follows the following process:
- You realize there's a problem
- You understand what the correct behavior should be
- You investigate and discover why the current system behaves incorrectly
- You fix the problem
Keeping this process in mind is also useful from a local debugging perspective, though at this point, it is likely that steps 1 and 2 are already sorted out. In the vast majority of cases, the difficult step is 3, as we've been seeing throughout the chapter.
To understand, once presented with the code, why the code is behaving as it is, a method similar to the scientific method can be used to systematize the approach:
- Measure and observe the code
- Produce a hypothesis on why a certain result is being produced
- Validate or disprove the hypothesis by either analyzing the produced state, if possible, or creating a specific "experiment" (some specific code, like a test) to force it to be produced
- Use the resulting information to iterate the process until the source of the problem is totally understood
Note that this process doesn't necessarily need to be applied to the whole problem. It can be focused on the specific parts of the code that can influence the problem. For example, is this setting activated in this case? Is this loop in the code being accessed? Is the value calculated lower than a threshold, which will later send us down a different code path?
All those answers will increase the knowledge of why the code is behaving in the way that it's behaving.
Debugging is a skill. Some people may say it's an art. In any case, it can be improved over time, as more time gets invested in it. Practice plays an important role in developing the kind of intuition that involves knowing when to take a deeper look into some areas over others to identify the promising areas where the code may be failing.
There are some general ideas that can be very helpful when approaching debugging:
- Divide and conquer. Take small steps and isolate areas of the code so it's possible to simplify the code and make it digestible. As important as understanding when there's a problem in the code is detecting when there isn't so we can set our focus on the relevant bits.
Edward J. Gauss described this method in what he called the "wolf fence algorithm" in a 1982 article:
There's one wolf in Alaska; how do you find it? First build a fence down the middle of the state, wait for the wolf to howl, determine which side of the fence it is on. Repeat process on that side only, until you get to the point where you can see the wolf.
- Move backward from the visible error. It's quite common that the source of a problem is not where an error is raised or obvious, but instead the error was produced earlier. A good approach is to move backward from the position where the problem is obvious and then validate the flow. This allows you to ignore all code that comes after the problem, and have a clear path of analysis.
- You can make an assumption, as long as you can then prove that this assumption is correct. Code is complex, and you won't be able to keep the whole codebase in your head. Instead, focus needs to be carefully moved across different parts, making assumptions about what the rest is returning.
As Sherlock Holmes once said:
When you have eliminated the impossible, whatever remains, however improbable, must be the truth.
Properly eliminating everything can be arduous, but removing proven assumptions from the mind will reduce the amount of code to analyze and verify.
But those assumptions need to be validated to really prove that they are correct, or we risk the chance of making a wrong assumption. It's very easy to fall into bad assumptions and think that the problem is in a particular part of the code when it really is in another.
Though the whole range of techniques and possibilities of debugging is there, and certainly sometimes bugs can be convoluted and difficult to detect and fix, most bugs are typically easy to understand and fix. Perhaps they are a typo, an off-by-one error, or a type error that needs to be checked.
Keeping the code simple helps a lot in later debugging problems. Simple code is easy to understand and debug.
Before we move on to specific techniques, we need to understand the tools in Python help in our investigation.
Python introspection tools
As Python is a dynamic language, it's very flexible and allows you to perform actions on its objects to discover their properties or types.
This is called introspection, and allows you to inspect elements without having too much context about the objects to be inspected. This can be performed at runtime, so it can be used while debugging to discover the attributes and methods of any object.
The main starting point is the type function. The type function simply returns the class of an object. For example:
>>> my_object = {'example': True}
>>> type(my_object)
<class 'dict'>
>>> another_object = {'example'}
>>> type(another_object)
<class 'set'>
This can be used to double-check that an object is of the expected type.
A typical example error is to have a problem because a variable can be either an object or None. In that case, it's possible that a mistake handling the variable makes it necessary to double-check that the type is the expected one.
While type is useful in debugging environments, avoid using it directly in your code.
For example, avoid comparing defaults of None, True, and False with their types, as they are created as singletons. That means there's a single instance of each of these objects, so every time that we need to verify if an object is None, it's better to make an identity comparison, like this:
>>> object = None
>>> object is None
True
Identity comparisons can prevent the kind of problem where the usage of None or False can't be distinguished in an if block.
>>> object = False
>>> if not object:
...     print('Check valid')
...
Check valid
>>> object = None
>>> if not object:
...     print('Check valid')
...
Check valid
Instead, only checking against the identity comparison will allow you to detect only the value of None properly.
>>> object = False
>>> if object is None:
...     print('object is None')
...
>>> object = None
>>> if object is None:
...     print('object is None')
...
object is None
The same can be used for Boolean values.
>>> bool('Testing') is True
True
For other cases, there's the isinstance function, which can be used to find if a particular object is an instance of a particular class:
>>> class A:
...     pass
...
>>> a = A()
>>> isinstance(a, A)
True
This is better than making comparisons with type, because it is aware of any inheritance that may have been produced. For example, in the following code we see how an object from a class that inherits from another will return that it's an instance of either, while the type function will only return one.
>>> class A:
...     pass
...
>>> class B(A):
...     pass
...
>>> b = B()
>>> isinstance(b, B)
True
>>> isinstance(b, A)
True
>>> type(b)
<class '__main__.B'>
The most useful function for introspection, though, is dir. dir allows you to see all the methods and attributes in an object, and it's particularly useful when analyzing objects from a not-clear origin, or where the interface is not clear.
>>> d = {}
>>> dir(d)
['__class__', '__class_getitem__', '__contains__', '__delattr__', '__delitem__', '__dir__', '__doc__', '__eq__', '__format__', '__ge__', '__getattribute__', '__getitem__', '__gt__', '__hash__', '__init__', '__init_subclass__', '__ior__', '__iter__', '__le__', '__len__', '__lt__', '__ne__', '__new__', '__or__', '__reduce__', '__reduce_ex__', '__repr__', '__reversed__', '__ror__', '__setattr__', '__setitem__', '__sizeof__', '__str__', '__subclasshook__', 'clear', 'copy', 'fromkeys', 'get', 'items', 'keys', 'pop', 'popitem', 'setdefault', 'update', 'values']
Obtaining the whole attributes can be a bit too much in certain situations, so the returned values can filter out the double-underscore ones to reduce the amount of noise and be able to detect attributes that can give some clue about the object usage more easily.
>>> [attr for attr in dir(d) if not attr.startswith('__')]
['clear', 'copy', 'fromkeys', 'get', 'items', 'keys', 'pop', 'popitem', 'setdefault', 'update', 'values']
Another interesting function is help, which displays the help from objects. This is particularly helpful for methods:
>>> help(d.pop)
Help on built-in function pop:
pop(...) method of builtins.dict instance
    D.pop(k[,d]) -> v, remove specified key and return the corresponding value.
    If key is not found, default is returned if given, otherwise KeyError is raised
This function displays the defined docstring from the object.
>>> class C:
...     '''
...     This is an example docstring
...     '''
...     pass
...
>>> c = C()
>>> help(c)
Help on C in module __main__ object:
class C(builtins.object)
 |  This is an example docstring
 |
 |  Data descriptors defined here:
 |
 |  __dict__
 |      dictionary for instance variables (if defined)
 |
 |  __weakref__
 |      list of weak references to the object (if defined)
All these methods can help you navigate code that's new or under analysis without being an expert, and avoid many checks with code that can be hard to search through.
Adding sensible docstrings is a great help not only for keeping the code well commented and adding context for developers working in the code, but also in case of debugging in parts where the function or object is used. You can learn more about docstrings in the PEP 257 document: https://www.python.org/dev/peps/pep-0257/.
Using these tools is good, but let's see how we can understand the behavior of the code.
Debugging with logs
A simple yet effective way of detecting what's going on and how the code is being executed is adding comments that are displayed either containing statements like starting the loop here or including values of variables like Value of A = X. By strategically locating these kinds of outputs, the developer can understand the flow of the program.
We touched on this earlier in this chapter as well as in Chapter 10, Testing and TDD.
The simplest form of this approach is print debugging. It consists of adding print statements to be able to watch the output from them, normally while executing the code locally in a test or similar.
Print debugging can be considered a bit controversial to some people. It has been around for a long time, and it's considered a crude way of debugging. In any case, it can be very quick and flexible and can fit some debug cases very well, as we will see.
Obviously, these print statements need to be removed after the process has been finished. One of the main complaints about this technique is precisely this, that there's a chance that some print statements intended for debugging are not removed, and it's a common mistake.
This can be refined, though, by instead of directly using print statements, using logs instead, as we introduced in Chapter 12, Logging.
Ideally, these logs will be DEBUG logs, which will only be displayed when running tests, but won't be produced in a production environment.
While logs can be added and not produced later, it's good practice anyway to remove any spurious logs after fixing the bug. Logs can accumulate and there will be an excessive amount of them unless they are periodically taken care of. It can be difficult to find information in a big wall of text.
The advantage of this method is that it can be done quickly and it can also be used to explore logs that can then be promoted to permanent ones, once adapted.
Another important advantage is that tests can be run very quickly, as adding more logs is a simple operation, and logs won't interfere with the execution of code. This makes it a good combination to use with TDD practices.
The fact that the logs won't interfere with the code and code can be running unaffected can make some difficult bugs based on concurrency easier to debug, as interrupting the flow of the operation in those cases will affect the behavior of the bug.
Concurrent bugs can be quite complicated. They are produced when two independent threads interact in an unexpected way. Because of the uncertain nature of what one thread will start and stop or when an action from one thread will affect the other, they normally require extensive logs to try to capture the specifics of that problem.
While debugging through logs can be quite convenient, it requires certain knowledge of where and what logs to set to obtain the relevant information. Anything not logged won't be visible in the next run. This knowledge can come through a discovery process and take time to pinpoint the relevant information that will lead to fixing the bug.
Another problem is that new logs are new code, and they can create problems if there are errors introduced like bad assumptions or typos. This will normally be easy to fix, but can be an annoyance and require a new run.
Remember that all introspection tools that we talked about before in the chapter are available.
Debugging with breakpoints
In other situations, it's better to stop the execution of the code and take a look at the current status. Given that Python is a dynamic language, it means that, if we stop the execution of the script and enter the interpreter, we can run any kind of code and see its results.
This is exactly what is done through the usage of the breakpoint function.
breakpoint is a relatively new addition to Python, available since Python 3.7. Previously, it was necessary to import the module pdb, typically in this way in a single line:
import pdb; pdb.set_trace()
Other than the ease of usage, breakpoint has some other advantages that we will see.
When the interpreter finds a breakpoint call, it stops and opens an interactive interpreter. From this interactive interpreter, the current status of the code can be examined and any investigation can take place, simply executing the code. This makes it possible to understand interactively what the code is doing.
Let's take a look at some code and analyze how it runs. The code can be found on GitHub at https://github.com/PacktPublishing/Python-Architecture-Patterns/blob/main/chapter_15_debug/debug.py and it's the following:
def valid(candidate):
    if candidate <= 1:
        return False
    lower = candidate - 1
    while lower > 1:
        if candidate / lower == candidate // lower:
            return False
    return True
assert not valid(1)
assert valid(3)
assert not valid(15)
assert not valid(18)
assert not valid(50)
assert valid(53)
Perhaps you are able to understand what the code does, but let's take a look at it interactively. You can check first that all the assert statements at the end are correct.
$ python3 debug.py
But we now introduce a breakpoint call before line 9, right at the start of the while loop.
    while lower > 1:
        breakpoint()
        if candidate / lower == candidate // lower:
            return False
Execute the program again and it now stops at that line and presents an interactive prompt:
$ python3 debug.py
> ./debug.py(10)valid()
-> if candidate / lower == candidate // lower:
(Pdb)
Check the value of candidate and both operations.
(Pdb) candidate
3
(Pdb) candidate / lower
1.5
(Pdb) candidate // lower
1
This line is checking whether dividing candidate by lower produces an exact integer, as in that case both operations will return the same. Execute the next line by hitting n, from the command n(ext), and check that the loop ends and it returns True:
(Pdb) n
> ./debug.py(13)valid()
-> lower -= 1
(Pdb) n
> ./debug.py(8)valid()
-> while lower > 1:
(Pdb) n
> ./debug.py(15)valid()
-> return True
(Pdb) n
--Return--
> ./debug.py(15)valid()->True
-> return True
Continue the execution until a new breakpoint is found using the command c, from c(ontinue). Note this happens on the next call to valid, which has an input of 15.
(Pdb) c
> ./debug.py(10)valid()
-> if candidate / lower == candidate // lower:
(Pdb) candidate
15
You can also use the command l(ist) to display the surrounding code.
(Pdb) l
  5
  6  	    lower = candidate - 1
  7
  8  	    while lower > 1:
  9  	        breakpoint()
 10  ->	        if candidate / lower == candidate // lower:
 11  	            return False
 12
 13  	        lower -= 1
 14
 15  	    return True
Continue freely investigating the code. When you are finished, run q(uit) to exit.
(Pdb) q
bdb.BdbQuit
After analyzing the code carefully, you probably know what it does. It checks whether a number is prime or not by checking if it's divisible by any number lower than the number itself.
We investigated similar code and improvements in Chapter 14, Profiling. This is, needless to say, not the most efficient way of setting code to check this, but it has been added as an example and for teaching purposes.
Another two useful debug commands are s(tep), to get into a function call, and r(eturn), to execute the code until the current function returns its execution.
breakpoint can also be customized to call other debuggers, not only pdb. There are other debuggers for Python that include more contextual information or with more advanced usages, like ipdb (https://pypi.org/project/ipdb/). To use them, you need to set the PYTHONBREAKPOINT environment variable with the endpoint for the debugger, after installing the debugger.
$ pip3 install ipdb
…
$ PYTHONBREAKPOINT=IPython.core.debugger.set_trace python3 debug.py
> ./debug.py(10)valid()
      8     while lower > 1:
      9         breakpoint()
---> 10         if candidate / lower == candidate // lower:
     11             return False
     12
ipdb>
This environment variable can be set to 0 to skip any breakpoint, effectively deactivating the debug process: PYTHONBREAKPOINT=0. This can be used as a failsafe to avoid being interrupted by breakpoint statements that haven't been properly removed, or to quickly run the code without interruptions.
There are multiple debuggers that can be used, including support from IDEs like Visual Studio or PyCharm. Here are examples of two other debuggers:
pudb(https://github.com/inducer/pudb): Has a console-based graphical interface and more context around the code and variablesremote-pdb(https://github.com/ionelmc/python-remote-pdb): Allows you to debug remotely, connecting to a TCP socket. This allows you to debug a program running in a different machine or trigger the debugger in a situation where there's no good access to thestdoutof the process, for example, because it's running in the background
Using a debugger properly is a skill that requires time to learn. Be sure to try different options and get comfortable with them. Debugging will also be used while running tests, as we described in Chapter 10, Testing and TDD.
Summary
In this chapter, we described the general process of detecting and fixing problems. When working in complex systems, there's the challenge of properly detecting and categorizing the different reports to be sure that they are prioritized. It's very important to be able to reliably reproduce the problem in order to show all the conditions and context that are producing the issue.
Once a problem is deemed important, there needs to be an investigation into why this problem is happening. This can be on the running code, and use the available tools in production to see if it can be understood why the problem occurs. The objective of this investigation is to be able to replicate the problem locally.
Most issues will be easy to reproduce locally and move forward, but we also described some tools in case it remains a mystery why the issue is being produced. As the main tool to understand the behavior of the code in production is logs, we talked about creating a request ID that can help us to trace the different calls and relate logs from different systems. We also described how the data in the environment may have the key to why the problem is occurring there. If it is necessary, the number of logs may need to be increased to extract information from production, though this should be reserved for very elusive bugs.
We then moved on to how to debug locally, after replicating the problem, ideally, as we saw in Chapter 10, Testing and TDD, in the form of a unit test. We gave some general ideas to help with debugging, though it must be said that debugging is a skill that needs to be practiced.
Debugging can be learned and improved, so it's an area where more experienced developers can help their junior counterparts. Be sure to create a team where it is encouraged to help with debugging when required in difficult cases. Two pairs of eyes see more than one!
We introduced some of the tools that help with debugging in Python, which make use of the possibilities that Python presents for introspection. As Python is a dynamic language, there are a lot of possibilities, as it's able to execute any code, including all the introspection capabilities.
We then talked about how to create logs to debug, which is an improved version of using print statements, and, when done in a systematic way, can help to create better logs in the long run. Finally, we moved on to debugging using the breakpoint function call, which stops the execution of the program and allows you to inspect and understand the status at that point, as well as continuing with the flow.
In the next chapter, we will talk about the challenges of working in the architecture of a system when it's running and needs to be evolved.
Join our book’s Discord space
Join the book’s Discord workspace for a monthly Ask me Anything session with the authors:
https://packt.link/PythonArchitechture
