
Organizations that try to improve their development speed by moving toward efficient development follow a predictable pattern. If you take 100 typical projects, you'd find that their chances of coming in on time would look like Figure 6-11.
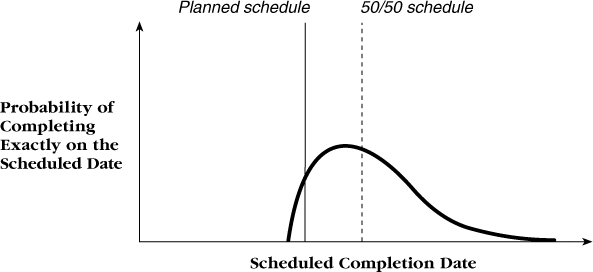
Figure 6-11. Typical-development schedule curve. Typical projects make schedule plans that they have almost no chance of meeting.
Among typical projects, the spread of project performance is wide, and many of the projects have severe overruns. Look at how much of the curve in Figure 6-10 is to the right of the planned-schedule line on typical projects. Few typical projects come anywhere close to meeting their cost or schedule goals.
As Figure 6-12 shows, among efficient-development projects, the schedule spread is narrower, with most projects coming in close to their cost and schedule targets. About half the projects finish earlier than the target date, and about half finish later. The planned schedules are longer than they are in typical development, but the actual schedules are shorter. This is partly a result of learning how to set targets more realistically and partly a result of learning how to develop software faster. The move from wishful thinking to meaningful project planning is a big part of what it takes to move from typical development to efficient development.

For a similar discussion, see "Capability Maturity Model for Software, Version 1.1" (Paulk et al. 1993).
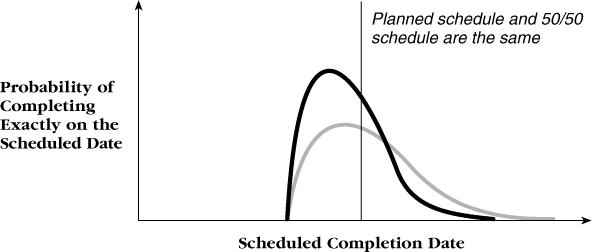
Figure 6-12. Efficient-development schedule curve. Planned schedules in efficient projects are longer than planned schedules in typical projects, but actual schedules are shorter.
Once you've achieved efficient development, the improvement pattern depends on whether you want to improve raw development speed or schedule predictability or both. Ideally, you could employ practices that would give you the tall, skinny curve shown in Figure 6-13.
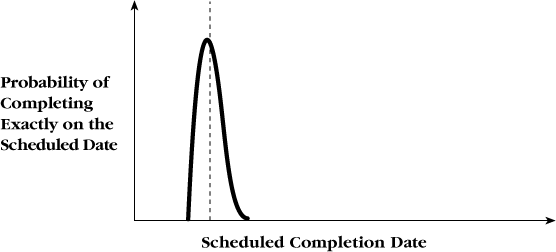
Figure 6-13. Ideal rapid-development schedule curve. If every single thing goes as planned, the result is great speed and predictability.
Unfortunately for all of us, the ideal curve in Figure 6-13 is as elusive in software development as it is in fad dieting. As shown in Figure 6-14, that means that most rapid-development practices are tilted either toward increasing development speed or reducing schedule risk, but not both.
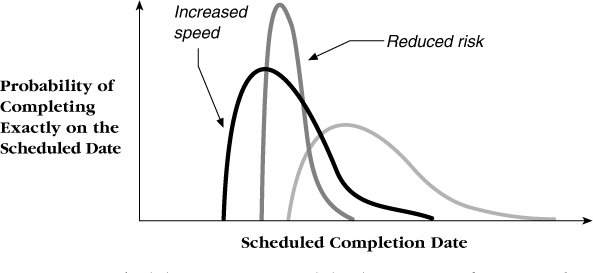
Figure 6-14. Scheduling options. Rapid development can focus on either increasing development speed or reducing schedule-related risks.
When you choose rapid-development practices, you need to decide whether you would rather improve the chance of delivering a product earlier or reduce the risk that the product will slip past a certain date. The rest of the book describes such practices.