
Once you've developed an effective tool-acquisition strategy, a few issues still remain in the area of tool use. How you match tools to projects can have a major impact on your rapid-development capability.
On a software project, there is a trade-off between the learning curve you climb in becoming familiar with a new tool and the productivity you gain once you become familiar. The first time you use a new tool, it often takes more time than if you hadn't used the tool at all. You incur overhead for training, experimentation, learning about the tool's weak spots (as in my Windows metafile project), and arguing among team members about how to use the tool to maximum advantage.
As Figure 15-2 suggests, if you expect your project to take as long as Project B, you can expect to recoup your learning-curve investment. But if you expect your project to finish sooner, as Project A does, you would be better off not adopting that tool, at least from the point of view of that project.
At an organizational level, the considerations are a little different. If you always have short projects like Project A and learning curves for new tools like the one shown in Figure 15-2, you'll never be able to justify introducing a new tool on a single project. But to maintain the long-term development capability of your organization, to continue raising your productivity level, you sometimes have to adopt a new tool on a project even though it's a suboptimal solution for that particular project.
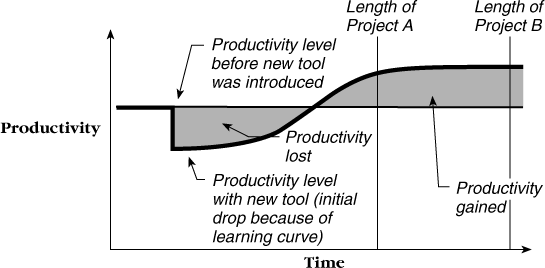
Figure 15-2. Learning curve's effect on productivity. Introducing a new tool on a short project, such as Project A, doesn't allow you to recoup the productivity you lose to the learning curve.
You can draw two conclusions from this for rapid development. First, long-term, you need to keep introducing new and more effective tools to improve productivity. You can't make those decisions purely on the basis of what's best for individual projects. Second, short-term, a rapid-development project is usually not the right project on which to introduce a new tool. The time you're in a hurry is the worst time to take a new shortcut. Choose a less time-sensitive project, and soak up the learning curve on that project.
The more powerful a tool is, the more difficult it can be to use effectively. Without adequate training, tools that could provide significant productivity benefits often sit on shelves unused. Wayne Beardsley puts it this way:

Think of our software company as a construction company. Our task is to dig a ditch from the street to a farmhouse five miles away. We've purchased the latest backhoe systems for the work crew. On a typical day, the crew members drive the backhoe from the street to the end of the ditch, hop off, and use the shovels that came with the backhoe to dig another few feet. At the end of the day, they hop back onto the backhoe and drive it back to the street. Maybe we should explain that the backhoe wasn't purchased for commuting. (Beardsley 1995)
This analogy fits altogether too closely to many software projects.
No practice is implemented in a vacuum, and the environment in which the practice is used plays a large role in determining whether it succeeds (Basili and McGarry 1995). Vendor productivity claims are usually claims for the maximum potential of a practice in an ideal environment; you'll have to try it to determine how well it works in your environment.
To estimate how much schedule reduction to expect from a productivity tool, think in terms of the entire lifecycle you plan to use, and then determine how much effort you expect to save during each part of the lifecycle.
Suppose you plan to use a fourth-generation language (4GL) such as Focus, Visual Basic, or Delphi for 50 percent of your system within a classical, waterfall lifecycle. Suppose further that you expect the project to consist of about 32,000 lines of code if it were implemented completely in a third-generation language (3GL) such as C, Basic, or Pascal. Table 15-1 shows approximately how that kind of project would break down by activity.
CROSS-REFERENCE
For details on the waterfall lifecycle model, see Pure Waterfall, Pure Waterfall.
Switching to a 4GL is one of the more powerful ways to employ productivity tools in your behalf. Estimates vary, but in moving from a 3GL to a 4GL, you can typically expect to reduce your coding effort by 75 percent or so (Jones 1995). You can expect to reduce your design effort by about the same amount (Klepper and Bock 1995).

That 75-percent savings in design and coding unfortunately doesn't translate into a 75-percent savings in schedule. In the example, only 50 percent of the program is implemented in a 4GL, so the 75-percent savings applies only to that 50 percent. Moreover, the savings does not apply to the activities of architecture, unit test, or system test, and it applies only partially to integration. When all is said and done, you come out with about a 20-percent reduction in effort as a result of using a 4GL for 50 percent of your program.
Unfortunately, we're still not quite done whittling down the savings. A woman might be able to have twins in 9 months, but that doesn't mean she could have had one baby in 4½months. Effort savings don't translate straight across the board to schedule savings. That 20-percent savings in effort translates to only an 8-percent savings in schedule.
CROSS-REFERENCE
For details on the relationship between effort and schedule, see Schedule Estimation, Schedule Estimation.
Now here's the really bad news. This example didn't even include the time needed for requirements specification or learning curve. If you included that, the savings as a percentage of the end-to-end project time would be even smaller. Ugh!
CROSS-REFERENCE
The effort estimates in this table are derived from data in Table 8-10, Table 8-10. The schedule estimates are calculated using Equation 8-1 described in Schedule Estimation.
Table 15-1. Example of Savings Realized by Switching from a 3GL to a 4GL for 50 Percent of a 32,000 LOC Project
Activity | Nominal Effort (man-months) | Expected Savings by Activity | Final Effort (man-months) | Explanation |
|---|---|---|---|---|
Architecture (high-level design) | 6 | 0% | 6 | Same amount of architecture required. Any savings would be offset by the need to architect the combination of 3GL and 4GL languages. |
Detailed design | 8 | 38% | 5 | 75% reduction for the 50% of the program coded in a 4GL. |
Code/debug | 8 | 38% | 5 | 75% reduction for the 50% of the program coded in a 4GL. |
Unit test | 6 | 0% | 6 | Same unit tests required for same functionality. |
Integration | 6 | 30% | 4 | 75% reduction for the part coded in 4GL, but extra integration required to mix 3GL and 4GL partially offsets the savings. |
System test | 6 | 0% | 6 | Same system tests required for same functionality. |
Total Effort (man-months) | 40 | 20% | 32 | |
Schedule Savings | ||||
Expected schedule (calendar months) | 10.3 | 8% | 9.5 | |
Here's a somewhat more encouraging example. This time, suppose that you're working on the same application as the last example, but that you can implement it completely in a 4GL. Table 15-2 on the next page illustrates the savings you can expect in this case.
CROSS-REFERENCE
The effort estimates in this table are derived from data in Table 8-10, Table 8-10. The schedule estimates are calculated using Equation 8-1 described in Schedule Estimation.
Table 15-2. Example of Savings Realized by Switching from a 3GL to a 4GL for 100 Percent of a 32,000 LOC Project
Activity | Nominal Effort (man-months) | Expected Savings by Activity | Final Effort (man-months) | Explanation |
|---|---|---|---|---|
Architecture (high-level design) | 6 | 80% | 1 | Program is so much smaller that little architecture is needed. |
Detailed design | 8 | 75% | 2 | 75% reduction due to switch from 3GL to 4GL. |
Code/debug | 8 | 75% | 2 | 75% reduction due to switch from 3GL to 4GL. |
Unit test | 6 | 0% | 6 | Same unit tests required for same functionality. |
Integration | 6 | 75% | 1 | 75% reduction due to switch from 3GL to 4GL. |
System test | 6 | 0% | 6 | Same system tests required for same functionality. |
Total Effort (man-months) | 40 | 55% | 18 | |
Schedule Savings Expected schedule (calendar months) | 10.3 | 23% | 7.9 |
Here, the payoff in effort is terrific—55-percent savings overall. But the payoff in schedule is still a relatively modest 23 percent, and that assumes that there's no learning-curve effect associated with switching to the 4GL. The switch from a 3GL to a 4GL is one of the most powerful productivity improvements you can make, but even when you can implement a program entirely in a 4GL, you cut the schedule by only about 25 percent.
You might disagree with the specific percentage savings I've estimated in these tables, but don't let that obscure the messages of these examples: it is extremely difficult for any productivity tool to deliver as much as a 25-percent reduction in schedule, and you can simply dismiss more ambitious claims. Most tools' real savings will be more in line with the first example, delivering schedule savings of 10 percent or less. A few leading-edge companies have sustained productivity improvements of 15 to 25 percent per year for several years by using combinations of tools, and that seems to be the upper limit (Jones 1994).