CHAPTER 10
1-Wire Weather Station
Introduction
As the chapter’s name implies, I will be showing you how to build a weather station. This station will be quite basic, measuring only temperature, pressure, and humidity, but it may be easily expanded to measure other weather components, such as wind speed and rainfall. All the weather sensors are connected to the RasPi with a very clever interface known as 1-Wire™, which makes it very easy to add additional components.
The RasPi runs on a software package named owfs, short for 1-Wire File System. This open-source software contains every function required to interface the RasPi with all the system components used in this project.
Weather Station Design
Figure 10–1 is a system block diagram that shows the components or modules involved in this project.

Figure 10–1 Weather station block diagram.
The system is a point-to-point interconnection, starting with the USB to 1-Wire adapter that is plugged into a port on a powered USB hub, which, in turn, is connected to one of the RasPi USB ports. I didn’t show the hub on the diagram because it should be considered as part of the basic RasPi configuration.
All the modules and the USB adapter are available in the United States from www.hobby-boards.com. Similar modules are available from www.sheepwalkelectronics.co.uk for international readers. These items are listed in Table 10–1.
Table 10–1 Listing of Weather Station Modules and Adapters

The first element shown connected to the RasPi in the system diagram is an adapter in the physical form of a USB dongle, as shown in Fig. 10–2. It has a USB connector at one end and a 1-Wire connector at the opposite side.
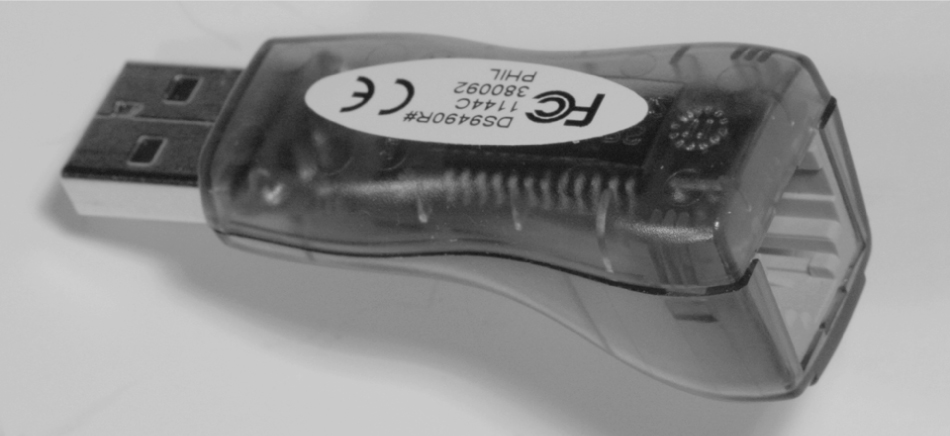
Figure 10–2 USB to 1-Wire dongle.
The 1-Wire socket shown in the figure is a standard RJ12, six-pin, telephone-style connector. A special RJ12 to RJ45 cable is required to go from the dongle to the first 1-Wire module, which in this case, is the Power Injector Module. This special cable is shown in Fig. 10–3 and is typically provided when you purchase the 1-Wire-to-USB dongle.

Figure 10–3 RJ12 to RJ45 cable.
Most 1-Wire modules use the standard eight-pin RJ45 connection standard, which is exactly the same as a regular Ethernet patch cable. In fact, I used normal Ethernet patch cables to interconnect all the 1-Wire modules for this project.
CAUTION Be sure that you do not inadvertently use an Ethernet crossover cable because that will break the 1-Wire connection scheme. It will not harm the modules, but the data connection will not work.
The next element shown in the system diagram is the Power Injector Module, which is shown in Fig. 10–4.

Figure 10–4 Power Injector Module.
A 15-V “wall wart” power supply (a box-shaped device that plugs into the AC electrical wall outlet and provides DC power to various electronic devices) plugs into a socket mounted on the case top. There are also two RJ45 connectors mounted on the sides of the case that are not visible. The cable from the USB dongle connects to the left socket, while the patch cord that goes to the next module connects to the right socket. The 15 V are sent out through the Ethernet cable and are also down regulated to 5 V for local use by a 78M05 regulator mounted on the internal PCB that is shown in Fig. 10–5.

Figure 10–5 Power Injector PCB.
It turns out that some 1-Wire modules do not require a separate power supply. This is discussed in the section describing various ways to power a 1-Wire network. In this weather station project, the barometer, humidity, and packet sniffer modules do require the use of a power injector because their power consumption exceeds the 1-Wire standards for parasitic power supply operation, which will be discussed shortly.
The weather modules following the Power Injector Module do not have to be inserted in any particular order. I will show you the Temperature Module next. Figure 10–6 shows the external case.
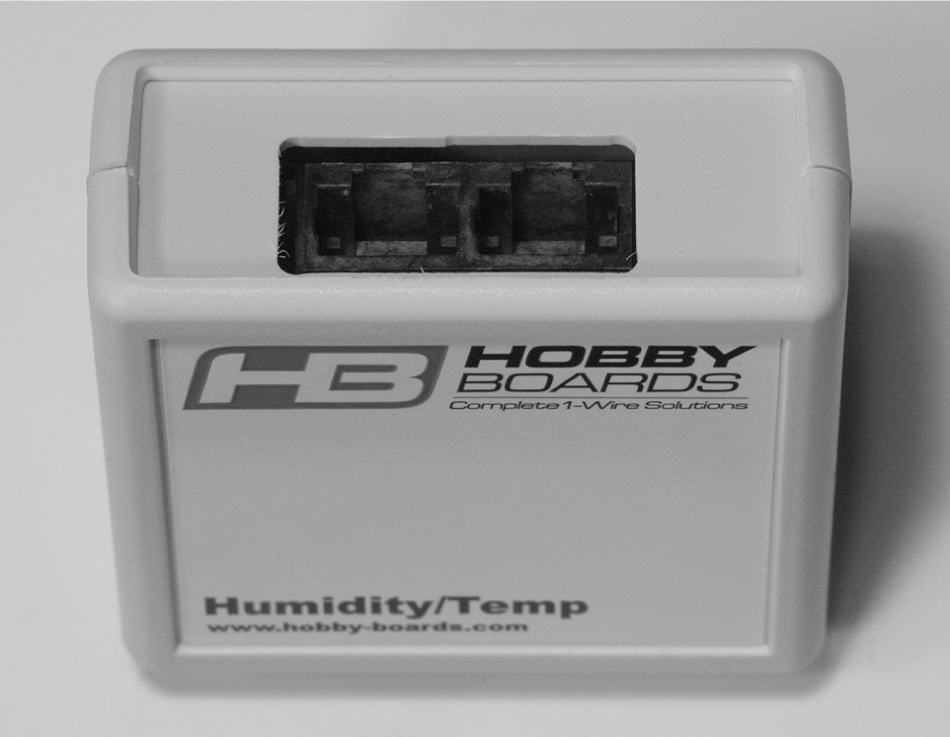
Figure 10–6 Temperature Module case.
The external case is the same size as the Power Injector Module except that there are two RJ45 sockets at the top but no separate power socket. The RJ45 sockets are wired in parallel, so there are no specific “in” or “out” connections to worry about. The bottom case panel has six holes in it to allow for airflow so that the sensor can measure the ambient air temperature, not just the air contained in the case.
Figure 10–7 shows the PCB inside the Temperature Module.

Figure 10–7 Temperature Module PCB.
The temperature sensor, marked U1, may be clearly seen mounted near the top centerline of the board. It appears as if it is an ordinary TO92, a three-lead, plastic-encased transistor, but it is remarkably far more than that. It actually houses a microprocessor with a temperature-sensing element, which is only made possible due to the nature of the 1-Wire protocol. U1 is a Maxim DS18B20 chip, which will be further described later. You should also notice that a three-terminal strip, located at the midpoint of the right side, allows for a separate power supply to be attached and for the module’s digital output to be accessed via the terminal marked DQ. We do not use this terminal strip, as all modules are interconnected via the RJ45 cables. It just allows for additional flexibility.
The Humidity Module will be described next. I am not showing an external case picture because it is identical to that of the Temperature Module except for the Humidity designation on the case front. The internal PCB, however, is considerably different, as you may see from Fig. 10–8.
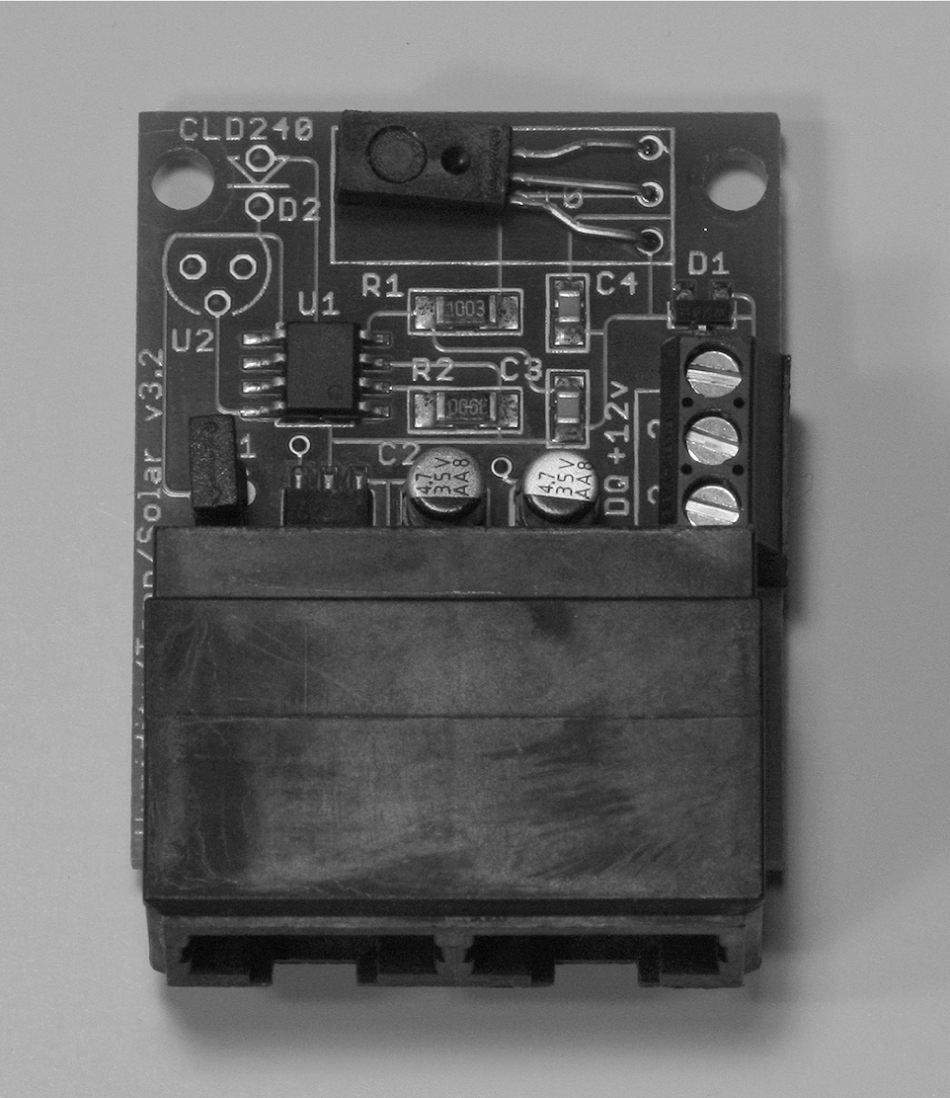
Figure 10–8 Humidity Module PCB.
The humidity sensor, designated as U3 (not visible in Fig. 10–8), is located at the top of the board. It is a Honeywell model HIH-4021-001 sensor that produces an analog output based on the humidity it senses in the ambient air. These analog sensor readings are sent to chip U1, which is a Maxim DS2438A. This chip is also incorporated into the Barometer Module and will be discussed in a following section. The external terminal connection strip is also present and can be seen on the right-hand side of the board. This strip is not used here, as I mentioned in the Temperature Module discussion.
The Barometer Module is the last sensor to be discussed. Again, no external case picture is needed, but the PCB board is shown in Fig. 10–9.

Figure 10–9 Barometer Module PCB.
The pressure sensor, designated as U2, is located on the left side at the top of the board. It is a Freescale Semiconductor model MPXA4115A sensor, which produces an analog output based on the ambient air pressure within the range of 28 to 32 inches of mercury. These readings are sent to chip U1, a Maxim DS2438A, the same chip that was used in the Humidity Module. The U1 chip is not visible in this figure because it is surface mounted to the backside of the board. The twice-mentioned terminal board is also visible. A potentiometer is located on the upper right side to precisely calibrate the module to a known air pressure.
I will discuss the Packet Sniffer Module in a later section. Next, I will discuss the 1-Wire protocol, which is the base technology for this project.
1-Wire Protocol
The 1-Wire protocol is the registered trademark name given to a digital serial communications protocol by Dallas Semiconductor, the company that first introduced it in the early 1990s. However, the trademark does not affect any software implementing the protocol. Dallas Semiconductor was merged with Maxim years later but still manufactures 1-Wire products along with many other components. This is the reason why 1-Wire products have a DS prefix.
1-Wire uses a master/slave, multi-drop architecture with an open-drain connection with pull-ups to 5 V. This means that devices may be added or removed without any change to the hardware configuration being specified. All devices are discovered through software techniques. Also all 1-Wire devices have a unique 64-bit identification number that is encoded in a ROM by the manufacturer.
The master and all slaves act as transceivers meaning that they can both transmit and receive, but not at the same time. This mode of operation is known as half-duplex with data transmission being unidirectional. The master initiates all communication on the bus with the slaves responding only to commands sent by the master. All data is sent by serial bits in a specific timed sequence. Bit timing is asynchronous with no external clock required, since all timing is based on the signal transitions from the master.
All communication flow between the master and slaves involves three activities, as shown in Fig. 10–10.

Figure 10–10 1-Wire communication flow.
1. Reset—In the first phase, the bus master must issue a reset command that synchronizes all elements on the 1-Wire bus. All slaves must respond to the reset, or the bus will not function as desired.
2. Detect and Select—A specific slave device is next selected to receive commands from the master in the next phase. This selection is a multipart process that is started by using a binary search algorithm to discover all the slaves currently connected on the bus. Remember, all 1-Wire devices have a unique serial ID permanently programmed into their onboard ROM. The search algorithm reads and records all the IDs and records these values in a dynamic table that is hosted in the master. The master can then use a specific ID to send commands to a slave with that ID, while all other slaves ignore the command.
3. Receive and Perform Command—In the last phase, the master and selected slave engage in half-duplex communication in which the master issues commands and the slave responds as designed.
Maxim DS2438A Chip
The Maxim DS2438A chip is used in both the Barometer and Humidity Modules. It deserves a separate discussion because it serves as a specialized controller between a module sensor and the 1-Wire bus. This chip is formally designated as a Smart Battery Monitor; however, it is used in another role for the aforementioned modules. Figure 10–11 is a block diagram illustrating the many functions implemented by this small chip, which is only an eight-lead small-outline integrated circuit (SOIC).

Figure 10–11 DS2438A block diagram.
The chip contains an analog-to-digital converter (ADC) that converts the sensor’s analog signals into equivalent digital signals that can be passed over the 1-Wire network.
The module’s unique 64-bit ID is also stored in a ROM contained in this chip. The ROM contains all the programming code needed to respond to the master’s reset command as well as to the other commands unique to the module.
The parasitic capacitor and blocking diode discussed below are also shown in Fig. 10–11.
Maxim DS18B20 Chip
This chip is called a Programmable Resolution 1-Wire Digital Thermometer by the manufacturer. Some key specifications are listed below:
![]() Configurable from 9 to 12 bits
Configurable from 9 to 12 bits
![]() Measures –55° to +125°C
Measures –55° to +125°C
![]() Measures –10° to +85°C with a +/– 0.5°C accuracy
Measures –10° to +85°C with a +/– 0.5°C accuracy
![]() Has its own 64 bit ID
Has its own 64 bit ID
![]() Powered from 3 to 5.5 V (may be parasitically powered)
Powered from 3 to 5.5 V (may be parasitically powered)
![]() Converts 12 bits within 750 ms
Converts 12 bits within 750 ms
Figure 10–12 shows the DS18B20 block diagram. There is an awful lot crammed into a TO92 case.
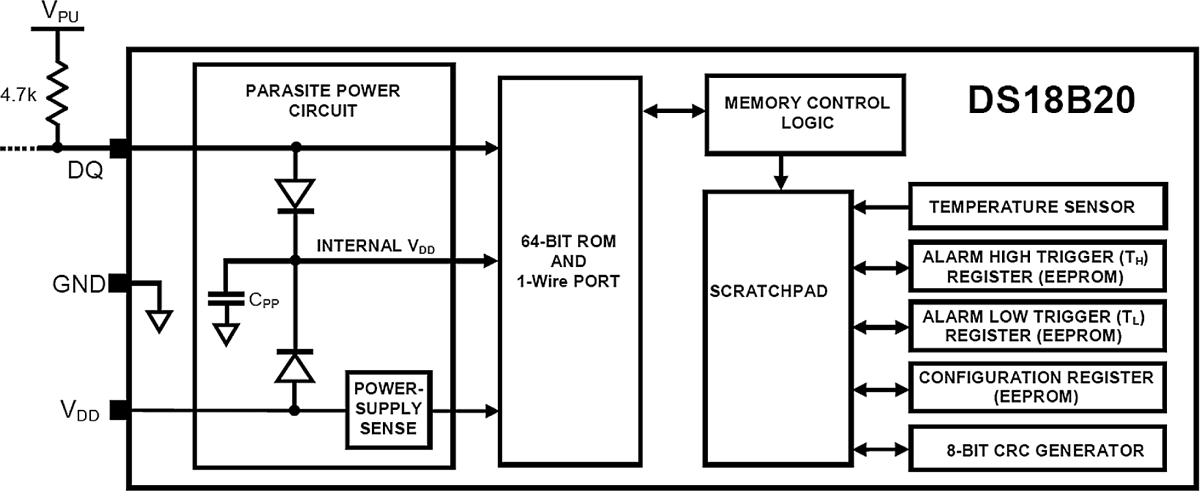
Figure 10–12 DS18B20 block diagram.
Powering the 1-Wire Bus
There are three ways that the 1-Wire bus can be powered. These are:
1. External power supply
2. Parasitic supply using a capacitor and diode
3. Powering the data line using a strong pull-up metal–oxide–semiconductor field-effect transistor (MOSFET)
The first way, using an external supply, is the one we used in this project by incorporating the Power Injector Module. You were also shown how to connect a local power supply to a specific module using a terminal board located on the PCB. It should be noted that the Power Injector Module is wired to provide power to all bus devices, while a local power supply powers only the device to which it is wired.
The second way is called parasitic because the module power is obtained by charging a capacitor from the 1-Wire data line while it is idling at a 5-V level. Figure 10–13 shows the simple charging circuit.

Figure 10–13 Capacitor-based parasitic power supply.
The blocking diode shown in the figure prevents the charged capacitor from interfering with the voltage levels on the data line. There are two disadvantages to using this scheme:
1. The increased capacitive load on the bus data line decreases the effective physical length of the bus line.
2. The capacitor charge can supply only a very small current before being discharged.
The third way, using an active device such as a MOSFET, allows for power to be supplied to the data line during idle time. It essentially improves the parasitic power supply performance because the master controls the MOSFET to provide a strong pull up during idle time. This circuit is shown in Fig. 10–14.

Figure 10–14 Active pull-up power supply.
The active pull up provides for extended range and a much better current supply at the expense of requiring a dedicated microprocessor GPIO pin as well as additional programming for that GPIO pin.
1-Wire Sniffer
The 1-Wire Sniffer is a diagnostic module that connects to the 1-Wire network and provides a real-time view of the data flow. It has an RS-232 serial port that may be seen at the top of the PCB, as shown in Fig. 10–15.

Figure 10–15 1-Wire Sniffer PCB.
The RS-232 serial connection can be attached to any computer running a terminal control program with a configuration of 8 data bits, 1 stop bit, no parity, and 115,200 baud. The particular sniffer board used in this project is powered via the bus. I used an external laptop running the Tera Term program to display the network data. The RasPi could have been used; however, it was simpler and easier just to use another computer for the monitoring and diagnostic functions. You will see some sample screenshots in the section describing the operating weather station.
The sniffer module is an exception to the unique ID protocol because it is not expected to operate as a normal slave device. All of the sniffers made by this manufacturer have the same ID of 0x01, which means that only one can be deployed into a given 1-Wire network. That’s usually not an issue because you would never require more than one sniffer per network. The master can issue a limited number of commands to this sniffer, including:
![]() F—Puts Sniffer into firmware upgrade mode
F—Puts Sniffer into firmware upgrade mode
![]() S—Puts Sniffer into the sniffer mode
S—Puts Sniffer into the sniffer mode
![]() P—Pauses the Sniffer
P—Pauses the Sniffer
![]() H—Display help message
H—Display help message
Set Up the Weather Station Hardware
The weather station modules should now be interconnected using Ethernet patch cables, and the USB dongle should be plugged into a powered USB hub. Plug the cable from the USB dongle into the Power Injector Module. All the other modules are daisy-chained from the Power Injector Module. The 15 V wall wart power supply must also be plugged into the Power Injector Module. Figure 10–16 shows the whole setup.

Figure 10–16 The 1-Wire weather station.
1-Wire File System
The software package that drives the whole 1-Wire network is named owfs, as mentioned in the introduction. It is an open-source, comprehensive
set of applications that works seamlessly with the RasPi Wheezy distribution. The following are the instructions on how to set up the RasPi to run owfs:
1. Update and upgrade the Wheezy distribution:

(this might take some time).
2. Next download and install owfs:

3. Next, edit the owfs configuration file.

There are two changes to make. Refer to Fig. 10–17 to see these changes.
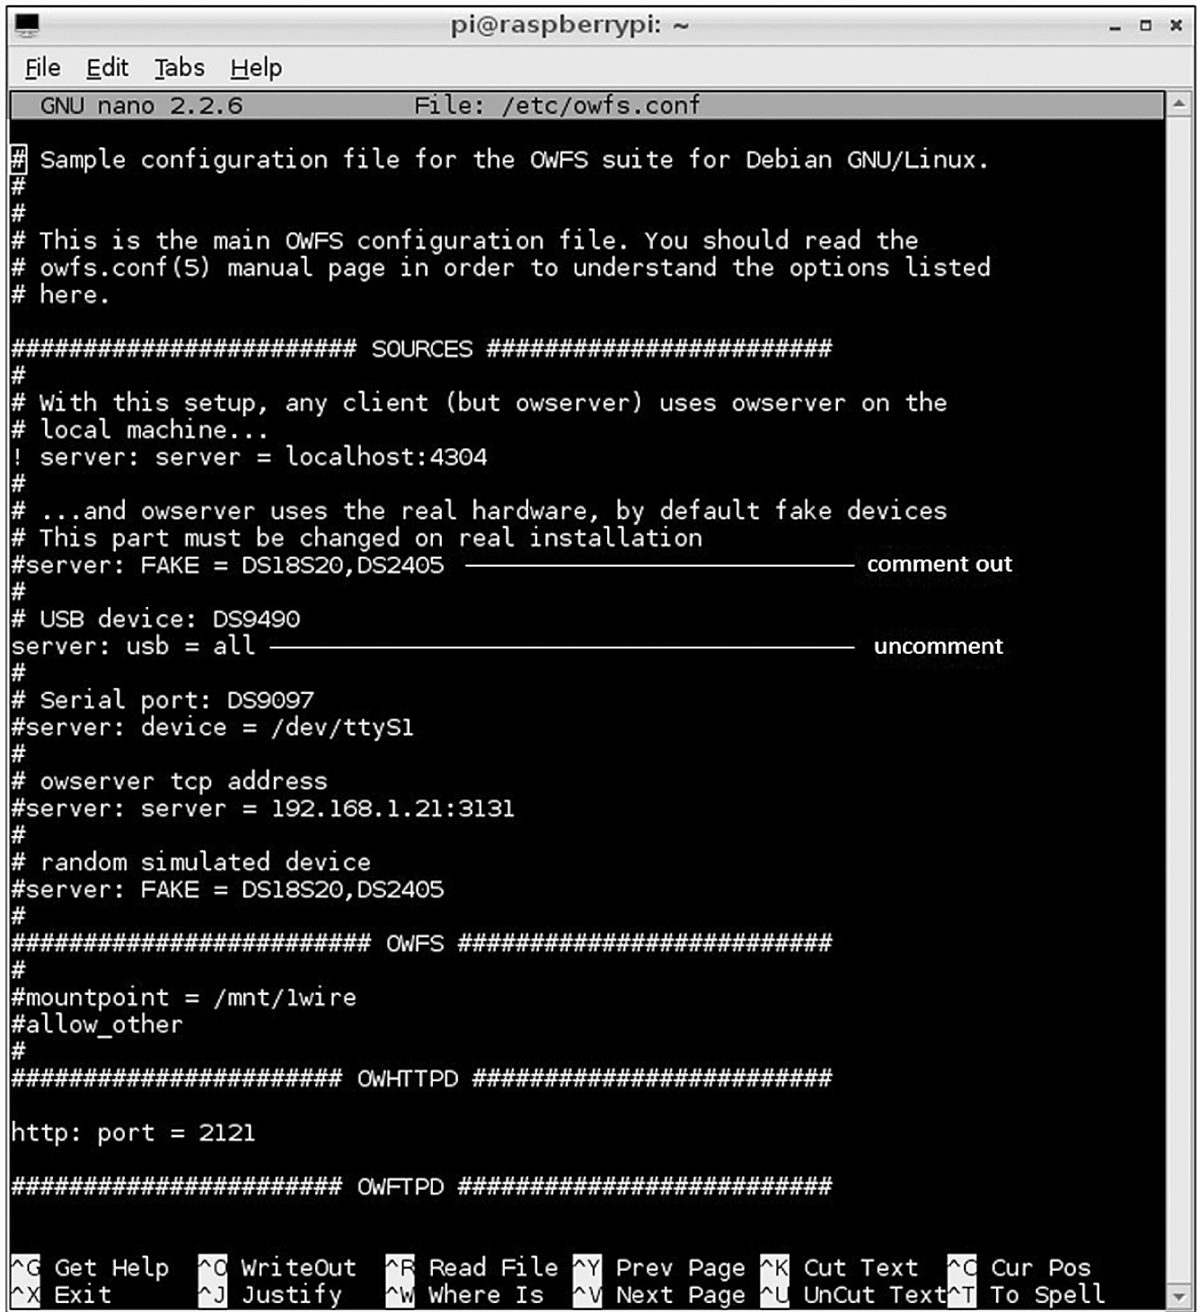
Figure 10–17 The owfs.conf file changes.
4. The last step should be to reboot the RasPi in order to put the configuration changes into effect:

Viewing the Weather Data
The real-time data from the modules may be viewed from the owfs server. Open a browser on another computer other than the RasPi, and go to the local RasPi IP address with port 2121 appended. In my case it was:

Figure 10–18 is a screenshot of the owfs server opening page, showing a directory name for each of the modules from Fig. 10–16.

Figure 10–18 The owfs web server opening page.
The first three directory names listed in the owfs server opening page are for the actual sensor modules, while the fourth is for the USB dongle. The rather odd directory name is how owfs interprets the module ID. For example, by clicking on the directory named 28.C1EA25030000, you open another page, shown in Fig. 10–19, that provides data from the Temperature Module.

Figure 10–19 Temperature Module results.
A lot of information appears, but the key data is the temperature itself, which is shown at 20.8125 °C. You need to refer to the owfs user’s manual to determine what all the other data means except the temphigh and templow entries, which are self-explanatory. Apparently, those readings are shown in degrees Fahrenheit due to the owfs default configuration setup.
Clicking on the directory named 26.882728010000 opens the Humidity Module page. Figure 10–20 shows the data on this page.


Figure 10–20 Humidity Module results.
Again, there is plenty of data shown as was the case with the Temperature Module results. The humidity reading is near the lower middle of the list and shows a value of 16.5187. I am certain that the sensor is nowhere near that accurate; however, the owfs software calculates a value based on the raw data sent back to it from the module.
The last module is the Barometer Module with its results shown by clicking on the directory named 28.827BBC000000. Figure 10–21 shows the data on this page.


Figure 10–21 Barometer Module results.
However, there is a problem here. If you look closely at all the data in this figure, you will not find any barometric pressure value. You must click on the directory entry named B1-R1_A to view another page with the desired data. Figure 10–22 shows this page.

Figure 10–22 Barometric pressure value.
The pressure displayed is 1001.87 millibars. The actual pressure measured at a nearby airport was 1014.6 millibars, so the Barometer Module was reading a bit low. The potentiometer mentioned in the module discussion needs to be adjusted to properly calibrate the barometric sensor.
Packet Sniffing
I connected the 1-Wire Sniffer Module to the network to test out the functionality. The sniffer was connected to a 64-bit laptop by using a USB-to-serial-port adapter. The laptop was running the Windows 7 Ultimate OS. I also used the Tera Term program that I previously discussed in Chap. 5 with a terminal configuration as listed in the above sniffer module discussion. Figure 10–20 Humidity Module results.
I also decided to test the remote login capability that required me to determine my home network’s public IP address. The procedure detailed in Chap. 8 was used. I also set the home network router’s port forwarding to 2121 and pointed it to the RasPi’s local address. Figure 10–23 is a combined screenshot that shows both the owfs opening page along with the Tera Term display of packet data that was created by this action.

Figure 10–23 Screenshot of an owfs initial page overlaid with Tera Term packet data.
The interpretation of the first line of data follows:
First data packet = RP F0 28 C1 EA 25 03 00 00 C4
RP is short for presence pulse.
F0 is a one byte ROM command. This one returned the ROM module ID.
28 C1 EA 25 03 00 00 is the ROM ID sent back to the master.
C4 is a CRC check byte used for error checking.
The following three lines in the sniffer window performed the same action for the other three modules in the 1-Wire network. Notice that they are displayed in precisely the same order as they are listed in the owfs directory web page.
I then clicked on the Temperature Module directory to see what the sniffer returned. Figure 10–24 is the resulting screenshot.

Figure 10–24 Screenshot after the Temperature Module directory was clicked.
As one might expect, there is obviously a lot more information being created so that owfs can populate the Temperature Module’s report page (Fig. 10–19). You should notice that the module’s ROM ID is repeated in each line of the sniffer display. This makes it quite easy to identify the specific module that is transmitting data over the 1-Wire network. I refer you to the owfs user’s manual if you desire to learn more about commands and returned data.
Future Expansion
Adding modules is very simple, and the owfs software will easily handle most existing 1-Wire weather modules. You are really limited by your own resources, if you desire to add additional modules to the 1-Wire network.
A useful module to add would be an anemometer to measure wind speed and a compass encoder to get wind direction. The only other module that could be added to fully populate this weather station is a rain gauge.
Summary
The chapter began with a review of the weather station design that is based upon using a series of separate, interconnected sensor modules, all using the 1-Wire network.
Next, the components and functions of each module used in the project were discussed.
The 1-Wire protocol was then examined along with an integral controller chip, the DS2438A.
Various ways the 1-Wire network could be powered were also reviewed and the pros and cons of each approach were pointed out.
Instructions on how to set up both the hardware and software were provided. The software package owfs was also configured to provide Web-based weather reports. These reports were accessed both locally over the home network and remotely over the Internet.
Finally, the Sniffer Module was discussed as a means of checking real-time data flowing over the 1-Wire network. This is a very handy tool to have available for debugging and for program development.
