
APPENDIX 1
A More Detailed Analysis of the Non-Environment Control Room and its Absorption Systems
Introduction
As part of an investigation being undertaken at the Institute of Sound and Vibration Research (ISVR) at Southampton University, UK, into the effectiveness of various forms of low frequency absorption systems, advantage was taken of the opportunity to measure the progressive effects of the acoustic control treatments in a ground up studio during its construction.1 (Tio Pete studios, Urduliz, Bilbao, in the Basque region of Spain.) The sound control room was the first part of the studio to be completed, in an overall shell (studio included) of 20 m × 12 m × 8 m high. During the construction of the control room, a series of 44 measurements were taken (11 at each of four different places) during the different phases of the work, beginning with a bare shell and ending with a finished control room. Measurement 1, the bare concrete shell, proved to be of little use, due to excessive reverberation, so only measurements 2 to 11 at the listening position are presented here. The general aim of the control room design was to create a monitoring environment with a decay time of around 0.2 s in a control room of about 200 m3. If anything could be gleaned from the results that could reduce the proportion of overall volume consumed by the acoustic control system, then that would be useful. Indeed that was one of the prime objectives of the ISVR investigations – higher degrees of control in small rooms – because the great majority of recordings were, and still are, currently being made using inadequately controlled, small rooms.
A1.1 Room Philosophy
The room which was measured was of the Non-Environment, hard front-wall/highly absorbent rear-wall design concept, where the room decay time is source-position dependent, with the lowest decay time being for sources mounted in the hard front wall; the normal location for the loudspeakers. The rooms become progressively more live as the source moves towards the centre of the room, hence the rooms are not oppressive for the personnel working in them, and the small loudspeakers close to the mixing desk are in a rather more lively environment than the main monitors, which are located in positions which result in the greatest overall response flatness at the listening position.
The principal reflective surfaces are the front wall and the floor, and these are typically opposed by a highly absorbent rear wall and ceiling, respectively. Each side wall is reasonably absorbent, so they do not need to be as heavily treated as the rear wall and ceiling, which both face hard, reflective surfaces. Of obvious importance (if a maximally flat frequency response is to be achieved at the listening position and in a designated listening area around and behind it) is to have a relatively uniform and rather short decay time versus frequency. The means of achieving this in many such rooms has been somewhat empirically designed over many years. Nevertheless, the rooms have been developed to a state whereby they are widely considered to be excellent, and the wideband absorption is very effective. However, without a greater understanding of the complex interdependence of the absorption systems and their component materials, the prediction of their effectiveness in other circumstances, or the reduction of their size whilst maintaining the same absorption efficiency, has been something of a question of trial and error, and very time consuming. Hence the undertaking of the investigation programme at the ISVR.
A1.2 Systems of Absorption
In the room whose characteristic responses are presented here, the outer shell is of concrete, with an inner structure based on the old Camden partitioning principle. The 10 cm timber stud frame is covered on the outside with a double layer of 13 mm plasterboard, but the material sandwiched between the two layers is a 3.5 kg/m2 plasticised deadsheet, instead of the insulation board used in the old designs. Between the studs, the cavities are filled with 10 cm of 40 kg/m3 mineral wool (although frequently two 2 cm layers of a 60 to 80 kg/m3 cotton-waste felt are used). The studs are then faced with deadsheet, followed by 2 cm of a 60 kg/m3 cotton-waste felt. The ceiling structure is essentially similar to that of the walls, except for having a 22 cm depth due to the dimensions of the ceiling timbers. The floor is a 10 cm, floated, reinforced concrete slab, and the front wall consists of a stud frame with multiple board layers with interspersed deadsheets, faced with 10 cm of irregular-faced granite and cement, to provide a massive baffle extension for the loudspeakers. The remaining treatment consists of an arrangement of plywood and chipboard panels, covered on one side with a damping layer of 3.5 kg/m2 deadsheet, and on both sides with a 4 cm (2 × 2 cm) layer of cotton-waste felt. These are hung from chains, both parallel to the wall surfaces and also at various other angles, mounted in a manner which can be seen in Figure A.1.9(e).
Work by Alistair Walter, at the ISVR in 1998, showed the powerful waveguide effect of these panels, which had been thought for some time to be an important component part of the overall effectiveness of the absorption systems. (See also Figures 23.9 and 23.10.) In three investigations the solid panels themselves had been shown not to be responsible for any significant absorption, though the absorbent materials alone, suspended without the panels, had not been found to be even nearlyas effective as with the panels inserted.2,3,4
The following is a list of the measurements taken at the listening position at each stage of the work. The photographs in Figure A.1.1 show the state of construction at the time that each measurement was taken, and the layout of that figure corresponds with the layout of Figures A.1.2 to A.1.6, for easy comparison. These Figures will be introduced section by section, as each measurement system is discussed in turn.
Description of Construction Work Prior to Each Measurement
Measurement No. 2
The empty shell, with only the framework for the vocal and machine rooms.
Measurement No. 3
Stud frames of the control room walls and ceiling, erected and covered on the outside with plasterboard/deadsheet/plasterboard sandwiches.
Measurement No. 4
Construction of concrete isolation wall around control room (see photograph of concrete block). See also Figure 4.28.

Figure A.1.1:
Photographs corresponding to measurement numbers.
Measurement No. 5
All wall frames filled with mineral wool and covered on inside with deadsheet and felt. Front wall boarded, and loudspeaker flush mounted. Vocal and machine rooms lined with deadsheet and mineral wool.
Measurement No. 6
Large (6.5 m × 4 m) absorbent-covered chipboard panel hung in front of back wall.
Measurement No. 7
Ceiling lined with deadsheet and felt.
Measurement No. 8
Absorbent-covered suspended panels installed next to both side walls.
Measurement No. 9
Ten waveguide panels mounted in front of back wall.
Measurement No. 10
Twenty waveguide panels mounted in front of back wall.
Measurement No. 11
Absorbent-covered suspended panels installed below the ceiling.
A1.3 Discussion of Results
A1.3.1 Waterfall Plots
Figure A.1.2 shows waterfall plots derived from the frequency response function measured at the intended listening position. Comparing measurements #2 and #3 of Figure A.1.2 shows that the introduction of the stud frames of the walls and ceiling, covered on the outside with plasterboard/deadsheet/plasterboard sandwiches, greatly reduces the decay time in the sub-100 Hz frequency range. The frequencies above 100 Hz remain broadly unaffected though. The introduction of the outer, concrete isolation shell between measurements #3 and #4 can be seen to increase the low frequency energy in the room, and not until measurement #11 does this fall back to that shown for measurement #3. These measurements are interesting in that they clearly show the effect of an outer concrete isolation shell on the internal acoustics. As was described at the beginning of Chapter 4, and in Sections 6.3 and 13.7.1, the heavier and more effective the isolation shell, the more difficult becomes the internal low frequency control.
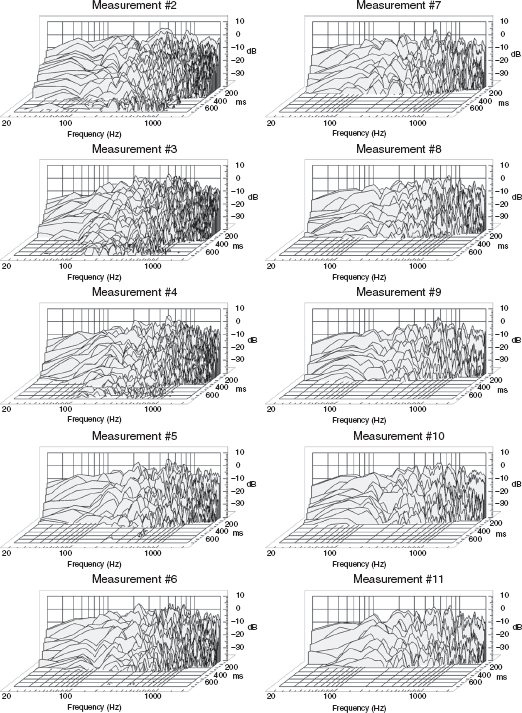
Figure A.1.2:
Waterfall plots.
Measurement #5 was taken after all the wall frames had been filled with mineral wool, and covered with deadsheet and felt. The front wall had also been boarded, resulting in an increase in low-frequency energy being radiated by the loudspeaker (compared to measurements #2 and #4) due to it being flush mounted at this stage. Despite the ceiling still being hard-surfaced, the effect of the treatment on the frequencies above 100 Hz is drastic, having the same order of effect that the plasterboard sandwiches had on the lower frequencies. At this point in the construction, a floor-to-ceiling ‘chatter’ was quite subjectively pronounced on speech within the room, as all the other reflexions had been very much reduced. This is a typical effect at this stage of a construction because of the ear’s sensitivity to sounds occurring in isolated directions. However, it is interesting to note that very little of this significant subjective effect is evident on the plots, presumably because of the position of the source in the hard front wall.
Measurement #6 was taken after a large (6.5 m × 4 m) absorbent-covered chipboard panel was hung in front of the back wall. This produced an unexpected result – very little except a small increase in decay time in the 100 Hz region. Experience over many years had shown that rooms that have these large panels have exhibited much more isolation to the outside, without the internal acoustics suffering, as compared to rooms without the panels. It seems rather odd that such a large item could be introduced into a room with so little effect on the response (the slight rise in decay time at 100 Hz is presumably due to its masking effect on the deadsheet-covered back wall), but it seems to be the case. (Nevertheless, after the data presented in this set of measurements, the use of these panels was suspended in rooms where effective isolation shells already existed. Evidence which will be presented in following sections showed that the suspected manner in which they could work as extra panel absorbers in fact did not operate to any significant degree.)
Measurement #7 was taken after the lining of the ceiling with absorbent material. All trace of any low-level activity beyond 400 ms, evident in the earlier measurements, has been removed from the plot. The floor-to-ceiling ‘chatter’, previously heard on speech in the room, disappeared, but a low-level resonance was still audible. Prior to measurement #8, the suspended panels were installed in the side walls, and the waterfall plot shows little effect except for a decrease in decay time in the 100 – 500 Hz range.
Measurement #9 was taken after the mounting of 10 of the angled ‘waveguide’ panels in front of the large panel parallel to the rear wall. The waterfall plot shows that installing these panels (each 1.2 m × 4 m) reduced the decay time in the 200 – 1500 Hz range by a noticeable amount. Measurement #10 is as measurement #9, but with 20 panels occupying the same space as the previous 10. The increase in the number of panels appears from the waterfall plots to have had almost no effect at the listening position. The spacing of these panels, together with their optimum angle, was, at the time of analysing the measurements, the subject of research by Stuart Colam at the ISVR.
Finally, the ceiling ‘trap’ system, consisting of five panels, up to 1.2 m deep and 6 m long, was installed prior to measurement #11. The panels were set at angles such that they all pointed their lower edges towards the centres of the monitor loudspeakers. In the past, much importance has been attached to these panels, and it had been noticeable that rooms with insufficient ceiling space for them have been subjectively inferior to rooms with adequate ceiling traps. Measurement #11 clearly shows a very significant reduction in the decay time of the lowest octave, 20 – 40 Hz. This bears out the subjectively ‘tighter’ bass attributed to the rooms with adequate ceiling traps. The word ‘trap’ is perhaps a good choice here, because, being angled edge-on to the expanding wavefront, the panels would appear to offer little obstruction to the entry of the sound waves, but the exit route via the heavily-lined ducts which they form is extremely difficult to negotiate. The arrangement of these panels also serves to interrupt the parallel surfaces of the floor and ceiling, removing all traces of any remaining ‘chatter’.
A1.3.2 Reverberation Time Plots
The reverberation time (RT) plots shown in Figure A.1.3 are actually point-to-point diagrams with each point determined by one-third octave Schroeder integration. As well as the usual – 60 dB decay times, the figures also include the decay time to – 30 dB as these can prove a useful guide to many subjective effects. One limitation of these plots is demonstrated in Figure A.1.7, which shows the equivalent RT for the set of filters combined with a theoretical model of the loudspeaker. This ‘additional’ reverberation, which is not a property of the room, is present in all of the plots and cannot, in general, be corrected for. In order to minimise the decay in the loudspeaker response, the sound source was a 15 in low resonance (20 Hz) drive unit in a 500 litre sealed cabinet, which was capable of giving a useful output down to 10 Hz. A comparison between the RTs for the later measurements in Figure A.1.3 and those in Figure A.1.7 reveals that much of the apparent reverberation at very low frequencies is due to the third-octave filters and the loudspeaker, as well as the room. The waterfall plots in Figure A.1.2 suggest that much low frequency absorption has taken place by the time of measurement #5; this is less apparent in the RT plots of Figure A.1.3. Nevertheless, the trend of the RT plots is generally downwards from measurement #3 onwards (measurement #3 was taken after the studwork shell introduced six relatively hard and plane surfaces around the microphone).
Two points worth observing from Figure A.1.3 are the reduction in RT due to the construction of the two remaining concrete outer isolation walls before measurement #4, and the very noticeable effect that the ceiling panels have at low frequencies (#11). The completion of the concrete isolation wall, tightly fitted round the rear and left wall of the control room, with fibrous material in the gap, actually appears to reduce the RT of the room. This may be due to a damping effect on the stud-framed walls. As previously mentioned, the addition of the large rear suspended panel also caused a small increase in RT to be apparent in measurement #6, although its effect is not obvious in the pressure amplitude response.
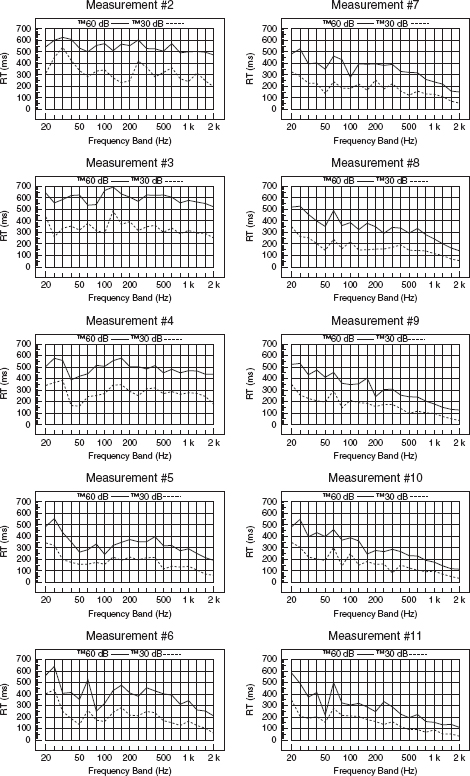
Figure A.1.3:
Reverberation time plots to –30 dB and –60 dB.
A1.3.3 Energy/Time Curves
Not surprisingly, the energy/time curves (ETC) in Figure A.1.4 show details which are not apparent in the waterfall or RT plots, such as discrete reflexions. One such reflexion is that due to the floor. This reflexion appears about 10 dB below the direct signal and about 5 milliseconds later, and is present in all the measurements (although it arrives more rapidly in measurement #2 because the loudspeaker cabinet was still on the floor). In the finished room, its independent nature would be broken up by the presence of the mixing console. Measurement #3 shows a rise in the level of reflected energy due to the completion of the smaller, inner case of the control room bringing the reflective surfaces nearer to the microphone.However, from then on, the trend of the plots is downwards (except for the previously mentioned effect on measurement #6, and some minor effects due to the concrete outer isolation shell before measurement #4).
Table A.1 shows the decay times to –20,–30,–40 and –50 dB for the last five plots. Ten milliseconds have been deducted from the time scales to allow for the arrival of the direct signal at 10 ms.
Only three reversals take place in the downward trend. Two are of only 1 ms, but the third is after the strangely low figure for measurement #9 crossing the 20 dB line. This is only due to the spike around the 28 ms mark on the plot being on the threshold of the line. If it were 1 dB higher, then the anomaly would not exist. (But this is well within the bounds of normal measurement error).
If a diagonal line is drawn from the peak of the direct signal to the60 dB/200 ms point, it becomes apparent that the reflected energy has been reducedin measurement #10 from that in #9. This suggests that the closer panel spacing is absorbing more energy. This fact is not apparent from the waterfall or RT plots. The most clear indication of the effectiveness of the ceiling panels is shown by the plot of measurement #11, with significantly reduced energy in the 100 – 200 ms region.
Table A.1: Decay times (milliseconds) for measurements #7 to #11

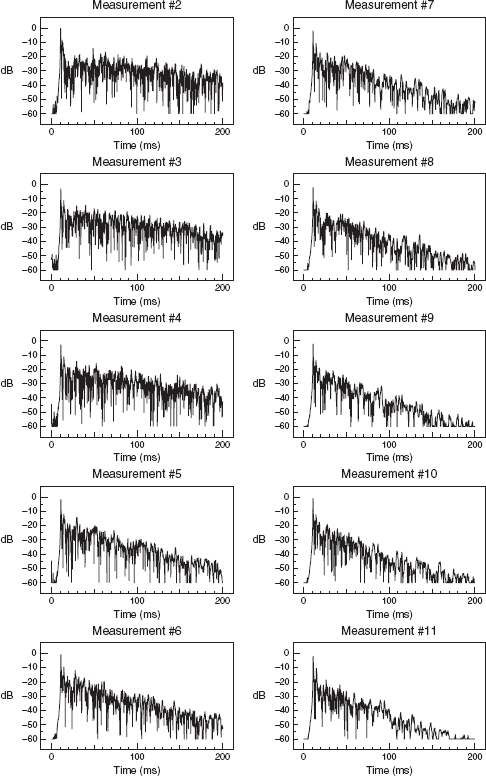
Figure A.1.4
Energy/time plots (ETCs).
A1.3.4 Schroeder Integration Plots
Figure A.1.5 shows a sequence of Schroeder plots which again clearly show a significant downward overall trend in the decay times as the construction progressed, resulting in a final figure in measurement #11 of about 350 ms. An increase in early reverberant energy is apparent in measurements #3 and #4, after the progressive enclosure of the control room space, and an increase in decay time can be seen in measurement #6, after the installation of the large, rear suspended panel. (As mentioned earlier, the use of such panels was abandoned soon after these measurements were analysed, except in cases where the extra isolation which they afforded was required.)

Figure A1.5:
Schroeder integration plots.
A1.3.5 Pressure Amplitude Response Plots
Once again, a clear trend is apparent in the pressure amplitude plots of Figure A.1.6; a progressive flattening of the response as the room treatment is added. The severe peak and dip in the sub-100 Hz region can be seen to change frequency during the early measurements, especially due to the additions to the structure before measurements #3, #4 and #6, but beyond measurement #7 there is a stabilisation of their frequencies, which is accompanied by a reduction in their amplitudes. The addition of the ceiling panels, as shown in measurement #11, deals most effectively with these irregularities, and significantly flattens the low-frequency response.
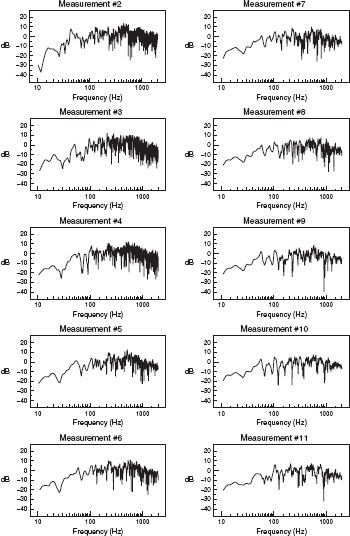
Figure A.1.6:
Pressure amplitude plots.

Figure A.1.7:
Equivalent reverberation time of one-third octave filters and loudspeaker combined. These will tend to cause the low frequency decay times to over-read on the plots in Figure A.1.3.

Figure A.1.8:
One-third octave response of completed room (Measurement No. 11) with correction for loudspeaker roll-off.
Figure A.1.8 shows the pressure amplitude plot for measurement #11, but this time in one-third octave bands, after having been corrected for the low frequency roll-off of the loudspeaker using a suitable theoretical model. The response is seen to lie within ±4 dB from 10 Hz to 2 kHz; a demonstration of the effectiveness of the acoustic treatment.
A1.4 Summary
The measurements presented here outline the acoustic control available from a system of membranes, deadsheets, waveguides and fibrous absorbers. It has been shown how a short and well-controlled decay time can be created in a concrete isolation ‘bunker’. The effect of the introduction of each group of elements can be seen stage-by-stage. The techniques used are simple, require no special skills to install, and are flexible in their application. The major purpose of the exercise described was to provide a definitive proof of the concept.
It can be seen that in all of the series of measurements, each element of the acoustic control system, as it has been installed, has had a worthwhile effect on the overall room response (or rather the suppression of it). Despite the fact that no single display of the results has been capable of indicating all of the beneficial effects, the cumulative evidence from the whole presentation leaves little doubt that this method of room control is highly effective. The only exception that might apply is the effect of the large, rear, suspended panel. The origin of the concept of this panel was that it was discovered that it could be used to increase the isolation to and from the outside of the room without noticeably compromising the internal acoustics, but its beneficial effect in terms of low frequency absorption within the room has been shown to be insignificant.
Figures A.1.9 (a–e) to A.1.13 show various aspects of the construction of this type of room.
A1.5 The Scientific Findings
During the final stages of the production of the first edition of this book, Stuart Colam presented his doctoral thesis on the means by which the so-called ‘trap’ systems operate. Following on from work by Alistair Walter (see Figures 23.9 and 23.10) which clearly showed the waveguide effect, and after his own MSc work2 which concluded that the suspended panels, in themselves (i.e. the wooden cores of the panels), did not contribute to any significant absorption, he made significant discoveries about how the panels functioned in arrays. It has now been shown that the arrays of panels have absorbent properties which are attributable only to the arrays as a whole, and not to their individual component parts.


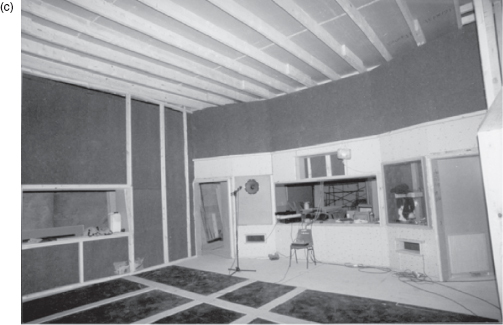
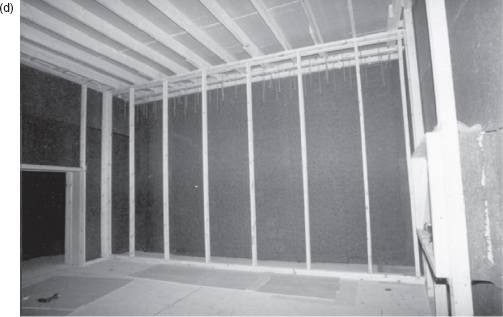
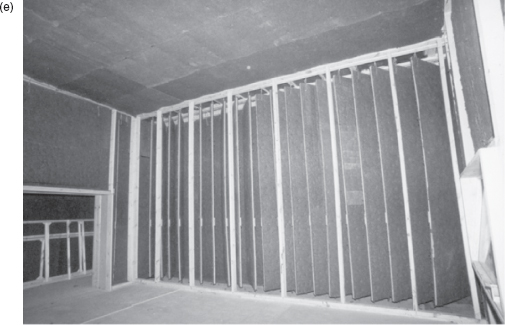
Figure A1.9:
Various stages of the room construction during the measurements described in Section A1.2. (a) The Tio Pete control room at the stage of Measurement No 2. (b) The loudspeaker wall framing at the stage of Measurement No 3. (c) The front of the room during Measurement No 5. (d) The rear of the room at the stage of Measurement No 6. (e) The 20-panel array in place during Measurement No 10.
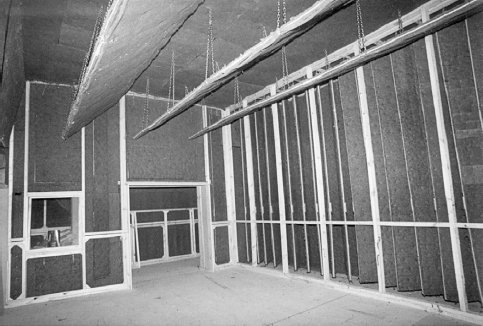
Figure A1.10:
The completed acoustic treatment, viewed from the monitor loudspeaker wall.
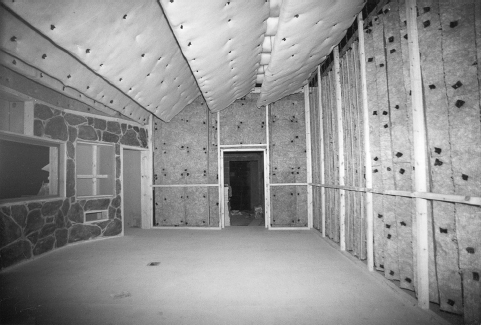
Figure A1.11:
The completed acoustic control system at Area Master Studios (now Planta Sónica 2), Vigo, Spain; viewed from the rear, and showing the closed nature of the ceiling panels from this viewpoint. Compare this with the view in Figure A.1.10.
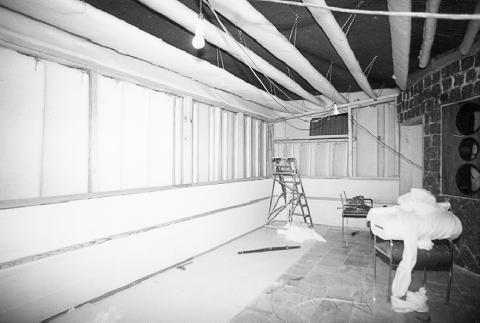
Figure A1.12:
Discosette 3, Lisbon, Portugal; at the stage of mounting the first fabric panels over the absorber systems. The floor is pink marble. The covering on the waveguide panels is Dacron.
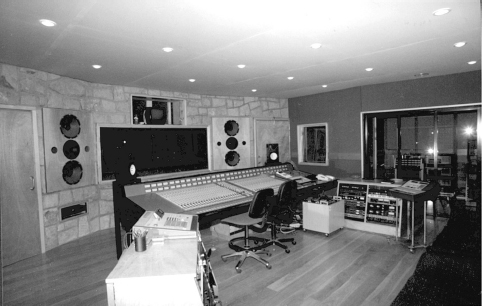
Figure A1.13:
The completed control room at Tio Pete Studios, Bilbao, Spain, the subject of the measurements presented in this appendix.
It has become clear from this work3 that the effects of the arrays differ with the angle of incidence of the acoustic wave, and that the side-wall arrays, the rear-wall arrays and the ceiling arrays do not all operate in the same manner. Furthermore, the manners in which they do work are not all equal with frequency. Take the arrays on the side walls, for example. At low frequencies, it has been found that a surface wave exists as the wavefront propagates along the face of the array. It can be modelled by means of an acoustic impedance at the front edge of the array. This would suggest that the inclination of the panels on the side walls, with their leading edges facing the front of the room in Figure 13.7, should be of no consequence to low frequencies, because the surface acoustic impedance does not depend on the direction of the incident wave. However, at somewhat higher frequencies, where the lined-duct effect is important, things would change dramatically if the panels were mounted with their leading edges pointing to the rear of the room.
The rear-wall trap systems receive what is essentially a plane wave, which strikes them perpendicularly. It has been shown that the absorption at lower frequencies can be improved when the panels are set at an angle of about 20° to the rear wall, but placing them at such a relatively flat angle tends to make the panels more reflective to the upper-bass and lower-mid frequencies. Experience has shown 45° to be a better compromise in terms of producing a flatter, overall room response.
Another aspect of the absorption mechanisms in the trap that is still under investigation is the ‘horn effect’, suggested by Professor Frank Fahy. In effect, the inclined panels may act like reversed horns, with the high particle velocity at the mouths of the openings giving rise to high pressure at the throat, where the panels almost touch the wall. The phase differences of the wavefronts on each side of the panels, due to their waveguide effect, lead to high particle velocities through the porous material between the panel and the wall as the pressure differences try to equalise themselves. In turn, this appears to give rise to resistive losses due to the tortuosity and friction in the path through the fibrous materials, and hence, in turn, gives rise to considerable absorption. In a highly tuned system, this would be very selective in the frequencies of maximum absorption, but in practice, the effect seems to be quite low Q. Nevertheless, this may be just one of many mechanisms at work in these complex absorber systems.
The ceiling panels have usually been inclined such that their leading edges pointed towards the loudspeakers, in the belief that this provided the easiest access to the labyrinth for the expanding waves leaving the loudspeakers. However, the work by Colam suggested that at low frequencies, the lower edges of the panels may again provide a surface acoustic impedance, which should not be significantly affected by the precise angling. Despite this, further work by the same investigator seemed to show that the beneficial effect at very low frequencies could also be due to the broader spread of the effect created by the different panel depths and angles of incidence with respect to the ceiling. (See Figure 16.2.)
That these absorption systems should have been empirically developed will come as no surprise once the true complexity of their operation is better understood. They have been designed and developed by engineers, as opposed to scientists.4 The scientific studies are now beginning to better understand what the engineers have achieved, and this should be a big help to further development. Indeed, it is the complex nature of the overall systems which has seriously inhibited computer modelling, because the input data simply has not been available. This has also been a block to more traditional design approaches to the Non-Environment rooms. One is simply not going to find how to make the practical absorption systems by reading the established text books. However, the fact that the Wright brothers did not have any text book to confirm the aerodynamic principles of their first aeroplane did not prevent it from flying. The engineering led to more science, which in turn led to better engineering. The parallel with these absorber systems is very real, and more science and engineering will yield even better results in the future.
The current ‘Holy Grail’ is to improve efficiency in order to reduce the size of the arrays, and to improve their effect in smaller rooms. Progress by engineering ‘cut-and-try’ approaches is slow, which is why more effort is being made on the scientific front, so that ways can be found to better predict the results of changes, and hopefully speed up the development.
Until about 2000, everybody involved had thought that the suspended panels, themselves, contributed to the absorption. When one-tenth scale modelling was carried out in 1990,5 it failed to detect absorption, and the suspicion was that the modelling technique, itself, was flawed. Ten years later, Colam’s work confirmed the modelling to have been correct, and that the suspended wooden panels do not contribute to the absorption. They tend to re-radiate the great majority of whatever vibrational energy they receive, in a reactive manner. However, the deadsheets covering one side of the panels provides some damping, and so will give rise to a certain amount of additional absorption.
A1.6 More Recent Research and Development
Figures A.1.14 to A.1.17 show various views of the ‘critical listening room’ at the University of Vigo, Spain, which has also been used as a test-bed for much physical measurement of the absorber systems. Some of the results of this work have already been published,6,7 and Figure A.1.18 shows the averaged absorption across the face of the rear absorber. From Figure A.1.19 it can be seen very clearly that the waveguide effect of the panels is significant, and that it must lead to phase differences either side of each panel where their felt layers make contact with the rear lining of the ‘trap’. This highlights the need for the felt on the panels to touch the felt on the rear surface, because when the out-of-step pressure differences on either side of the panels try to equalise themselves, there will be a flow through this resistive material and so the frictional losses will give rise to low frequency absorption.
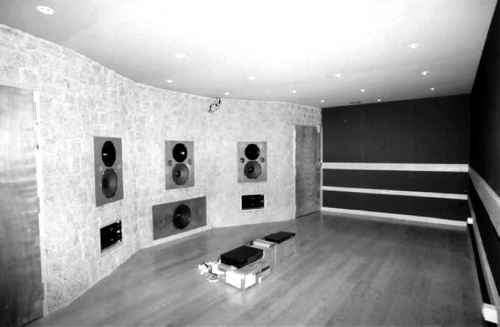
Figure A1.14:
The Non-Environment, multi-format listening room in Vigo University, Spain, 2004.
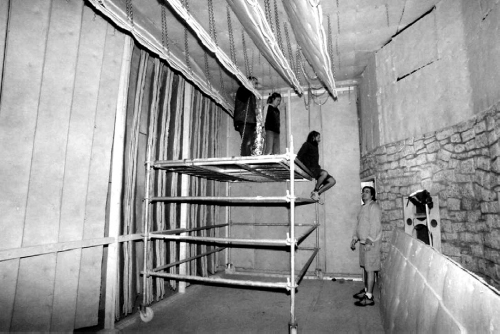
Figure A1.15:
The Vigo University room under construction.
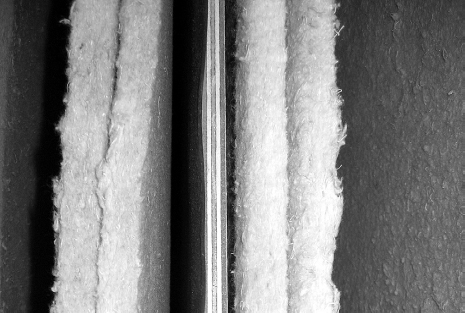
Figure A1.16:
Detail of the panel construction. The central core is of 12 mm plywood, with a layer of a 3.5 kg/m2 deadsheet stapled to one side to damp any panel resonances. On either side, loosely fixed, are two 2 cm layers of a flame retardant cotton-waste felt of about 60 kg/m3.
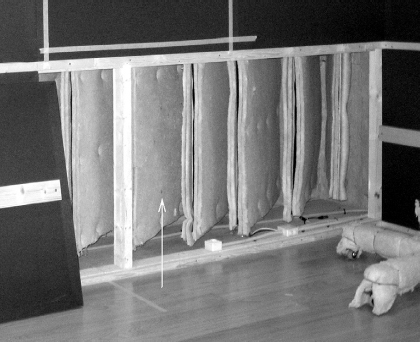
Figure A1.17:
The panel array behind the final, fabric covering.
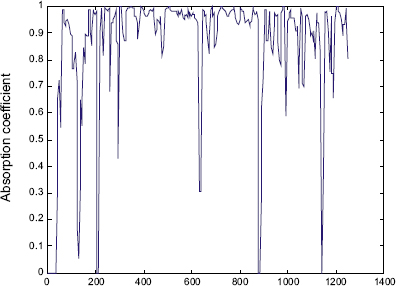
Figure A1.18:
Measured absorption coefficient of the rear wall absorption system. The deep, narrow dips are results of the measuring process.


Figure A1.19:
Vector plots of the energy flow, clearly showing that the normally arriving (i.e. perpendicular to the wall) sound wave has been turned to flow parallel to the panels.(a) 63 Hz; (b) 500 Hz.
Evidence has also been found of the cavities between the panels supporting quarter-wave resonances of a highly damped nature. Once again, it is the frictional losses due to the 4 cm fibrous lining that give rise to the absorption, due to resistive losses. Without doubt, there are multiple, overlapping mechanisms at work which all contribute to the general absorption of the ‘traps’.
References
1 Newell, P. R., Holland, K. R., ‘The measurement and analysis of a control room acoustic treatment during construction’, Proceedings of the Institute of Acoustics, Vol. 22, Part 6, pp. 179–191, Reproduced Sound 16 conference, Stratford-upon-Avon, UK (2000)
2 Colam, S., Holland, K. R., ‘An investigation into the performance of a chipboard panel as a low frequency sound absorber’. Proceedings of the Institute of Acoustics, Vol. 21, Part 8, pp 105–112, Reproduced Sound 15 conference, Stratford-upon-Avon, UK (1999)
3 Colam, Stuart, ‘An investigation into an empirically designed passive sound absorber for use in recording studio control rooms’. Ph.D. thesis, ISVR, University of Southampton, UK (2002)
4 Newell, P. R., Holland, P. R., The acoustic ‘trap’ absorber systems: a review of recent research, Proceedings of the Institute of Acoustics, Vol. 25, Part 7, Autumn Conference, Oxford, UK (2003)
5 Soares, Luis, E. B. ‘An experimental study of the responses of a recording studio control room at low frequencies using a 1:10 scale model’, MSc thesis, ISVR, University of Southampton, UK (1991)
6 Torres-Guijarro, Soledad; Pena, Antonio; Rodrigez-Molares, Alfonso;and Degara-Quintela, Norberto, Sound field characterisation and absorption measurement of wideband absorbers, Presented at the 126th convention of the AES, Munich, Germany (May 2009)
7 Torres-Guijarro, Soledad; Pena, Antonio; Rodriguez-Molares, Alfonso; and Degara-Quintela, Norbero, A study of wideband absorbers in a Non-Environment control room: Characterisation of the sound field by means of p–p probe measurements, Acta Acustica with Acustica, Vol. 97, pp. 82–92, (2011)