
APPENDIX 2
Measured Loudspeaker Responses
The purpose of this appendix is to emphasise the degree of difference in the responses of 38 loudspeakers, all of which were advertised by their manufacturers as small, professional, music-monitoring loudspeakers. All of the measurements were made in the anechoic chamber shown in Figure 4.2, and all measurements were made with the loudspeaker and microphone in the same position. They were all carried out by Dr Keith Holland, who is currently a senior lecturer at the Institute of Sound and Vibration Research. The measurements are incontrovertible.
None of the 38 plots of on-axis frequency response and harmonic distortion are similar to the eye, even when only viewed casually. Neither are the 38 plots of the step functions, nor the waterfalls. What is more, these are all on-axis responses taken in an anechoic chamber. When one considers that each loudspeaker will exhibit its own, unique, directivity characteristics, then when placed in a normal room it is totally inconceivable that any two of the loudspeakers would sound alike. What is shown in this appendix is a very powerful testimony to the fact that when we are monitoring via loudspeakers, the loudspeakers and rooms will significantly impose their characteristics on the overall sound unless careful measures are taken, such as those discussed in Chapters 15 to 20, and even then, perfection is unachievable.
Nevertheless, this appendix serves as a reminder of just how variable even professional monitoring loudspeakers are. When we delve into the world of domestic music system loudspeakers, the variability in responses becomes even more exaggerated.
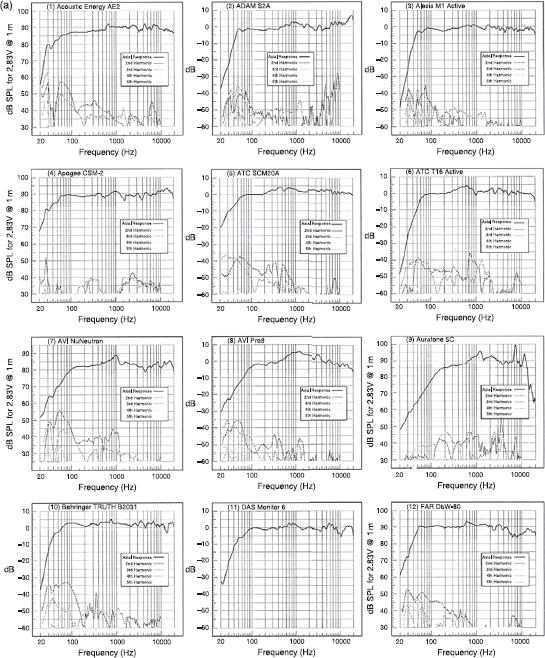
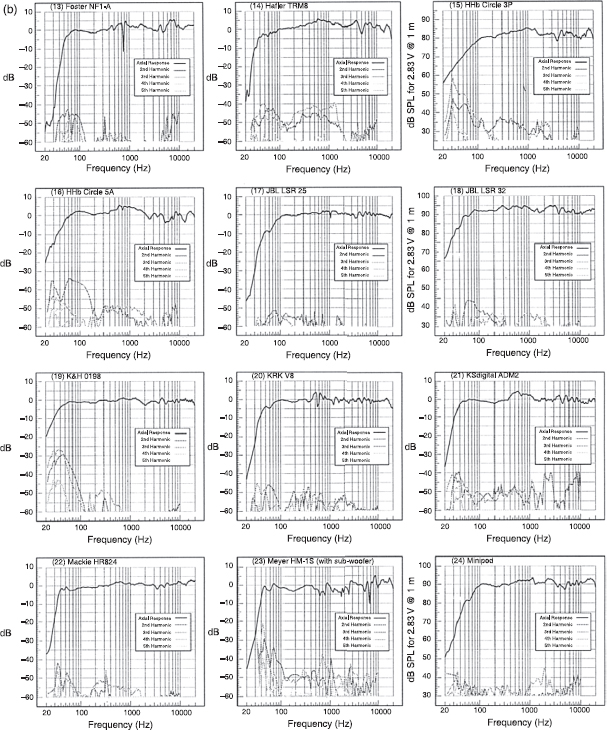

Figure A.2.1:
(a–c) On-axis frequency response and harmonic distortion (a) numbers 1–12 (b) numbers 13–24. (c) numbers 25−36.
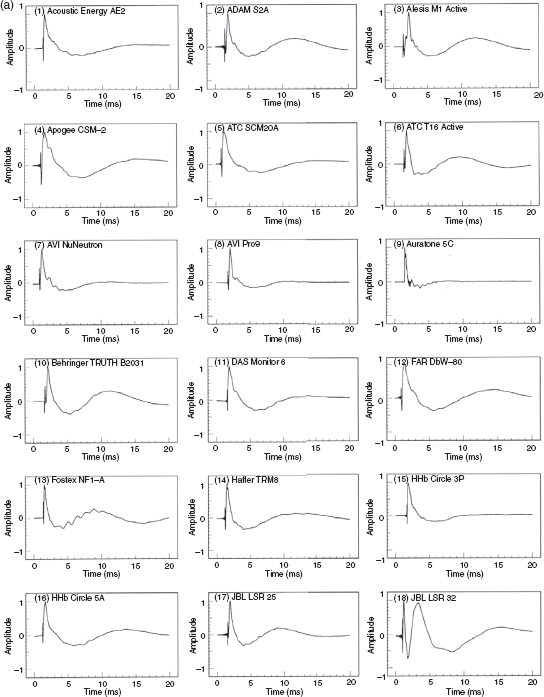
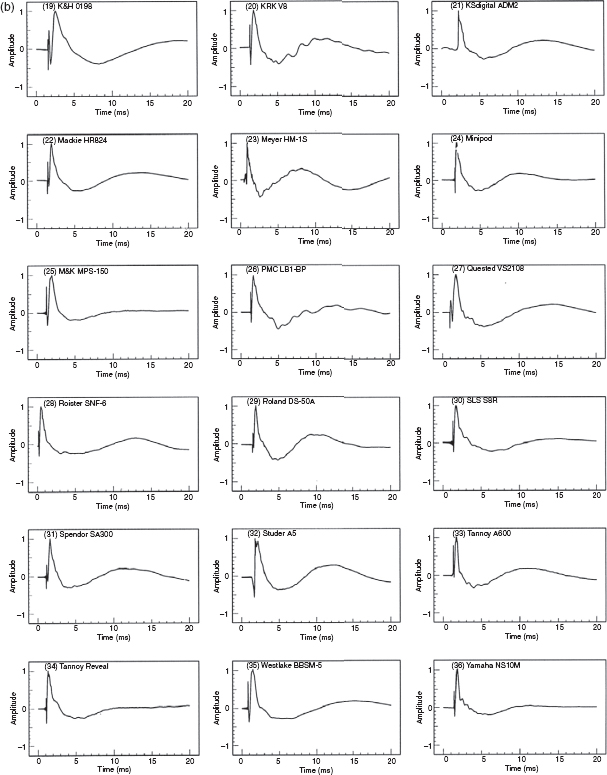
Figure A.2.2:
(a, b) Step respones (a) numbers 1–18 (b) 19–36.
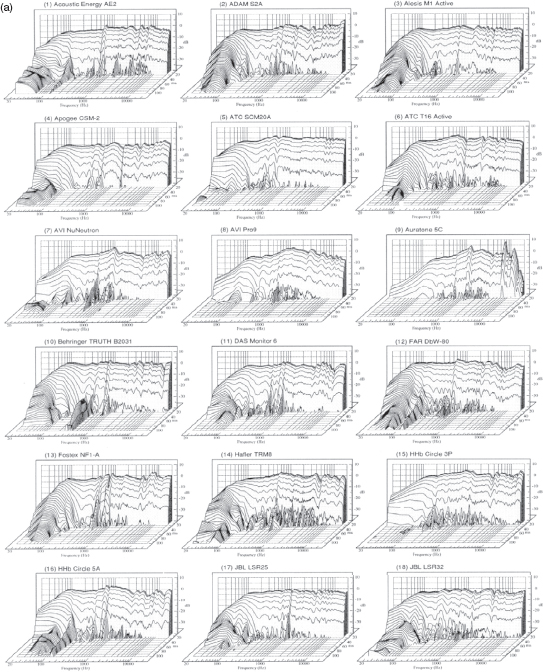
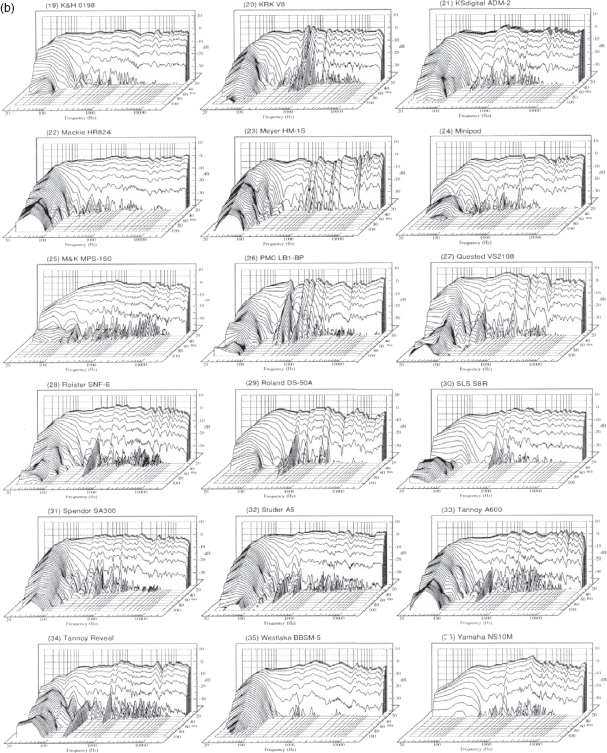
Figure A.2.3:
(a, b) Waterfall plots, (a) numbers 1–18 (b) 19–36.
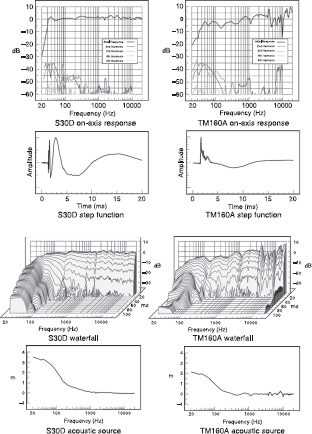
Figure A.2.4:
From the comparison of the various response characteristics of the Genelec S30D and the SAE TM160A loudspeakers, some interesting points can be highlighted. The S30D possesses a variety of switches for modifying the response according to mounting conditions or taste. When the switches are set to give a flat response in anechoic conditions, as shown above, the time response suffers badly, as can be seen from the waterfall and acoustic source plots. For the most natural sound, with faster transients, the most extended flat response is not always (and for small boxes it is rarely) the optimum response.1 The side-by-side comparison of the responses of the two loudspeakers shown in this figure tends to raise the question as to just how it can be that two so dissimilar loudspeakers are ostensibly designed to perform similar tasks. Both loudspeakers were submitted as part of a loudspeaker test series for a recording industry magazine. They were tested under identical conditions to the 36 loudspeakers shown in the previous three figures. This once again highlights how the responses published by the manufacturers of almost all the loudspeakers are sadly lacking in details of their very important time responses.
Reference
1 Newell, P. R., Holland, K. R., and Mapp, P., ‘The perception of the reception of a deception’, Proceedings of the Institute of Acoustics [Reproduced Sound 18 conference], Vol. 24, Part 8, UK (2002)