
Within Salesforce CRM, reports are accessed from the Reports tab. There are a large variety of pre-defined reports which are automatically provided when your organization is first set up by Salesforce. These pre-defined reports are known as standard reports and are located in pre-prepared report folders known as standard report folders. For example, standard reports provide information about accounts and contacts, details about opportunities, forecasts, products, and sales pipelines, information about your organization's leads, details about forecast reports for customizable forecasting, and so on.
In this section on reports, we will be outlining the available standard reports and describing some of the key reports for system administrators in particular detail.
The pre-defined reports are suitable for existing objects and fields. They would not be suitable for reporting on any new objects that you have created. For this, we will look at how to extend the existing reports and how to create completely new types of reports known in Salesforce CRM as custom report types.
When building reports from either standard or custom report types, Salesforce provides a full featured drag-and-drop editor to simplify the setup and layout of reports.
We will first look at how the use of report folders which can help organize and control access to reports by your users within Salesforce CRM. When clicking on the Reports tab, the reports Home page presents the following sections:

The Report Folders section allows you and your users to choose the reports that are stored in that specific folder.
In Salesforce CRM, you cannot save reports to the standard report folders. You can only save reports to the My Personal Custom Reports folder, the Unfiled Public Reports folder, or any Custom Report Folder where you have appropriate read/write access.
Using the link Create New Folder allows you to create new report folders for custom reports. The option to create new folders is not available to all users.
It is good practice to create new folders to help manage the structure of reports with your organization.
Unlike many IT systems, creating reports in Salesforce CRM is very simple for users to do themselves. Since it is so easy for users to create reports, without careful control and an organized approach to report creation, it is easy for the number of reports to rapidly increase and become difficult to manage. You should, for example, create report folders that only certain users have access to. This could be restricted to certain departments or geographic regions. For example, reports could be restricted to Global Marketing or to the North American Sales Team.
To create new report folders, click on the Create New Folder link where the following options are presented:
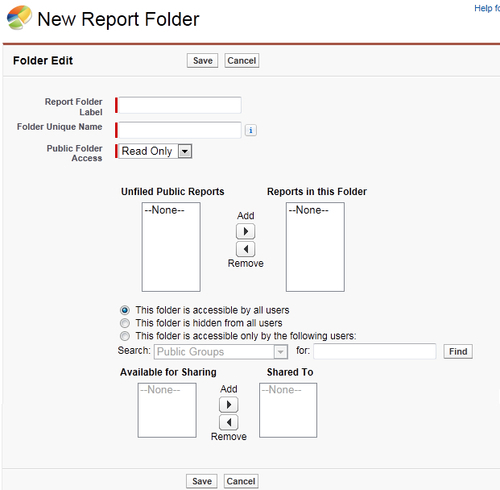
Here you create the name of the report folder and whether the public folder access is set to be read-only or read/write. You can optionally move reports from the Unfiled Public Reports folder. You must specify the accessibility to users where you will select from either accessible by all users, hidden from all users, or accessible by certain users that are in the following: Public Groups, Roles, Roles and Subordinates.
The basic steps for creating new reports are:
Tip
Best practices for reports
Establish a Report Naming Convention for example, "A01 NA April Sales", "B02 INT April Sales", and so on—this can make it easier to refer to reports using the coding scheme (there is maximum of 40 characters).
Use the Description field to describe exactly what the report is intended for (there is maximum of 255 characters).
Consider creating reports that are only needed for dashboards in separate reports folders called something like Dashboard Reports Sales, for example.
Have regular "Spring Cleans" where you delete unwanted reports. You can also create temporary reports that are hidden from all users and save these reports there while you figure out if they are required.
Selecting the appropriate report type is one of the most important steps in creating a report. Report types set the rules for which records can be shown in reports; they allow pre-defined sets of records and fields to be available within a report based on the relationships between a primary object and any related objects.
In the Salesforce CRM application, there are standard report types and you as system administrator can set up custom report types.
Note
Terminology check:
A Custom Report Type is different than a Custom Report in Salesforce CRM. When users create a new report using the New Report button on the Reports home page this is sometimes known as a custom report. A Custom Report Type is a report template that only system administrators can create. A Custom Report Type provides a custom set of associated objects and fields to produce pre-defined report templates from which any user's custom report can be created.
Salesforce provides a large range of pre-defined standard report types along with standard report folders accessible from the Reports tab as shown:
|
Standard report type |
Standard report folder |
Description |
|---|---|---|
|
Unfiled Public Reports |
Shared custom reports created by system administrators, but not moved into a custom report folder. | |
|
My Personal Custom Reports |
Customized reports that users have saved by clicking on Save As or Save within a report. | |
|
Account & Contacts |
Account and Contact Reports |
Information about accounts and contacts. |
|
Activities |
Activity Reports |
Information about calendar events and tasks |
|
Administrative Reports |
Administrative Reports |
Information about your Salesforce users, documents and reports. |
|
Call Center Reports |
Call Center Reports |
Information about phone calls that were handled with Salesforce CRM Call Center. |
|
Campaigns |
Campaign Reports |
Information about marketing campaigns. |
|
Salesforce CRM Content |
Content Reports |
Information about Salesforce CRM Content. |
|
Forecasts |
Forecast Reports |
Details about forecast reports for customizable forecasting. |
|
Leads |
Lead Reports |
Information about leads. |
|
Opportunities |
Opportunity and Forecast Reports |
Details about opportunities, forecasts, products, and sales pipelines. |
|
Price Books, Products, and Assets |
Products and Asset Reports |
Information about products, price books, and assets. |
The selection for standard reports in Salesforce CRM can be shown as follows:
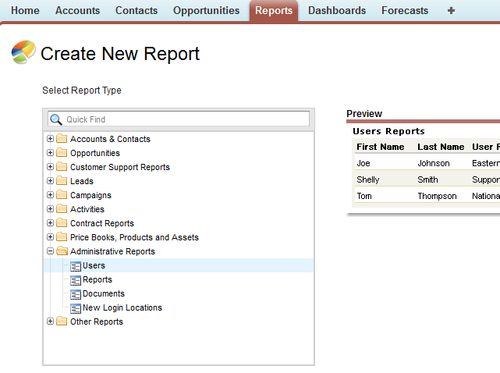
One of the most useful standard reports for system administrators is the Administrator Reports which can be found in the Administrative Reports folder and can be used to analyze your Salesforce users documents, reports, and login locations. For example, you can run reports on the active Salesforce users and see who has been logging in. The following administrative reports are available:
|
Report |
Description |
|---|---|
|
All Active Users report |
Lists the active users in your organization and when they last logged in |
|
Users Logged in This Week report |
Lists all of the users who have logged in to Salesforce in the past seven days |
|
Documents report |
Lists the documents within each document folder |
|
New Login Locations |
List of users, IP addresses, and login dates |
In addition to the standard report types, you can also create custom report types. Custom report types extend the types of reports from which all users in your organization can create or update custom reports.
Custom report types are set up using the following steps:
- Define a Custom Report Type by name, description, primary object, development status, and the category of report to store it.
- Choose the related objects for the custom report type.
- Specify the layout for the resulting standard and custom fields that a report can display when created using the custom report type.
- Create a report from the Custom Report Type to verify that all of the objects and fields definitions are correct.
Once you have created a custom report type, you can later update or delete it as required.
To navigate to the Custom Report Types page, follow the path Your Name | Setup | (App Setup) | Create | Report Types. Now click on New Custom Report Type:
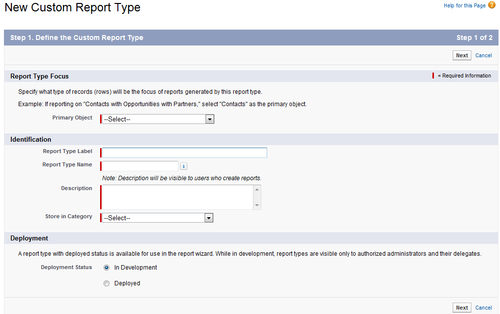
From the Primary Object drop-down list, select the primary object from which you want to build your custom report type.
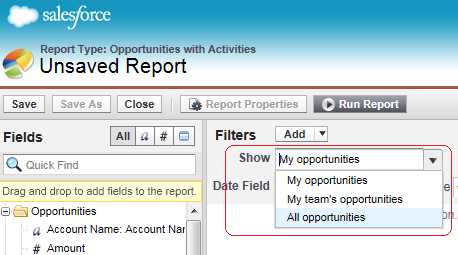
The primary object you choose determines the views available to users creating or running reports from your custom report type. For example, if you select accounts as the primary object for your custom report type, then users can view their report results by All Accounts or My Accounts from the report builder's Show drop-down list.
If you select opportunities, then when users create reports based on that report type, they can view their report results by My opportunities, My teams's opportunities, or All opportunities as shown next:
Now enter the Report Type Label, the Report Type Name field, and enter a description for the custom report type. The description will be visible to users who create reports and is used to help explain the purpose for the Custom Report Type.
Select the category to store the custom report type in and then select a development status. Here, you can select In Development while you are first creating the custom report type to hide it from users while you are defining it. This will hide the Custom Report Type and prevent users from creating and running reports from the report type. Choose Deployed when you are finished defining it and want to let users create and run reports using that custom report type.
Now click on Next and then choose the object relationships that a report can display when run from a custom report type.
In Step 2, after the initial definition for the custom report type, the object relationships can be selected for the custom report type. These object relationships determine the objects and fields available for display on reports. Using diagrams, they help to understand the object relationships formed within the Custom Report Type which will display the data fields whenever reports are created from the Custom Report Type:
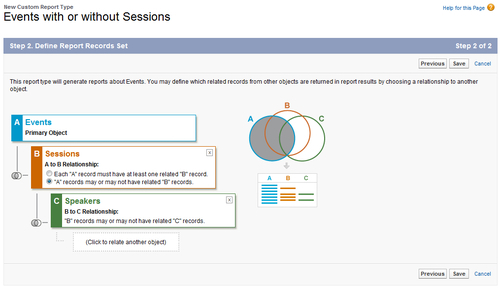
In this Custom Report Type example called Events with or without Sessions, we have object relationships for a custom primary object Event which has relationships with Sessions and Speakers.
To add an object that is associated with another object to the report type, click on the rectangle section (Click to relate another object), then select the object from the picklist.
The objects available for you to choose from are based on the primary object's relationships to other objects.
For example, our custom object Event is set as the primary object for the Custom Report Type so only standard and custom objects associated with Events can be chosen, such as Sessions. This also applies to additional objects added to the Custom Report Type. In our example with Events selected as the primary object, and Sessions selected as the secondary object, then only objects associated with Sessions can be selected as the third object on the Custom Report Type which is our custom object Speakers.
Note
Although up to four object levels can be set up for Custom Report Types, some of the object combinations may not be able to reach that limit. For example, if you add contacts as the primary object, opportunities as the secondary object, and activities as the third object, then you cannot add any additional objects because activities do not have any child object relationships.
Within the diagram, there is the option of setting the first relationship to the primary object with either "A" records may or may not have related "B" records or Each "A" record must have at least one related "B" record.
The following describes the effects of selecting may or may not options.
All subsequent objects automatically include the may-or-may-not association on the custom report type. For example, if accounts are the primary object and opportunities are the secondary object, and you choose that accounts may or may not have opportunities, then any third and fourth level objects included on the Custom Report Type default to may-or-may-not associations.
Blank fields display on report results for object B when object A does not have object B. For example, if a user runs a report on accounts with or without opportunities, then opportunity fields display as blank for accounts without opportunities.
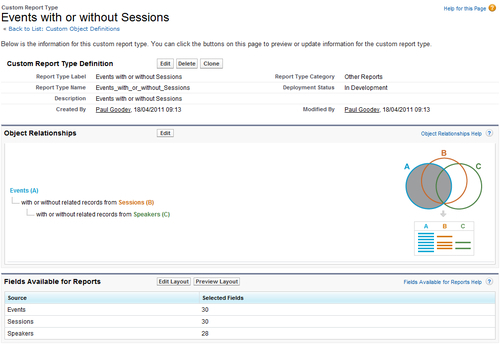
After clicking on Save, the Custom Report Type definition and the object relationships are set:
Now the layout can be edited to specify which standard and custom fields a report can display when created or run from the custom report type.
Clicking on Preview Layout shows which fields will display on the Select Columns page of a report based on this report type.
To start configuring the layout, select fields from the right-hand box and drag them to a section on the left as shown next:
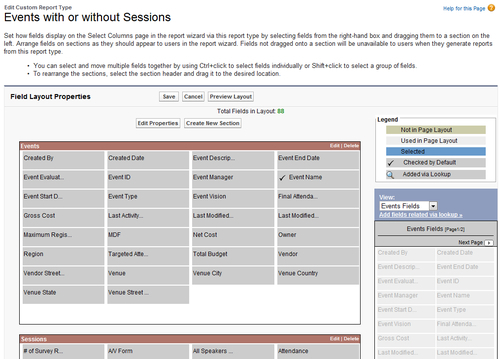
You can view a specific object's fields by selecting an object from the View drop-down list and arrange fields within sections as they should appear to users.
Fields not dragged onto a section will not be seen to users when they create reports using this report type.
To rename or set which fields are selected by default for users, select one or more fields, and click on Edit Properties as shown:
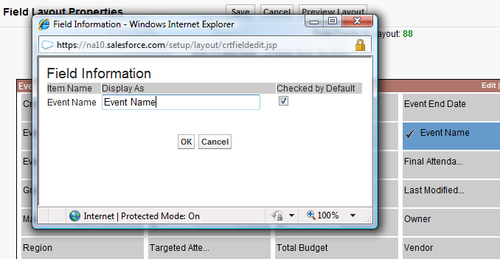
Click on the Checked by Default checkbox next to the field you want selected by default.
Change the text in the Display As field next to the field you want to rename. To rename the sections, click on Edit next to an existing section, or create a new section by clicking on Create New Section. Now click on Save.
The Reports tab presents the reports home page on which users can search for reports and select or create a folder for reports:
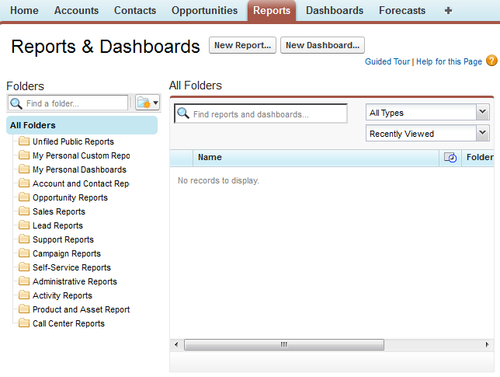
The list of folders (represented by the Folder icon) displays all the report folders that the user has permission to access. Within this section, you can view, edit, and manage all of your organization's public report folders. By clicking on the Reorder Folders option you can change the order that folders appear on the sub-tab.
The section on the right displays the selected report folder and allows users to click on the Actions drop-down which appears as the first column. Here the options are Edit, Delete, and Export.
Choosing the Delete option will remove the report for all users and move it to the Recycle Bin. Here, you are prompted with a warning before the deletion is carried out.
You would need to check that the report is no longer required before doing so as it will be removed for all users, although you would be able to recover it from the Recycle Bin for 30 days if necessary.
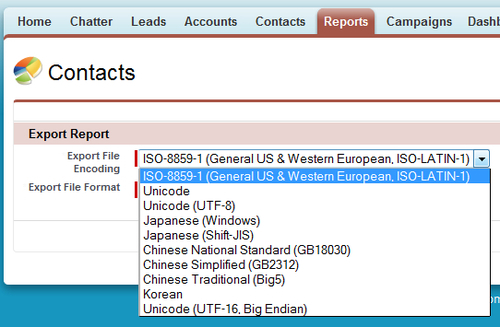
All users can click on Export to export a report directly to an Excel spreadsheet or CSV (comma separated values) file.
To print a report, users can perform the following steps:
- Click on the Printable View button to allow them to open (or save) the report as a printed view.
- Click on the print function:
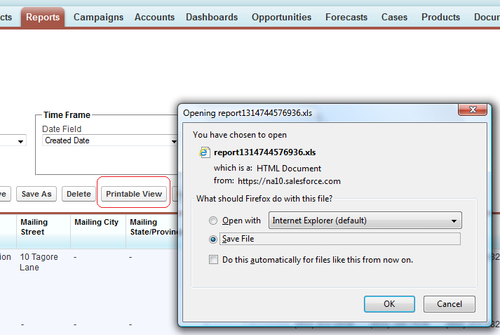
To export a report, users can perform the following steps:
In the browser's File Download dialog, they can then choose where to save the file to on their local or network disk
There are various issues to consider when running reports, whether in Salesforce CRM or any other information system. There are typical limits to the volume of data that can be processed or restrictions to the type of changes that can be made to existing reports. The method of controlling the amount of data that is returned in Salesforce and the effects of changing aspects of existing reports are described next.
If your report returns more than two thousand records, only the first two thousand records are displayed. To see a complete view of your report results, click on Export Details.
Exporting reports to the background enables you to run reports in the background so that you can continue working in Salesforce without waiting for report results to display. Exporting reports to the background allows large reports, which would time out due to the volume of resulting report data.
When the report has finished running and the results are ready for viewing, an e-mail notification is sent by Salesforce. The e-mail contains a link which when clicked enables the viewing of the report information. From this page you can then download the report results in CSV (comma-separated values) format.
For security purposes, user verification can be set up to require users to be tested before exporting data from the Salesforce CRM application. This text data-entry test prevents automated programs from attempting to access the data from within Salesforce. This feature is available on request from Salesforce support.
To pass the test, users must type the two words displayed into a textbox field and submit. Note that the words entered into the text box field must be separated by a space.
Salesforce uses CAPTCHA technology provided by reCaptcha for the user verification testing.
CAPTCHA is an acronym that stands for Completely Automated Public Turing Test To Tell Computers and Humans Apart. It is a computer data entry verification that ensures the entry is carried out by a person. The verification requests the user to complete a small test which the computer creates first and then checks the result. Because only humans are able to solve the test, whenever the correct solution is returned, the computer accepts that it is a request by a person and not from an automated computer program.
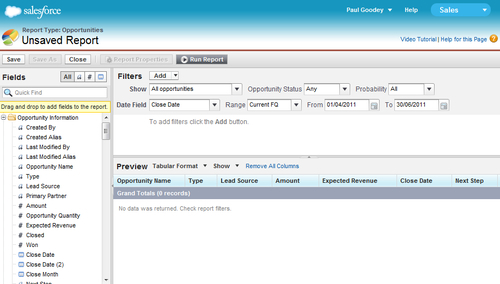
The report builder in Salesforce CRM is a visual editor to enable the creation and modification of reports. The report builder interface uses drag-and-drop functionality to configure reports and the interface consists of the following three sections known as panes:
The following screen shows the report builder page which is presented as a full screen in order to maximize the display of the Fields, Filters, and Preview panes:
To exit from the report builder editor, page click on the Close button at the top-left of the page where you will be prompted to save any unsaved changes.
Looking at each of the panes in detail, we now start with the Fields pane:
The Fields pane is shown on the left side of the report builder page and, as the name suggests, lists all the accessible fields in the selected report type. The list of fields is organized by the sections that were set in the page layout of the associated report type. Here, fields can easily be identified by using the Quick Find search box at the top of the pane. You can also limit the number of fields shown by using the field type filters. In this pane, the fields can be dragged into the Preview pane to add them to the report. Additional calculated fields can be created just for the specific report. These are known as custom summary formulas.
To limit the number of rows of data results that are returned when you run a report, you can either limit your report results by clicking on the Hide Details button at the top of the report or you can add custom filters. To restore the full set of returned data, you would click on the Show Details button.
For tabular reports (only), you can set the maximum number of records to display by clicking on Add Row Limit in the report builder accessed from the Add button in the Filters Pane.
The Filters Pane is displayed at the top-right part of the report builder page and is used to configure the view, the time period, and also any custom filters to limit the data that is actually displayed as part of the report.
Within the Filters pane, you click on the Add box to add report filters as shown:
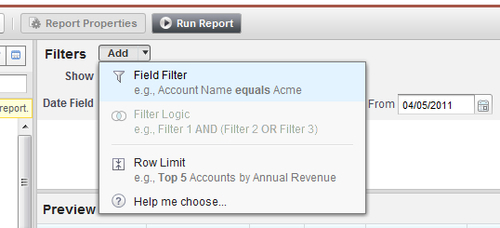
The report filters set the criteria for the the data in a report according to the following:
|
Report filter |
Description |
Notes |
|---|---|---|
|
Field Filter |
Field Filter allows you to set the field, the operator, and the value. |
For example, Account Name equals Acme. |
|
Filter Logic |
Filter Logic adds Boolean conditions to control how field filters are evaluated. |
For example, Filter 1 AND (Filter 2 OR Filter 3) You must add at least one field filter before applying filter logic. |
|
Row Limit |
With a Row Limit, you set the maximum number of rows to display; choose a field to sort by and the sort order. |
Only available for Tabular reports Tabular reports that have a limited row count can be used in dashboards |
The Preview pane is where the report can be customized. You and your users can add, rearrange, and remove columns, summary fields, formulas, and field groupings. When you first enter the report builder, the Preview pane shows an initial result to provide a starting point from which the crafting and fine-tuning of the report results can be done. In the Preview pane, you can also set the required report format which can be either Tabular, Summary, or Matrix.
The preview shows only a limited number of result records. You need to actually run the report in order to see all results.
You can drag and drop report columns to change the order in which they are displayed and, by clicking on the data column header, you can sort your report using that column. Sorting can also be performed by clicking on the column menu and then choosing either the Sort Ascending or the Sort Descending option from the drop-down list.
If a field has been added to the preview pane and is not required, it can be removed by grabbing its column header and dragging it back to the Fields pane. You can also click on the column menu and choose Remove Column, or click on Remove All Columns to clear the Preview pane of all the fields.
Tip
Set the Date Range to All Time
When first creating a report involving dates, the date range may not initially be set appropriately so there will no obvious results returned. By setting the date range to All Time you will most likely see some data returned which can be useful as a quick check to see whether the report is working as intended.
The following three report formats are available in Salesforce CRM: Tabular, Summary, and Matrix. The features and benefits of each format are outlined next:
Tabular reports are the easiest and quickest way to report data. They can be linked to a spreadsheet where they comprise a set of records listed in rows, and fields ordered in columns. Tabular reports are most suited for creating lists of records or a list with a single grand total as they can not be used to group data.
Summary reports are similar to tabular reports except that they allow the grouping of rows of data. They can be used for reports to show subtotals based on the value of a field. Summary reports with no groupings are simply displayed as tabular reports.
Matrix reports are similar to summary reports but also allow the grouping and summarizing of data by both rows and columns and can be used for comparing related totals.
Matrix reports are useful for summarizing large amounts of data to compare values in several different fields or analyzing data by date or by product, person, or region, and so on.
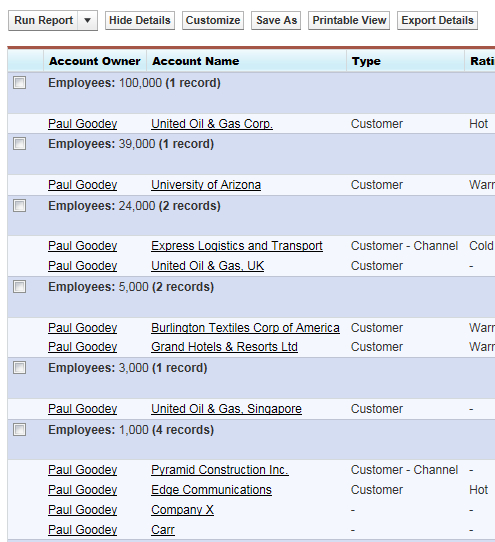
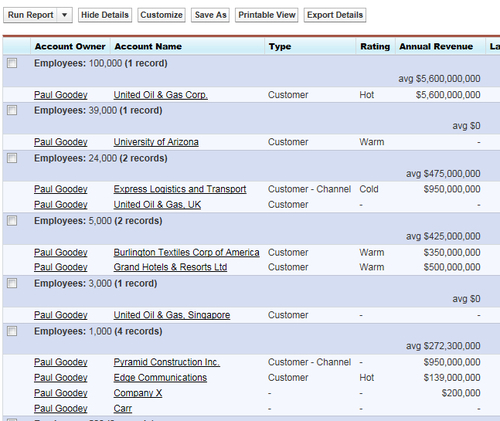
Groupings can be added to summary and matrix reports to group together sections of report data. For example, you might want to group accounts by the number of employees that the account has.
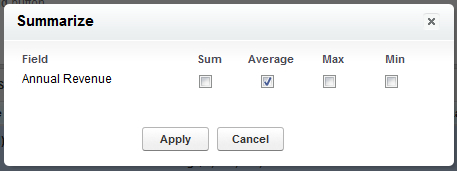
To add a summary field, follow the steps as shown:
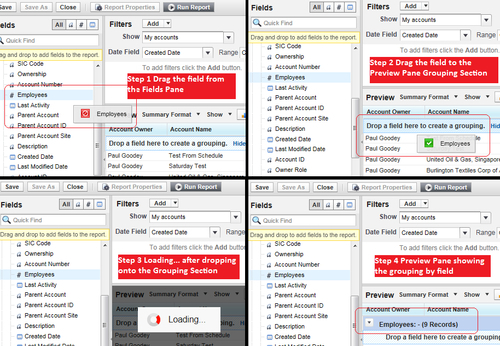
This would produce a report showing the grouped sections as shown:
A summary field is the SUM, AVERAGE, MIN, or MAX for a number or a currency field. Summary fields are displayed at all grouping levels including the grand total level for reports that have been created using the summary and matrix report formats.
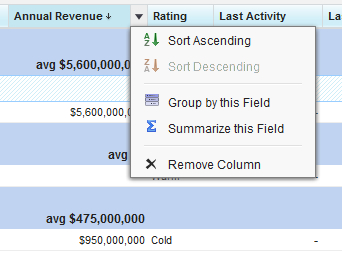
To add a summary field, click on a column drop-down menu section for a field in the report and choose Summarize this Field. You can also use this method to add a grouping by choosing Group by this Field as shown:
Clicking on the Summarize this field button gives you the following options:
This would produce a report result as shown:
Conditional highlighting is a very powerful way to show at a glance whether the values in reports are within acceptable limits. By setting up conditional highlighting, you can specify different colors for different ranges of values in your reports. It is relatively easy to set up and offers great visual benefits and yet is a feature that seems to be underused by users within Salesforce CRM.
To enable conditional highlighting, your report must contain at least one summary field or custom summary formula.
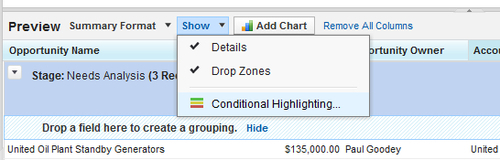
To set up conditional highlighting, click on Show and then Conditional Highlighting as shown from within the Preview pane on the report builder page:
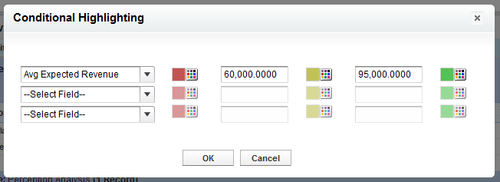
You then have the option to set colors according to whether the value falls below a low breakpoint threshold, above a high breakpoint threshold or a value that sits between these range of values. The following table helps clarify the thresholds and the colors that would be seen given the settings shown in the following screenshot:
|
The color to show data that are below the Low Breakpoint value. |
The threshold value between the Low Color and the Mid Color. Example below: 60,000 |
The color to show data that are between the Low Breakpoint and High Breakpoint values. |
The threshold value between the Mid Color and the High Color. Example below: 95,000 |
The color to show data that are above the High Breakpoint value. |
|
Example below: RED |
Values that are exactly the same as the Low Breakpoint value are shown as the Mid Color. |
Example below: AMBER |
Values that are exactly the same as the High Breakpoint value are shown as the High Color. |
Example below: GREEN |
The settings are as shown:
When running the report the result appears as:
Custom summary formulas allow you to calculate values based on the numeric fields available in the report type. This means you do not have to create custom formula fields for calculated results if they are only relevant in reports.
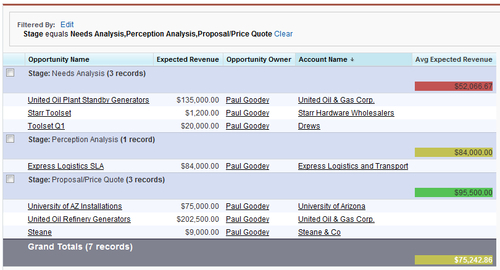
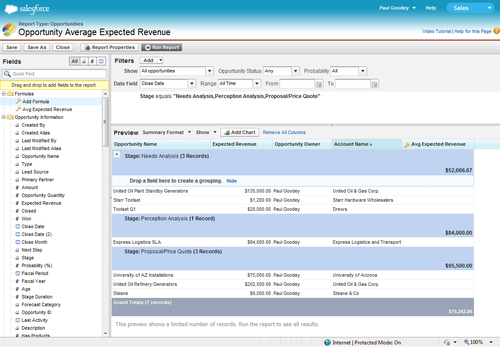
To add a new formula to a summary or matrix report, navigate to the Fields pane where, at the top, you will see the formulas folder icon. By double-clicking on the Add Formula option, you can then define it and then click on OK. After you have defined a new formula on the report it automatically gets added to the preview pane as a column for summary reports and as a summary field for matrix reports. The following shows the formula called Avg Expected Revenue at the top-left of the Fields pane and how it automatically appears in the preview pane as a column (on the far right) for the example the summary report:
To define a formula field, follow these steps:
- Click on Add Formula in the Fields pane:
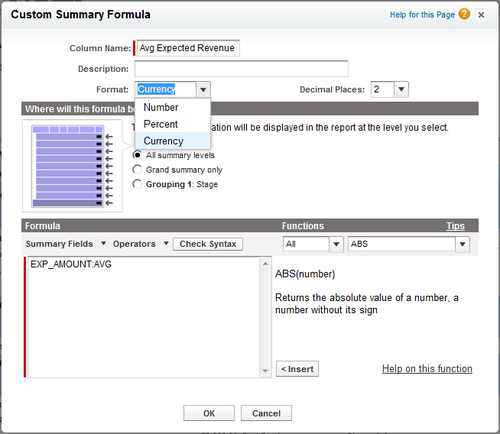
- Enter a column name for the formula; this will be displayed within the report.
- Optionally enter a description.
- Select the data type from the Format picklist.
- Select the number of decimal places from the Decimal Places pick-list.
- Set the option where will this formula be displayed.
The formula calculation will be displayed in the report at the level that is selected.
- Now build the formula by selecting one of the fields listed in the Summary Fields picklist and then select the summary type:
Summary type
Description
Sum
The sum of data in a field or grouping of fields
Largest Value
The largest value of data in a field or grouping of fields
Smallest Value
The smallest value of data in a field or grouping of fields
Average
The average of data in a field or grouping of fields
- Now click on Operators to add operators to the formula.
- Select the function category, choose the function you want to use in your formula, and click on Insert.
- Now click on Check Syntax to check that the formula contains no errors and then click on OK.
Tip
Hide Details when building new reports
Often when building new reports you will not necessary know just how many records are actually going to be returned; this can be the reason for the report in the first place. You may also be experimenting with the report format to see which data are being returned. In these cases, you should set the Hide Details option to prevent the detailed data being returned and show just the "skeleton" of the report which shows the number of rows that will be returned. Limiting rows on a tabular report allows you to use it as a source report for dashboard table and chart components. However, if you change the report format, the Row Limit setting is automatically removed.
Sometimes it is necessary to change the report formats for the existing reports; the effects of changing the report format are as follows:
|
Report format change |
Effects of change |
|---|---|
|
Change from Tabular to either Summary or Matrix |
The Rows to Display filter is not applicable for Summary or Matrix reports, and is removed. |
|
Change from Summary or Matrix to Tabular reports |
Groupings are not applicable for Tabular reports and are removed from the report. The fields used for grouping are removed and not converted to columns in the tabular report. |
|
Change from Summary report to Matrix report |
The Summary first grouping is used as the first Matrix row grouping. The second summary grouping is used as the first column grouping. The third summary grouping is used as the second row grouping. Note: When using the report wizard, the third summary grouping is automatically removed. |
|
Change from Matrix report to Summary report |
The Matrix first row grouping becomes the first summary grouping. The second row grouping becomes the third summary grouping. The first column grouping becomes the second summary grouping. The Matrix second column grouping is removed. Note: When using the report wizard, both the second row grouping and second column grouping are removed. |