
Emerging Wide-Area Power Applications with Mission-Critical Data Delivery Requirements |
|
CONTENTS
3.6 Transient Instability Mitigation
Our electric power system plays a critical role in present-day society. The many benefits of electricity include its versatility, reliability, safety, and low cost. In terms of versatility, when new sources of energy such as wind or solar are considered, the best method to transmit their power to consumers is by converting it to electricity. Other transmission options, for example, generating a hydrogen gas intermediate, are significantly more complicated and expensive to implement. In terms of reliability and economics, the interconnected electric power system has demonstrated exceptional robustness over many decades of operation and with very low cost. Worldwide, electric power is responsible for delivering approximately one-third of overall requirements, and the percentage of total power consumption in the form of electricity is growing due to trends in the electrification of automobile transportation and increases in the computing and communication infrastructure [1].
Because of its importance to society, there is a continuous need to improve the reliability and economics of electric power. Key to this is maintaining correct operation during challenging events, including equipment failure, electrical faults, and any weather-induced variability affecting renewable generation sources. Hierarchies of protection and control, starting at a local distributed level and extending to a wide-area centralized level, are applied to keep the system operating in acceptable ranges during times of stress. At the local level, devices for equipment protection are deployed to quickly disconnect devices that develop a fault. This isolates failures and prevents disturbance spreading. When the fault is temporary, protection devices reclose the line back into service. This keeps the system strong against future disturbances. Equipment protection primarily utilizes local signals to make decisions. Recently, there is a move toward building systems that communicate between neighboring devices in a distributed manner to aid selectivity, security, and dependability. At the top, most centralized level, human operators monitor and control the system centrally. They receive signals that are communicated over a wide geographical area. Between the local and top levels of observation, a variety of distributed control systems are applied for responding to situations that require wide-area information but must operate with intervals that are too short for a human to process and make a good decision [2].
Modern electric power systems are designed to connect generators and consumers of power over large distances. This creates a unique engineering challenge for reliable operation, because of the communication demands that result when state measurements need to be shared with mission-critical applications for proper control and operation. The electric power system, or a specified subset, can span hundreds or even thousands of miles. Measuring, transmitting, and verifying measurements collected over these long distances require a sophisticated communication infrastructure. The distances involved are particularly challenging for control of electric power systems. Most other control systems, such as cell phone receivers or automobile engine regulators, are packaged within relatively small spaces. Communication within these systems is fast. Long-distance communication networks can result in long latencies, difficulty in aligning measurements, and unreliability in reception quality. Control systems are particularly sensitive to these impacts.
Historically, engineers have overcome the challenge of geographic distance for power system measurements by only measuring quantities that change slowly. Both the voltage magnitude and injected power in a transmission system vary slightly over an interval of several seconds. This allows for larger communication delays and simplifies aligning the measurements in time. Limiting measurements to those that change slowly is acceptable for many applications, but, in general, it is a problem because the state of the power system consists not only of the magnitude but also the phase angle. Phase angles change rapidly. Furthermore, depending on the type of control required, the required measurements can also include topology, synchronous machine rotor angle, and even the internal conditions of governors, voltage regulators, and other local control devices.
In the past, and in many systems even today, the fast-changing phase angle is estimated at rates as slow as every minute, and is treated on a relative basis. In addition to providing angle values, estimators calculate missing data from physical locations where direct measurement is impractical or for cases when communication system issues lead to data interruption. These estimators also improve the accuracy of measurements. State estimation was previously based on a nonlinear method, driven by the need to derive angles from power measurements [3]. Because of its nonlinearity, the traditional state estimation is computationally expensive and can sometimes fail to converge. This leads to intervals when critical data are unavailable, not because of communication failures but because of algorithmic limitations. Convergence problems have become a larger issue recently because renewables result in a violation of the assumption that the power system is changing slowly. Good estimates are needed even during times of fast dynamics.
Over the past several decades, a new measurement approach has evolved. A shared, high-accuracy time source enables measuring devices to precisely timestamp signals before transmitting them over a communication network. One common method of receiving this accurate time is from the global positioning system (GPS). When measurements are the network voltage and current related states, they are called synchrophasors [4]. More recently, this measurement approach has also been applied to rotor angles and other connected machine and device internal states [5]. The time-stamped measurement technology has unlocked new ways to control electric power, increase its reliability, and decrease its cost.
Time-synchronized systems now directly measure voltage and current phase angles. This enables the application of a linear calculation for filling in missing values [6]. The linear calculation does not have convergence issues. All values, whether directly measured or calculated, are available during times of both slow and fast system dynamics. Also, with these measurements simple applications become possible, such as a text-based meter command at the measuring devices to help an engineer determine whether line phases have been swapped [7]. Direct measurements also provide the means for independent topology checking at the substation level [8] and enable the state estimation to be distributed [9], which results in a more reliable system.
This chapter overviews new or significantly improved power system applications that are now possible due to wide-area time-synchronized measurements. The emphasis is on those applications with mission-critical delivery requirements. The ability to communicate information over large distances and meet quality of service constraints is facilitated by the advanced communication systems and distributed computing architectures covered in other chapters of this book.
Applications are divided into five categories: system analysis, situational awareness, stability assessment, wide-area control, and system protection. Each area is surveyed to explain emerging applications and research directions. For wide-area control, one of the most dynamically advancing fields due to these new measurement techniques, a specific application is explained in full detail. Common data delivery requirements for each category are summarized, and special focus is given to interaction with the communication subsystem. In general, the categories are listed in order of increasing performance requirements. These requirements then become the basis for communication infrastructure design and analysis, as described in Chapter 4.
Wide-area time-synchronized measurements provide a new tool for power system analysis. Figure 3.1 shows an architecture suitable for collecting this information, acting as a total system data recorder. Buses are labeled 1, 2,…, N, each representing a separate substation. At each substation a phasor data concentrator (PDC) buffers the measurements [10]. The purpose of the PDC is to provide an intermediate storage location at the substation, which is accessed in the case of interrupted communication to the central data recording device. The PDC also provides an additional security layer between the substation and the external communication network. Layered security is an important strategy for achieving overall system resilience against cyberattacks. In some implementations the PDC time-aligns the measurements and then sends all measurements for a given time instant together as a single communicated entity. While phasor data concentrator is a common term in North America, others might refer to this intermediate communication and computation device by another name, and additional capabilities and features are possible with more complicated data delivery architectures. However, the term phasor data concentrator is retained here because of its common usage in the industry.

FIGURE 3.1 Data collection architecture.
One application of the collected data is fault recording. The electric power system is very reliable and major events are fortunately rare. However, when an event occurs, getting to the root cause is important. Also, although minor events are common and have little impact on power system customers, gaining information from minor disturbances helps improve the system and avoids major disturbances. Time-synchronized measurements enable event reports to be combined into a single view of what happened and how the disturbance evolved over a wide area. Measurements are received from a variety of devices, such as digital fault recorders, protective relays, and automation controllers, and are then communicated through the PDC to a centralized location, as shown in Figure 3.1. These measurements might be sampled at different rates, but with high-accuracy time stamps it is simple to combine them into a single time base.
Another application of these archived data is model verification [11,12]. Good models are the prerequisite for effective power system planning and it is important to validate models against measured data to verify their accuracy. Time-synchronized measurements provide a way to combine data from various parts of the electric power system and apply this information to test models [13]. Often, these data are from relatively small events, such as the frequency response of the system after a generator trips. Also, when load tap-changing transformers make a step change, the time-stamped measurements help identify load characteristics. Because these new time-synchronized systems directly measure voltage and current angles, they provide a baseline state when the system is in the normal operating range. This enables power flow models to be verified.
With respect to the communication system and data delivery requirements, collecting events puts almost no restriction on latency. Receiving the complete set of events with as much as a minute of delay is acceptable. This means that, if the overall communication is interrupted, it is possible to retrieve data buffered at the PDC at a later time, after the communication system has been restored. However, a high sample rate is required and the volume of data is large. Present systems sample as fast as 60 times per second, but in the near future sample rates on the order of 240 samples per second will become common. Higher sample rates are important for capturing and analyzing details of the power system’s response to disturbances.
Operators continuously monitor the electric power system to help maintain reliability. Existing situational awareness is built on the supervisory control and data acquisition (SCADA) architecture, which is an asynchronously scanned system with update rates on the order of seconds. Slowly changing voltage magnitude and power flow measurements are adequately represented with this architecture. However, when the power system changes rapidly, as is becoming more common with the increase in wind and solar renewable energy sources, then these measurements become suspect during transients. Over the scan interval there are no guarantees that the measurements are acquired at the same time, and this causes problems. For example, consider the case of power measurements on parallel lines and the need to know the total power flow. This is necessary for assessing the stability of the Guatemalan power system [14]. During fast dynamics, the power on each line can transition from nominal levels to levels requiring action in seconds. With a multisecond SCADA update rate, it is not possible to correctly calculate the total power at a 1 s interval. A solution through the application of time-synchronized measurements is described later in this chapter. Also, SCADA displays cannot effectively show phase angles and fast-changing machine state values because of the asynchronous scan.
New time-synchronized systems update as frequently as 60 times per second. All measurements are taken at a common time instant. The angles are directly measured and displayed. Operators obtain a more detailed understanding of the system state [15,16,17,18,19]. Additionally, these details improve the ability of alarming and event notification applications to provide information based on sophisticated assessments [20].
The important benefits of the new information include increasing the confidence of operators. They know that they are seeing the exact power system conditions in real time. For example, if a line is taken out of service, the steady state as well as the transient result on the voltage and current level is immediately visible. If the system exhibits any undesirable characteristics, such as sudden oscillations, the operator sees them immediately and can take action. As another benefit, standing line angles across disconnected lines are directly measured. The lack of these measurements has posed problems historically. This was a contributor to the Southern California outage in September 2011 [21]. A line was open and the adjusted power flows resulted in a large angle developing. The operators could not always see this angle and take the actions to get this line back into service quickly. With time-stamped information the phase angle across each line is directly measured and displayed.
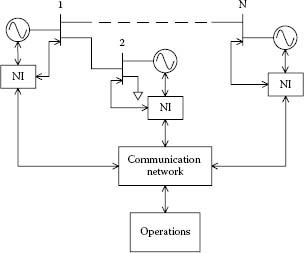
FIGURE 3.2 A representative situational awareness architecture.
Figure 3.2 shows an architecture suitable for situational awareness and also operational control. In contrast to Figure 3.1, communication paths are bidirectional because of the need for operators to issue control actions. These might include opening a breaker or redispatching generation power. The PDC is replaced with a network interface. There is no need for a significant amount of intermediate data buffering because data are needed as fast as they are generated. Going back at a later time to retrieve data after a network outage provides little benefit. Communication requirements for operator displays are driven by the need for near real-time streaming data. Some amount of latency is tolerated because humans have a limit on their ability to respond. Latency on the order of seconds is acceptable. However, the update rate should remain on the order of 30–60 samples per second because this can show higher frequency oscillations and other detailed information of interest.
Assessing the electrical security of a power system is always an important need. These assessments relate to several classes of possible instability: voltage, frequency, transient [22], and oscillatory. With high-rate, streaming, time-synchronized measurements, the accuracy and prediction power of security assessments are improved [23,24,25]. For example, SCADA systems, with asynchronous update rates, do not allow fixed-rate signal processing applications. With the new time-synchronized systems and direct state measurement, the assessment algorithms can use well-known filtering and frequency-domain processing algorithms.
For voltage stability assessment, as an example, a simple method is the calculation of stability indices based on reactive power measurements [26]. The voltage stability index is based on the difference between the maximum value that the system can support and the present value.
(3.1) |
The reactive power Qmeasured is collected at each bus at time instant ti Then, the inductive loading at each bus is incremented by a real-time simulation until the system becomes unstable. This is the estimated value Qcollapse. The difference is the reactive power margin at that time. When QVmargin crosses a defined threshold, the system is assessed as becoming unable to handle the reactive power demands. It is important that all measurements are taken at the same time to improve accuracy and to ensure that measurement artifacts are not causing artificial convergence issues. More sophisticated methods utilizing time-synchronized measurements have also been developed [27,28]. Once a system is assessed as becoming unstable, the information is provided to the operators, who can then adjust reactive power or generation dispatch to alleviate the situation.
A wide range of diverse applications fall under the category of wide-area control. They are either distributed and automated or centralized and operator initiated. All of these control applications are based on a directly measured time-synchronized system state. This section overviews several of these applications and then examines in detail an emerging model-based approach suitable to mitigate transient instability.
An example of a distributed automatic application is collecting voltage measurements to increase the control coordination optimality of a set of static var compensators (SVC). The SVC is a reactive power device that acts in a fast manner to improve the voltage profile of the power system. These devices monitor voltages locally and inject reactive power to keep that local voltage stable and within preset ranges. Using the streaming nature of time-synchronized measurements, there are systems in service that also receive more distant measurements and make control adjustments that not only correct for local variations but also hold voltages at remote locations within proper boundaries [29].
Another wide-area control application is interarea oscillation damping [30,31,32]. These oscillations are driven by rotating machine controls interacting with each other through the electrical coupling of the power system. Again, using the streaming nature of time-synchronized measurements results in a system in which remote oscillations are measured and then corrected at the point of initiation.
Islanding control for distributed generation is a challenging problem that has benefited from direct state measurements. Present standards require distributed generators to stop producing power when their region is disconnected from the main power system [33]. A key challenge is detecting this disconnected state. Currently, many systems make this assessment through measurement of breaker status. When prespecified breakers indicate that they have opened, a controller determines that the distributed generation site has islanded and sends disconnection commands. The problem with this approach is its complexity. Power systems can consist of many possible connection arrangements, so the controller must track all of them in determining the islanded state. Also, when connections are reconfigured it is required that the controller be reconfigured to reflect this new arrangement. Another approach is for each distributed generator to continuously push its synthesized frequency against the bulk power system received frequency. The connected bulk power system is much stronger than the distributed generator, so when the local system is not islanded the attempted frequency perturbation is unsuccessful. When the system islands, the frequency rapidly changes and this indicates the islanded condition. The problem with this approach is coordinating the various frequency forces.
In contrast to these existing methods, the comparison of measurements across a point of interconnection has both simplified the problem and resulted in more reliable controllers [34,35]. Time-stamped measurements allow the direct comparison of the phase angle at various points of the power system. When the region containing distributed generation goes into an islanded condition, the phase angle differences, along with their rate of change, provide a strong indication of islanding. The controller then sends appropriate commands for disconnection of the distributed generators. In the future, this same scheme will allow control over the real and reactive power output of distributed generators in response to instantaneous power system conditions. So, as utilities install the more advanced time-stamped schemes to meet present interconnection requirements, these same systems become ready for more advanced applications.
It is required that communication of data for automatic wide-area control is fast and reliable. These applications tend to be closed loop, and latency directly affects the performance and stability of the loop. Latency must be low. Specific values are quantified at the end of this chapter.
The precise time nature of the modern power system enables accurate timing not only of measurements, but also of control actions. Consider, for example, the scenario of an operator removing a line from service. First, commands are sent to open the breaker on each side of the line. The result is that the voltage decreases because of a higher effective impedance. Local tap-changing transformers and SVCs automatically adjust to correct the voltage. Meanwhile, the operator can switch manually operated reactive power devices, such as shunt capacitors, into service. There is a significant time delay between automatic local controls and operator-initiated controls. As a result, the system voltage and power flows experience transients. Once an operator has put shunt capacitors into service, the local control devices react to return more closely to their original state. The various signal level changes add variability to the power system, which is already experiencing larger signal swings due to renewable generation. As control devices respond to varying voltage levels, this adds stress and reduces their life span.
Operators can now generate recipe lists of commands, each with an associated time stamp [36], and execute all required changes simultaneously. These lists are distributed to the various control actuation points in the system. When a certain operation is required, for example, removing a line from service, the collection of distributed recipes all execute in lockstep. This prevents transients and reduces system stress.
Other operator control applications include black-starting generators and monitoring line angles prior to reinserting a line into service. In these applications it is primarily the measured angles that provide the needed capability. Operator-assisted controls tend to have less strict communication requirements than the feedback controls. For example, with recipes, it is possible to send the commands seconds, minutes, or even hours ahead of the control execution time. This allows for feedback testing to ensure that the requested commands are validated, thus increasing the cybersecurity of the system.
3.6 TRANSIENT INSTABILITY MITIGATION
The electric system interconnects large synchronous machines that provide the bulk of generated power. During normal operation, the rotors of these machines operate in coordination and maintain slowly varying angle differences. However, during large contingencies it is possible for power imbalances to disturb the rotor angle relationships beyond the capability of restoring forces. In these cases a set of machines can swing out of step with each other. This condition is called transient instability. A typical initiating condition is a fault that significantly unloads a section of the system, which causes the affected machines to accelerate past the point of stability. Modern, fast power system protection has provided significant resilience against this problem [37]. However, there are still cases in which transient instability can develop. These are often high-order contingencies in which multiple lines are lost, often in conjunction with the loss of primary protection and the resulting delay of backup protection causing longer fault duration; they cannot adapt to the present conditions.
System integrity protection schemes, also called remedial action schemes, can provide a certain level of resiliency against transient instability. However, they are limited to the specific conditions studied and must be configured for these cases in advance of the disturbance. With time-stamped measurements it is now possible to build feedback control schemes that measure a wide-area collection of power system states and respond to a much larger range of contingency cases than is currently possible. A specific example that demonstrates these ideas in detail is presented next.
Figure 3.3 shows a block diagram of the controller, focusing on three buses out of the larger power system. Each device controller (DC) takes measurements of the network state and, when connected to a generator bus, the machine state. The network state consists of time-stamped voltage and current measurements at each bus in the power system. Buses range over j = 1, …, N. The machine state consists of the rotor angle θi[k], rotor field excitation Efd,i[k], and prime mover power Pm,i[k]. Machines range over i = 1, …, M. The index k represents the time stamp. For transient stability control a suitable measurement sample rate is fnom, meaning that the time stamps are incremented at an interval of T = 1/fnom. This is the rate at which data are transmitted over the communication network to the controller. Although currently not all installed systems are able to acquire such detailed machine measurements, this technology is becoming more viable. Time-stamped rotor measurements are included in the appendix of the latest Institute of Electrical and Electronics Engineers (IEEE) C37.118 standard [38] and are implemented today in some advanced controllers [39]. Furthermore, time-stamped measurements of the additional synchronous machine state values are under investigation [40].
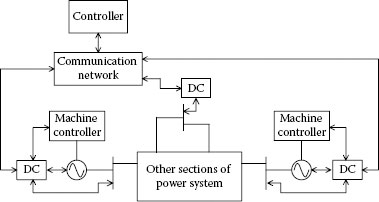
FIGURE 3.3 Architecture for mitigation of transient instability.
The controller monitors the power system dynamics and determines the need for control actions. For transient instability correction, the control actions selected here consist of tripping generation, shedding load, or inserting series compensation on select lines. Other control actions are possible.
Time-stamped received signals are processed and controls are selected through the methodology of model-driven assessment and performance metric measures [41,42]. The electric power system is nonlinear by nature. This makes controller designs particularly challenging. Although linearization or model-free approaches are possible, the strong nonlinearities that characterize rotor angle–related instability make a model-based controller attractive. Figure 3.4 shows the basics of operation. At time tF the power system experiences a large contingency that, for example, involves faults on multiple lines. Local protection devices clear these faults at time tT. Subsequently, it is the task of the controller to determine whether the state trajectories are evolving toward stability and whether control actions are required. If control actions are required, then it is the task of the controller to select an appropriate control and send it to the appropriate DC. These tasks are performed by predicting the state trajectories according to a model of the power system. The initial state is from the measured time-stamped state values. Then, for each control option, the state trajectories are predicted. A cost measure is applied to the resulting trajectories. The first control action for the sequence of control actions that results in a minimal cost is selected for application. Because the option of not applying any controls is included in the considered list, the algorithm inherently assesses stability. When the system is not evolving toward instability the controller takes no action.

FIGURE 3.4 Basic operation of a model-based controller with prediction.
The cost measures consist of both the state cost, Cstate, and the control cost, Ccontrol. Each is calculated individually based on the received state measurements and a prediction of the future state. The total cost is the product of these two individual costs.
(3.2) |
The state cost Cstate is the summation of the individual cost for three classes of states. These are the rotor angle Cθ, frequency Cω, and bus voltage magnitude CV.
(3.3) |
Individual state costs in turn are calculated as follows. Equation 3.4 provides the cost measure for the rotor angle, following a mean-square formulation. The center of inertia angle where Hi is the inertia for machine i, at time kT is compared against the average of the center of inertia angle over window W. This difference is normalized by the maximum expected angle, π, and then squared. The duration of the prediction window is WT seconds. The resulting cost measure for the rotor angle of machine i is defined as C′θ (i). A large value of C′θ (i) indicates that the rotor angle state for machine has deviated significantly from a possible stable path.
(3.4) |
The total cost for all of the rotor angles in the complete power system is the summation of the individual machine rotor angle costs.
(3.5) |
For frequency, the rate of change of the rotor angle ωi[k] is compared with the nominal frequency ωnom and normalized by a frequency limit, ωlimit. This quantity is then summed over the prediction window.
(3.6) |
The total cost of the frequency for all machines is the summation of the individual machine frequency costs.
(3.7) |
The final state-related cost measure is based on the voltage magnitude, computed for each of the N network buses. The voltage is compared with the predisturbance equilibrium voltage for that bus. The difference is divided by the reference voltage, squared, and then summed over the prediction window.
(3.8) |
The total cost of the voltage magnitude is the summation of individual bus voltage costs, normalized by the ratio between the number of bus voltages and the number of machines in the system.
(3.9) |
While the state costs are calculated with a mean-square approach, the control costs, Ccontrol, are taken from tabulated values. The total control cost is then a summation of the individual control actions, taken sequentially over the prediction window. In Equation 3.10, the number of controls considered over the prediction window is W′.
(3.10) |
Table 3.1 provides an example cost allocation for control actions. The table approach allows the selection of each value based on the individual needs of the application. In Table 3.1, two sets of costs are provided. When the cost (Equation 3.3) for the case without application of control is below a specified threshold, then all tested controls use the values in the second column of Table 3.1. When the cost (Equation 3.3) is above this threshold, then the system is estimated as becoming unstable and the tested controls in the third column are applied. In either case, the final selected control set is based on the sequence that minimizes (Equation 3.2), independently of whether the cost table selection is based on a stable or an unstable threshold check.
Structural Change Control Action |
Base Case is Modeled Stable |
Base Case is Modeled Unstable |
No control action |
1 |
4 |
Series capacitance |
2 |
1 |
Load shedding |
4 |
3 |
Generator tripping |
3 |
2 |
The capability of this controller is demonstrated with the IEEE 39-bus system. Figure 3.5 shows the system response to an example of three lines simultaneously faulted. The upper left signals are the phase angles of each generator referenced to the center of inertia angle. The lower left signals are the frequency values, referenced to the nominal frequency. The right of the figure shows the voltage magnitudes for all 39 buses.
Assume that the fault is cleared by backup protection with a long clearing time. The probability of losing three lines is very low. However, it is these low-probability events that can lead to large cascading outages. An advantage of applying time-stamped measurements with wide-area control in a feedback architecture is the ability to respond effectively to both common and rare system events.
Figure 3.6 shows the system response after correction by the controller. The controller receives time-synchronized measurements, estimates the response against a model for a set of control options, and then selects the control that minimizes that total cost. The result is that the controller selects tripping a generator 100 ms after the fault is cleared, then inserting series capacitance 200 ms after the fault is cleared, and finally shedding some load 300 ms after the fault is cleared. The advantage of this method is that controls are selected based on minimizing a combined cost of state trajectory deviation and control action costs. This helps to find a solution that minimizes the negative effect of the controls while simultaneously stabilizing the system.

FIGURE 3.5 Unstable response of the 39-bus system to a three-line outage.

FIGURE 3.6 Stable response after control application.
Automated control for resolving transient instability requires a very reliable communication network. As seen in Figure 3.3, measurements are collected and controls are sent over a wide area. Latency on the order of less than 10 ms is required for this application. This allows time for measurement filtering and control selection such that the first control action can take place only 100 ms after the initiating event.
The most demanding application in terms of communication requirements is system protection. Time-synchronized measurements can now be found in line-current differential and distributed bus differential protection schemes [43]. For wide-area protection, new approaches to transient stability [44,45] and voltage control [46] have become available.
A detailed example is the correction of oscillations using time-stamped measurements [14]. In Central America, a 230 kV transmission network connects from Mexico through Guatemala and south to Panama. The Central American system capacity is approximately 7 GW, which is significantly smaller than the power system in Mexico. Historically, oscillations in the Central American system have required disconnection from the Mexican system during certain intervals of the day. This negatively impacted the reliability and economics of the Guatemalan system. The wholesale operator of Guatemala, the Administrador del Mercado Mayorista (AMM), decided to implement a system that could detect these oscillations and proactively disconnect lines. This eliminates the need to isolate based on time of day and, instead, acts only when necessary. Thus, a measurement-based control system is in place instead of predefined table lookup actions.
What has prevented such a scheme in the past is the lack of time-synchronized measurements. There are two factors involved. First, it is necessary to measure the power flow on two separate lines in order to determine the state of the power flow. While SCADA systems can measure and sum power when slowly varying, as is the case during normal operation, they cannot provide accurate results during fast changes. It is precisely during these fast changes that the measurements are required. Second, a fixed-interval sampling scheme is required for estimating oscillation modes.
Figure 3.7 shows a block diagram of the system. The time-stamped voltage and current at each important line are measured with a phasor measurement unit (PMU). A PMU is a type of device that makes time-synchronized measurements and conforms to the IEEE C37.118 standard. This standard includes requirements on filtering, measurement accuracy, and communication frame layout. In the Guatemalan system, the PMU is included as part of a protective relay. The advantage of including a PMU internal to the relay is the availability of the control function necessary to act based on the oscillation state. Each PMU is connected to a clock. The clock receives a GPS signal, extracts the time component, and sends it to the PMU. The result is that all measurements are based on a common, highly accurate time reference.
The voltages and currents are measured at a rate of 60 per second. They are then streamed over an Ethernet connection to the AMM control center and received by a synchrophasor vector processor (SVP), an advanced PDC. The lower section of Figure 3.7 shows the SVP algorithm in detail. Starting with the block on the left, first the measurements are time aligned. This is possible because of their precise time stamp, which is included with each measurement.

FIGURE 3.7 Block diagram of protection system.
The control device includes an IEEE 61131 logic engine. With this capability, the power on each line is calculated from the received voltages and currents. Each calculation is at a specific time instant.
(3.11) |
The resulting power values for specified lines are summed in order to determine the total flow in the system. These are compared with a threshold. The power values are also sent to a modal analysis engine that computes the oscillatory mode frequency, amplitude, and damping. When an oscillation is detected with negative damping, and it persists in the system for a sufficient duration, the control selection logic determines an isolation command. This is sent back through the network to open the appropriate breaker.
Local protection that shares time-synchronized measurements for applications such as line-current differential schemes must act with latencies on the order of power system cycles, which are tens of milliseconds. For wide-area protection and control the allowed latencies may be slower because the instability evolves over periods from 100 ms, for transient stability, to seconds, for voltage stability or oscillatory stability.
Table 3.2 presents communication requirements in a quantitative form with scaling to indicate the level of difficulty on a range of 1–5 [47]. Included in Table 3.2 are values of the following data delivery requirements: required latency, required rate, the criticality level, the quantity of data that is delivered, and the geographical area over which the data travel. No applications with less than a high level of criticality are considered in this chapter. Table 3.3 quantifies each of the previously described applications based on the ranges shown in Table 3.2. These data delivery requirements are referenced in Chapter 4.
For system analysis an input latency on the order of seconds or longer is acceptable because these are off-line applications. The data rate requirement, however, is high because resolution is important when investigating system behavior. The criticality of the data is moderately important. Of course, it is never good to lose data, but for off-line applications the impact is mitigated by the possibility of collecting the data at another time. The quantity of the data can be high and data are often collected over wide geographical areas. There are no output requirements for analysis.
Situational awareness requires less latency than system analysis, but the effect of human operators in the loop limits the benefit of latencies that are below approximately 1 s. The required data rate is moderate. Rates of up to 60 messages per second are useful, but higher rates probably provide detail that an operator is unable to fully utilize when monitoring the power system in real time. The criticality level of the information received by operators is high. A fairly large quantity of data is received, and over a wide area. The quantity of data is limited by human factors and above a certain point it becomes difficult to effectively utilize a large amount of data. Too much information for an operator, especially during times when rapid response is required, can make assessing and responding to the situation more difficult.
TABLE 3.2
Normalized values of Parameters
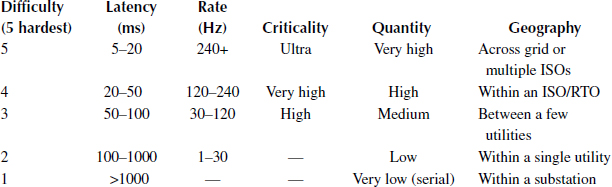
Note: ISO, independent system operator; RTO, regional transmission organization.
TABLE 3.3
Diversity of Data Delivery of Selected Power Applications

The output communication requirements for situational awareness are constrained by the fact that these commands are issued by human operators. Therefore, the tolerated latency is relatively high. The data rate aspect of the output is not relevant. Operators issue single commands, not streaming instructions. Operator commands are critical. The data quantity of the output commands is low. The geographical coverage of the commands is the same as for input data.
For stability assessment, requirements are fairly similar to those of the situational awareness application. However, the latency is stricter and the data rate is higher because often the initial consumer of the data is a computer algorithm, which is able to process a more detailed information level than is possible for a human. There are no output requirements because it is assumed that an operator acts based on the output of the assessment. These output requirements are covered under the situational awareness column. However, stability assessment is also an intermediate stage of wide-area control and system protection. In these cases, the assessment requirements are part of the data delivery requirements for those applications.
It is important that wide-area control latency is low because latency negatively impacts the stability of feedback control loops. Similarly, the rate is fairly fast. All control schemes are critical for correct power system operation, and this necessitates not only a reliable communication network but also a distributed architecture when possible. The quantity of data is large, but typically not as large as required for system analysis or situational awareness. This is because control schemes often only require a few signals, such as positive sequence voltage or positive sequence current. The geographical span of the data is dependent on the specifics of each control application and can range from every location within a substation all the way up to an entire power system grid. The output data for control also require low latency and fairly high rates. Like the received measurements, output commands have a critical reliability need.
System protection places the most demanding requirements on latency, data rate, and criticality of the application. The quantity of data may be lower because typically only a few key signals are monitored. The geographic scale can cover a wide area but is also limited by the required latency and reliability. Output signals for protection are single acting, and this is why there is no specification for rate. However, a low latency is required.
1. Annual Energy Outlook 2013, with Projections to 2040, US Energy Information Administration, 2013.
2. V. Madani, D. Novosel, S. Horowitz, M. Adamiak, J. Amantegui, D. Karlsson, S. Imai, and A. Apostolov, IEEE PSRC report on global industry experiences with system integrity protection schemes (SIPS), IEEE Transactions on Power Delivery, 25(4), 2143–2155, 2010.
3. F. C. Schweppe and J. Wildes, Power system static-state estimation, part I: Exact model, IEEE Transactions on Power Apparatus and Systems, PAS-89, 120–125, 1970.
4. J. S. Thorp, A. G. Phadke, and K. J. Karimi, Real time voltage-phasor measurements for static state estimation, IEEE Transactions on Power Apparatus and System, PAS-104(11), 3098–3106, 1985.
5. G. Zweigle, D. Finney, and R. Moxley, Adding shaft angle measurement to generator protection and monitoring, in Western Protective Relaying Conference, October 2012, Spokane, WA.
6. R. Zivanovic and C. Cairns, Implementation of PMU technology in state estimation: An overview, in Proceedings of the IEEE 4th AFRICON, vol. 2, pp. 1006–1011, 24–27 September 1996, Stellenbosch, South Africa.
7. E. O. Schweitzer III and D. E. Whitehead, Real-world synchrophasor solutions, in Proceedings of the 35th Annual Western Protective Relay Conference, October 2008, Spokane, WA.
8. E. O. Schweitzer III and D. E. Whitehead, Real-time power system control using synchrophasors, in Proceedings of the 34th Annual Western Protective Relay Conference, October 2007, Spokane, WA.
9. T. Yang, H. Sun, and A. Bose, Two-level PMU-based linear state estimator, in Proceedings of the IEEE PES Power Systems Conference and Exposition, pp. 1–6, 2009, Seattle, WA.
10. SEL-3373 Station Phasor Data Concentrator, Instruction Manual, Schweitzer Engineering Laboratories, Inc., 11 March 2013.
11. G. Zweigle, R. Moxley, B. Flerchinger, and J. Needs, Wide-area measurements to improve system models and system operation, in Proceedings of the 11th International Conference on Developments in Power System Protection, DPSP, 23–26 April 2012, Birmingham, UK.
12. D. Shi, D. Tylavsky, N. Logic, and K. Koellner, Identification of short transmission-line parameters from synchrophasor measurements, in Proceedings of the 40th North American Power Symposium, 28–30 September 2008, Calgary, AB.
13. Z. Huang, P. Du, D. Kosterev, and S. Yang, Generator dynamic model validation and parameter calibration using phasor measurements at the point of connection, IEEE Transactions on Power Systems, 28(2), 1939–1949, 2013.
14. J. V. Espinoza, A. Guzman, F. Calero, M. Mynam, and E. Palma, Wide-area measurement and control scheme maintains Central America’s power system stability, in Western Protective Relay Conference, 16–18 October 2012, Spokane, WA.
15. R. Moxley, C. Petras, C. Anderson, and K. Fodero II, Display and analysis of transcontinental synchrophasors, in Proceedings of the 6th Annual Western Power Delivery and Automation Conference, April 2004, Spokane, WA.
16. D. J. Trudnowski, J. W. Pierre, N. Zhou, J. F. Hauer, and M. Parashar, Performance of three mode-meter block-processing algorithms for automated dynamic stability assessment, IEEE Transactions on Power Systems, 23(2), 680–690, 2008.
17. J. M. Ordagci, H. C. T. Santos, S. R. Morand, R. Cespedes, R. Mano, and D. Caceres, ONS—Brasil new control center architecture conceptual design, in Proceedings of the IEEE/PES Transmission and Distribution Conference and Exposition: Latin America, 13–15 August 2008, Bogota.
18. G. Zhang, S. Lee, R. Carroll, J. Zuo, L. Beard, and Y. Liu, Wide area power system visualization using real-time synchrophasor measurements, in Proceedings of IEEE Power and Energy Society General Meeting, 25–29 July 2010, Minneapolis, MN.
19. J. Wang, Y. Hu, A. Johnson, H. Tram, and R. Nasri, System requirements of visualization platform for wide area situation awareness system, in 2010 IEEE Power and Energy Society General Meeting, 25–29 July 2010, Minneapolis, MN.
20. SynchroWAVe Central Software Instruction Manual, Schweitzer Engineering Laboratories, Inc., 1 April 2013.
21. Arizona-Southern California Outages on September 8, 2011—Causes and Recommendations, Federal Energy Regulatory Commission and the North American Electric Reliability Corporation, April 2012.
22. P. Kundur, Power System Stability and Control, McGraw-Hill, New York, 1994.
23. K. Sun, S. Likhate, V. Vittal, V. S. Kolluri, and S. Mandal, An online dynamic security assessment scheme using phasor measurements and decision trees, IEEE Transactions on Power Systems, 22(4), 1935, 2007.
24. Z. Wang, A. Giris, V. Aravnthar, and E. Makram, Wide area power system transient stability assessment using catastrophe theory method and synchrophasors, in 2011 IEEE Power and Energy Society General Meeting, 24–29 July 2011, San Diego, CA.
25. C. Zheng, V. Malbasa, and M. Kezunovic, Regression tree for stability margin prediction using synchrophasor measurements, IEEE Transactions on Power Systems, 28(2), 1978–1987, 2013.
26. M. Donolo, M. Venkatasubramanian, A. Guzman, and F. De Villiers, Mitigating voltage collapse problems in the Natal region of South Africa, in Proceedings of the IEEE Power Systems Conference and Exhibition, 15–18 March 2009, Seattle, WA.
27. M. Glavic and T. V. Cutsem, Wide-area detection of voltage instability from synchronized phasor measurements. Part I: Principle, IEEE Transactions on Power Systems, 24(3), 1408–1416, 2009.
28. M. Glavic and T. V. Cutsem, Wide-area detection of voltage instability from synchronized phasor measurements. Part II: Simulation results, IEEE Transactions on Power Systems, 24(3), 1417–1425, 2009.
29. A. Johnson, R. Tucker, T. Tran, D. Sullivan, C. Anderson, and D. E. Whitehead, Static var compensation controlled via synchrophasors, in Proceedings of the 34th Annual Western Protective Relay Conference, October 2007, Spokane, WA.
30. Y. Gong and A. Guzmán, Synchrophasor-based online modal analysis to mitigate power system inter-area oscillation, in Proceedings of the DistribuTech Conference and Exhibition, 2009, San Diego, CA.
31. J. Chow, J. Sanchez-Gasca, H. Ren, and S. Wang, Power system damping controller design using multiple input signals, IEEE Control Systems Magazine, 20(4), 82–90, 2000.
32. M. Mokhtari, F. Aminifar, D. Nazarpour, and S. Golshannavaz, Wide-area power oscillation damping with a fuzzy controller compensating the continuous communication delays, IEEE Transactions on Power Systems, 28(2), 1997–2005, 2013.
33. IEEE Application Guide for IEEE Std 1547, IEEE Standard for Interconnecting Distributed Resources with Electric Power Systems, 2009.
34. J. Mulhausen, J. Schaefer, M. Mynam, A. Guzmán, and M. Donolo, Anti-islanding today, successful islanding in the future, in Proceedings of the 36th Annual Western Protective Relay Conference, 20–22 October 2009, Spokane, WA.
35. M. Mills-Price, M. Scharf, S. Hummel, M. Ropp, D. Joshi, G. Zweigle, K. Ravikumar, R. Moxley, and B. Flerchinger, Interconnection control of distributed generation with time-synchronized phasors, in IEEE Power Systems Conference and Exposition, pp. 1–8, 20–23 March 2011, Phoenix, AZ.
36. E. O. Schweitzer III, D. E. Whitehead, G. C. Zweigle, and K. G. Ravikumar, Synchrophasor-based power system protection and control applications, in Proceedings of the 36th Annual Western Protective Relay Conference, October 2009, Spokane, WA.
37. SEL-421 Relay Protection and Automation System, Instruction Manual, Schweitzer Engineering Laboratories, Inc., 22 February 2013.
38. IEEE C37.118.1–2011, IEEE Standard for Synchrophasor Measurements for Power Systems, 2011.
39. Q. Yang, T. Bi, and J. Wu, WAMS implementation in China and the challenges for bulk power system protection, in IEEE Power Engineering Society General Meeting, 24–28 June 2007, Tampa, FL.
40. P. Wang, W. Deng, and Z. Qian, Method for the measurement of rotor voltage and current of power generator, IET Generation, Transmission, and Distribution, 4(7), 854–860, 2010.
41. G. Zweigle and V. Venkatasubramanian, Model prediction based transient stability control, in IEEE PES Conference and Exhibition, 7–10 May 2012, Orlando, FL.
42. G. Zweigle and V. Venkatasubramanian, Wide-area optimal control of electric power systems with application to transient stability for higher order contingencies, IEEE Transactions on Power Systems, 28(3), 2313–2320, 2013.
43. A. Guzmán, V. Mynam, and G. Zweigle, Backup transmission line protection for ground faults and power swing detection using synchrophasors, in Proceedings of the 34th Annual Western Protective Relay Conference, October 2007, Spokane, WA.
44. D. Hu and V. Venkatasubramanian, New wide-area algorithms for detection and mitigation of angle instability using synchrophasors, in IEEE Power Society General Meeting, 24–28 June 2007, Tampa, FL.
45. E. Martinez, N. Juárez, A. Guzmán, G. Zweigle, and J. León, Using synchronized phasor angle difference for wide-area protection and control, in Proceedings of the 33rd Annual Western Protective Relay Conference, October 2006, Spokane, WA.
46. C. Taylor, D. Erickson, K. Martin, R. E. Wilson, and V. Venkatasubramanian, WACS—Wide-area stability and voltage control system: R&D and online demonstration, Proceedings of the IEEE, 93(5), 892–906, 2005.
47. D. E. Bakken, A. Bose, C. H. Hauser, D. E. Whitehead, and G. C. Zweigle, Smart generation and transmission with coherent, real-time data, Proceedings of the IEEE, 99(6), 928–951, 2011.