
CONTENTS
17.2 Smart Metering and Infrastructure Overview
17.3 Major System Components of SMI
17.3.2.1 Meshed Network Radio Frequency
17.3.2.2 Point-to-Point Radio Frequency
17.3.2.3 Power Line Carrier/Broadband Power Line
17.3.2.5 cellular Technologies
17.3.2.6 Satellite Technologies
17.3.2.7 Optical Fiber Technologies
17.3.3 Meter Data Management System
17.6 SMI In Supporting System Analysis, Planning, And Operations
17.6.2 Distribution System State Estimation And Analysis
17.6.3 Outage Location And Response
17.6.4 Voltage And Var Optimization
17.6.5 Distribution Planning And Distribution Operation
17.7.2 An Example Of Smart Meter Data Analytics
Billing is the main purpose of electricity metering. Utilities install meters to record the energy consumption (kWh) of their customers and bill them accordingly. The meter reading is normally taken by a meter reader who visits customer sites monthly and manually records the customers’ electricity usage.
To take advantage of the advancement of communication technologies and to reduce the cost of meter reading, some utilities have implemented automated meter reading (AMR) technologies, which enable them to collect monthly billing data without physically reading the meter. These are often realized by a walk-by or drive-by approach using one-way communication technologies such as mobile, radio, and phone-based systems.
In recent years, smart metering and infrastructure (SMI), which is also often called advanced metering infrastructure (AMI) [1], has become one of the hottest topics within electric power utilities. SMI is not a tool to simply capture customer energy consumption every month or two, but an integrated hardware and software architecture that is capable of capturing near real-time or real-time consumption, demand, voltage, current, and other information. In other words, the system functionality of SMI goes far beyond just obtaining a monthly meter reading.
Combining two-way communication and smart metering technologies that can record customers’ load profiles, SMI provides utilities with system-wide sensing and measuring capability. It not only enables utilities to apply time-of-use (TOU) rates for customers in order to achieve peak shaving to reduce capital investment, but it also enables many advanced functionalities for utilities, such as customer service, outage response, load forecast, demand-side management, and system planning. SMI has been considered a fundamental component of smart grid technology.
The world’s largest smart meter deployment was undertaken by Enel SpA, Italy. It deployed smart meters to its entire customer base of over 27 million customers over a 5-year period from 2000 to 2005.
It is worth mentioning that regulators have played an important role in driving SMI technology development and implementation. The Ontario Energy Board in Ontario, Canada, legislated in November 2005 that Ontario needed to install smart meters for each of its 5 million customers by 2010. Since the US Energy Policy Act of 2005 requires utilities to provide TOU service to any customer who requests it, many utilities in the United States have been actively pursuing SMI (or AMI) implementation. In 2006 and 2007, the California Public Utility Commission approved the SMI plans for its three main utilities PG&E, SCE, and SDG&E, which would make smart meters available to all electricity and gas customers in its jurisdiction by 2012.
An injection of government funding in 2009 resulted in a rapid increase in the deployment of smart meters in North America. As stimulus funds, the American Recovery and Reinvestment Act of 2009 allocated $3.4 billion to smart grid projects and the Canadian government allocated $795 million to smart grid projects in 2009 through its Clean Energy Fund. It is estimated that smart meter deployments had reached about one in three households in the United States in 2012, and about 25 utilities in the United States have completed their system-wide integrations. North American utilities are expected to install 81 million smart meters by 2020. That would bring projected smart meter penetration to about 55% in North America [2]. Similar levels of SMI deployment can be seen in many other countries and regions, including Australia [3] and Europe.
This chapter provides an overview of the SMI system and its components, and discusses its benefits and relation to the smart grid. It also summarizes the various applications of SMI in support of distribution system planning, analysis, and operations, and briefly introduces the emerging smart meter data analytics with a real implementation example.
17.2 SMART METERING AND INFRASTRUCTURE OVERVIEW
SMI is the totality of the systems and networks that are used to measure, collect, store, analyze, and use energy usage data. In other words, SMI includes smart meters and all other infrastructure components—hardware, software, and communication networks—that are needed to offer advanced capabilities. SMI covers the infrastructure not only from meters to the utility, but also from meters to customers, which enables every customer to analyze and use the energy metering data. SMI also makes energy usage data available to parties other than the utility in supporting the provision of demand response solutions.
A typical SMI network employs a two-way communication system and smart metering technology. Instead of a monthly accumulated energy consumption recording, a smart meter records the customer’s consumption at preset intervals on a continuous basis. It communicates the customer’s load profile data to a central location, where the data are sorted and analyzed for a variety of purposes, such as customer billing, outage response, and demand-side management. SMI also uses the same system equipment to send information back through the network to meters to capture additional data, control the meters, or update the meters’ firmware. Figure 17.1 shows an overview of the SMI solution [4].
There is often confusion between SMI and the traditional AMR solution. The major characteristics that distinguish SMI from AMR are summarized in Table 17.1.
17.3 MAJOR SYSTEM COMPONENTS OF SMI
A SMI system is comprised of a number of technologies and applications that have been integrated into one solution. The four major SMI components are:
• Smart meters
• Communication system
• Meter data management systems (MDMS)
• Home area networks (HAN)
In addition, many SMI interfaces are needed in order for other system-side applications to use information collected by SMI, including load forecast, outage response, customer support, and system operations. Some of these system-side applications are discussed in the following sections.

FIGURE 17.1 Overview of SMI solution.
TABLE 17.1
Differences Between SMI and AMR
AMR |
SMI |
Collection of registered readings from a distant location |
An infrastructure to collect, store, analyze, and utilize remotely interval meter data |
One-way communication |
Two-way communication |
Monthly collection of data |
Variable data granularity supporting TOU pricing |
Coverage limited to a small area or a portion of a system |
Whole-system coverage |
No additional function |
Additional functionalities, such as remote firmware upgrades, HAN supports |
Conventional electromechanical meters have been used by utilities for residential customer billing for many years. These meters simply record the total energy consumed over time with an incremental energy counter. Although digital meters have been used for billing in the last two decades, they are also mainly used to record accumulated energy (there may be some limited records of megawatt [MW] demand). The measurements from both electromechanical meters and nonsmart digital meters are collected manually by physical site visits and, thus, record only the readings at the time of the visit. Smart meters are intelligent, solid-state, programmable devices that can perform many functions beyond energy consumption recordings. By using built-in memories, smart meters can record and store readings at preset intervals (e.g., 15 min, 30 min, or hourly) and prescheduled times. With built-in communication modules, they can connect to a two-way communication system, not only to send readings from meters to the data center but also to deliver information or control orders from the data center to meters.
The two-way communication functionality supports on-demand reading, which enables verification of customer energy consumption in time, remote connection and disconnection, and detection of tampering or out-of-range voltage conditions. These functions also make TOU rate or real-time pricing and demand management programs possible. Most of the smart meters available on the market can also send out a “last gasp” message when loss of power is detected and a “first breath” message when power service is restored. Such information provides significant benefits for outage location and response. An example of a smart meter [4] is shown in Figure 17.2.
The measurements provided by smart meters may be different depending on utilities’ requirements and practices. The main measurement attributes provided by a residential smart meter installed by BC Hydro, a Canadian utility, are listed in Table 17.2 [5].

FIGURE 17.2 A demonstrative smart meter.
TABLE 17.2
Main Measurements Provided by a Residential Smart Meter
Present Register |
Self-Read Register |
Interval Data |
Instantaneous voltage phase A |
Continuous accumulated demand (watts) delivered |
Maximum voltage phase A |
Instantaneous watts delivered aggregate |
Accumulated demand (watts) delivered |
Maximum voltage phase B |
Instantaneous watts delivered phase A |
Maximum demand (watts) delivered |
Maximum voltage phase C |
Instantaneous watts delivered phase B |
Varh delivered |
Minimum voltage phase A |
Instantaneous watts delivered phase C |
Varh quadrant 1 |
Minimum voltage phase B |
Instantaneous watts received phase A |
Varh quadrant 4 |
Minimum voltage phase C |
Number of demand resets |
Varh received |
Varh quadrant 1 |
Number of inversion tampers |
Wh delivered |
Vh phase A |
Number of minutes on battery carryover |
Wh received |
Vh phase B |
Number of power outages |
Vh phase C |
|
Number of removal tampers |
Wh delivered |
|
Number of times programmed |
A smart meter can also work as a gateway for utilities to communicate with the customer’s HAN, which enables customers to view their near real-time consumption information and receive price signals from utilities. Depending on customers’ willingness, smart meters can relay load control commands from the utility to customers’ appliances for emergency load control or demand response programs.
Typical smart meter functionalities include the following:
• Record interval (daily, hourly, or subhourly) energy consumption and demand data
• Support demand read capability
• Provide bidirectional metering, which will accommodate distributed generations at customer sites
• Provide notification on loss of power and service restoration
• Provide tamper alarms and enable theft detection
• Provide voltage measurement, voltage alarms, and power quality monitoring
• Be remotely programmed and firmware upgraded over the air
• Support remote time synchronizing
• Enable TOU rate billing
• Enable remote connection and disconnection service
• Limit loads for purposes of demand response
• Communicate and interact with intelligent appliances or devices in a customer’s HAN
• Protect meter data security
Since smart meters enable demand response programs, this leads to a reduction in emissions and carbon dioxide pollution. The detailed consumption interval data accessible by customers will encourage consumers to reduce their unnecessary electricity usage and shift their consumption to nonpeak time.
The backbone of the SMI system is the communication network. Employing communication networks, the SMI system is capable of reading a smart meter many times each day, and can deliver meter data, including outage and tamper alarms, in near real time from the meter to the utility data center. Utilities have different geographical conditions, load densities, and legacy communication facilities, and, therefore, the communication system to be implemented for SMI is different in each case. The communication network generally uses one of several different network architectures, which are comprised of meter interfaces, data collectors, or concentrator towers, and a central data collection device located in the data center.
A SMI communication system usually has hierarchical architectures and hybrid communication systems with various technologies. Data collectors or concentrators are used and installed on poles, in substations, or on other facilities to form the link between meters and network management application software. The National Institute of Standards and Technology (NIST) in the United States has defined the communication network in two layers [6]: the SMI wide area network (WAN) communication system serves as a backhaul communication from meter data collectors in the field to the head end (operation center), whereas the field area network communication system covers the last-mile communication from smart meters to meter data collectors. It is often seen in existing designs that one or two major last-mile communication technologies are used for the communication architecture and a variety of technologies are used for the data backhaul system. We summarize the major communication technologies in SMI implementation as follows.
17.3.2.1 Meshed Network Radio Frequency
Wireless mesh networks were originally developed for military applications. In the mesh network, each communication node not only processes its own data, but it also serves as a relay for other nodes. In other words, it propagates the data in a network.
This architecture relies on a local area network (LAN) utilizing the unlicensed industrial, scientific, and medical (ISM) band (902–928 MHz) with either a proprietary protocol or an open standard such as IPv6. Although the transmission power is limited to 1 W, a 1–5 mile range from meter to meter data collector is achieved by using other meters as repeaters. The number of meter-to-meter hops varies from system to system and determines the latency in the network. Although the hops can theoretically reach a large number (such as 16–20), the number has been minimized in practical applications to achieve an acceptable network performance. The meter number in one mesh network varies from several hundred to several thousand.
This meshed network radio frequency (MNRF) technology is associated with a limited service range, resulting in an increased number of regional collectors. However, the lower cost for a regional collector offsets the negative effect due to the number of regional collectors in the system. These systems generally rely on a cellular interface at the regional collector, although telephone or other proprietary communication links can be an option.
Mesh networks are effective systems for the deployment of reliable large-scale SMI networks and are widely implemented in North America due to their scalability and reliability. However, the low-power radio signals used in SMI systems are deployed in the unlicensed spectrum and are susceptible to interference and link blockage that can affect the performance. Also, mesh networks have to be properly dimensioned to operate within the constraints of the mesh routing protocol and system capacity limits. Proper network planning and analysis techniques are valuable tools that can mitigate these issues in advance.
17.3.2.2 Point-to-Point Radio Frequency
Point-to-point radio frequency (PPRF) wireless networks are also called star networks. In this type of network, end devices are directly connected to the collectors. A solution called “buddy mode” enables any end device to relay another end device, and further connect to the collector, eventually leading to network coverage. The PPRF is designed to have all end devices connected to a collector through no more than two hops. Most PPRF systems use licensed frequencies with higher power than unlicensed bands. Through the higher power capacity and enhanced design in receiver sensitivity, the current generation of PPRF systems can cover a service range of 5–15 miles from a meter to a regional collector.
Compared with the MNRF network, the PPRF star network has a much bigger coverage with one regional collector in terms of end device numbers and geographical areas. This leads to a significant benefit in minimizing cost, as the ratio of meters to regional collectors can be increased. Since end devices can be connected to the collector directly or within two hops, the PPRF star network often introduces much lower latency in communication and, thus, has a better network performance. However, PPRF networks are usually proprietary and are limited in interoperability. The availability of added functionality is affected by the vendor’s development capabilities and schedule.
17.3.2.3 Power Line Carrier/Broadband Power Line
Power line communication technologies use existing power lines as the communication vehicle. Power line carrier (PLC) provides a narrowband capacity, whereas broadband power line (BPL) offers a higher-capacity communication channel. In either case, additional interface equipment is needed at substations if a relatively long communication route is required. With the PLC architecture, the communication from substation to meter is achievable. With BPL, however, additional equipment to boost the signal is required along a medium-voltage line at about 1-mile intervals. In most cases, bridges are also required around distribution transformers.
PLCs are attractive to utilities, the owners of the assets, and make it easy for them to manage, operate, and maintain both lines and communication devices on the lines. As a matter of fact, PLC is the dominant smart metering communication technology in Europe. In this case, data collectors, which are installed at the secondary side of distribution transformers, talk to end customer meters through PLC, and are usually connected to the data center through other public cellular or WAN technologies. There are three advantages to the PLC communication in Europe. First, PLC provides reasonable communication performances in terms of data throughput and reliability in a short distance range from a distribution transformer to the end customers. Second, data collectors are installed at the same voltage level as that of the distribution system with end customers and, thus, no additional bridge is needed for PLC signals to cross the distribution transformer. Third, the number of customers connected to one distribution transformer can be relatively high (often over 40 customers), which reduces the number of data collectors required and makes the connection between the WAN and data collectors cost effective.
However, the situation is different in North America. The number of customers served by one distribution transformer is usually small (fewer than 20 usually), and, thus, it is not cost effective to have data collectors installed at the secondary side of the distribution transformer. On the other hand, if bridges are used to allow PLC to bypass distribution transformers and enable the data to be transmitted through the medium-voltage lines, the cost is still high and the communication performance is low, as both the data transmitting rate and additional functionalities are limited. Although BPL offers a broader range of additional functionalities, the current cost per home serviced is also relatively high.
In short, although the PLC and BPL technologies are attractive to utilities for obvious reasons, unfortunately, the prohibitive capital requirements and increasing data volumes have limited their widespread adoption in North America. Many utilities have chosen wireless technologies to accomplish their goals of developing reliable two-way communication for SMI networks.
Wireless broadband utilizes the emerging Institute of Electrical and Electronics Engineers (IEEE) 802.16 standard (Wi-MAX) for direct communication to meters equipped with an 802.16 chip set. This architecture has the potential to provide a direct communication link to meters and other devices within a 50-mile radius with a proprietary communication network.
A broadband wireless architecture provides the benefit of wide geographic coverage, with complete control over the communication infrastructure and no ongoing airtime charges while maintaining open industry standards. Any device equipped with an 802.16-compliant chip set can be addressed through the network. A secondary benefit would be the potential to leverage the communication network for remote workforce management, to implement additional distribution automation, and to provide broadband connectivity to communities not currently connected.
Although this approach provides an effective control over potential future increases in airtime cost, utilities will bear the capital and ongoing operation, maintenance, and administration cost of the network.
17.3.2.5 Cellular Technologies
Cellular technologies are among the most popular WAN communication technologies in the SMI world, mainly due to their immediate availability from service providers. Leveraging the third party’s cellular network, they require the lowest capital investment. Utilities use various LAN technologies in which cellular technology is often employed to send the data from collectors to the data center. Cellular technologies are sometimes used in remote areas for direct connections to end meters where there is no other more cost-effective communication solution available. However, it should be noted that, although the coverage and performance of public cellular networks are sufficient for SMI applications, the relatively expensive cost associated with these networks has made cellular technologies unfavorable for a direct system-wide communication between end devices and the data center. There is no such implementation so far.
17.3.2.6 Satellite Technologies
Satellite technologies are often used for remote areas where other communication is not available. The cost associated with satellite technologies is still high at this stage.
17.3.2.7 Optical Fiber Technologies
Optical fiber technologies are adopted as backhaul or WAN technologies for SMI, especially in dense population areas. These technologies are quite often used for the connection between the data center and meter data collectors in Asia. Although there have been pilot projects in applying optical fibers to home technology to enable smart meter reading and many other added services to customers, no system-wide SMI has used fibers to reach the majority of customers.
A single communication technology may not be economic for utilities with a large service territory to deploy SMI. As a result, a hybrid system with two or more wide-area communication technologies may be a better option. For example, a hybrid option includes the use of MNRF or PPRF or BPL architecture in densely populated urban areas and PLC technology in low-density urban areas.
Many utilities consider SMI implementation to be a good opportunity for business transformation, which will build a common communication infrastructure for all future advanced applications. With such an objective, SMI communication infrastructure should be very well planned and designed to have sufficient capacity to meet requirements in a reasonable time frame [7]. It should employ a highly secure and bidirectional communication system, and conform to future-oriented open standards (such as Internet protocol addressability). It should support continuous interactions between the utility and consumers, and particularly controllable electrical loads, which can enable TOU rates, remote meter programming, demand response, and ultimately distribution automation and other smart grid applications.
17.3.3 METER DATA MANAGEMENT SYSTEM
MDMS is a database software application with analytical tools that interfaces with the SMI data collection system to process, store, and analyze meter readings [8].
Many important features of SMI rely on the successful collection of meter data and manipulation of alarm signals within MDMS. In order to gain operational efficiencies provided by SMI, utilities should build interactions of MDMS with other information systems or applications, including:
• Consumer information system (CIS), billing systems, and utility’s websites
• Demand response management system
• Distribution management system (DMS)/energy management system
• Outage management system
• Reliability data management system
• Power quality management system and load forecasting system
• Mobile workforce management system
• Geographic information system (GIS)
• Transformer load management system
• Distribution automation and other operation applications
One of the primary functions of an MDMS is to perform validation, editing, and estimation on the SMI data to ensure that the collected data flowing to the systems described above are complete and accurate despite disruptions in communication networks or at customer premises.
Based on existing practices, MDMS receives all meter readings in the daily time frame from midnight to three o’clock in the morning, or several times a day at prescheduled intervals with consideration of how best to utilize the bandwidth of the communication network. After performing validation, editing, and estimation of the SMI data, utilities post the customers’ meter measurements onto a web portal so that customers can check their consumption information at any time.
Depending on the functional design and type of billing system being used, the MDMS application may be called on to calculate billing determinants and then used to send the bill to customers, including time of use, critical peak price, and other useful information. The MDMS is combined with the CIS system to handle billing of all time-differentiated rate structures. Some MDMS solutions have built-in additional modules, such as feeder load analyzer and energy theft analyzer.
Major MDMS functions are summarized as follows:
• Master meter data management
• Multiutility meter accommodations (gas, electric, water)
• Multichannel support (kWh, kvarh, Ah, Vh, kW, kvar, V)
• Support for different interval lengths
• Provision of data validation, editing, and estimation
• Energy aggregation, balance, and theft detection
• Complex billing capability
• Support for real-time pricing or TOU rate
• Ability to maintain reading schedules
• Support for regulated and deregulated markets
• Meter asset management capabilities
• Support for distribution asset optimization
• Support for demand response programs
• Support for outage and restoration
• Meter event processing
• Support for meter control (e.g., on-demand reading and remote connect/disconnect)
• Web-based customer portal support
• Interfaces to various utility operation systems
HAN has become a popular term in recent years. One important component of HAN is the in-home display (IHD) device, which is also called the in-premise device. IHD is a device located inside a customer’s home. It receives the customer’s metering measurement and utility pricing information in near real time, and displays the information to the customer. A HAN interfaces with a consumer portal (HAN gateway) to link the smart meter to controllable electrical devices within the customer’s home to allow the customer to actively participate in demand response programs.
The management functions of HAN include:
• Updated and continuous in-home energy consumption and pricing signal displays so that consumers always know how much energy is being used and what it is costing
• Response to price signals based on consumer-entered preferences
• Set points that limit utility or local control actions to a consumer-specified band
• Control of loads without consumer’s continuing involvement
• Consumer override capability
The HAN/consumer portal provides a smart interface to the power market by acting as the consumer’s “agent.” A HAN may be implemented in a number of ways, with the consumer portal located in any of several possible devices, including the meter itself, neighborhood collector, stand-alone utility-supplied gateway, or even customer-supplied equipment.
The major specifications of HAN are still under debate so far. In the meantime, Wireless (ZigBee) and PLC have been the most popular communication technologies from HAN gateway (customer portal) to customer IHD. The standard on Smart Energy Profile 2.0 under evaluation plans to provide IPv6 integration into home devices.
One emerging interest in this area is the plug-in hybrid electric vehicle (PHEV) integration with HAN. Taking advantage of the HAN communication network, a PHEV can be seamlessly integrated with the electric grid in reacting to the utility’s pricing and requirement signals relayed from the HAN gateway. The PHEV can automatically charge its battery during system off-peak time, and can backfeed to the grid as a small power supply source when the system needs generation support. The latter case is called the vehicle to grid application.
Many benefits can be gained for customers, utilities, and society from implementing SMI, including the following:
• Reduce utility operation costs due to the elimination of manual meter readings, quick outage location and response, and reduced trouble calls
• Improve the billing process and customer satisfaction by providing customers with accurate and timely bills
• Improve customer services through the use of remote meter diagnostics and on-demand reads
• Manage customer accounts with the ability to remotely connect and disconnect services
• Provide more choices to customers for prices and services
• Provide considerable amounts of energy usage and grid status information, which can be used by consumers and utilities to make better decisions about energy consumption and system improvements, respectively
• Provide system-wide measurements and distribution load information, which helps utilities to
• Assess equipment health
• Maximize asset utilization and life
• Optimize maintenance process and expenditure
• Pinpoint grid problems
• Improve grid planning
• Locate/identify power quality issues
• Detect/reduce energy theft
• Facilitate demand responses and TOU rates for peak shaving and energy conservation, which can reduce capital investments on generation, transmission, and distribution systems, system congestion costs, and electrical energy losses
• Accommodate integration of customer-side distributed generations
• Provide an infrastructure foundation for smart grid and other advanced applications
SMI provides an integrated communication system and information technology (IT) infrastructure for power utilities. It also provides system-wide sensing and time-stamped measurements for system operators, which makes the distribution system fully observable. By two-way communications, SMI provides a fundamental link between customers and the power grid, and enables interaction between them. With a flexible rate design and the functionality of SMI in real-time pricing, customers can be motivated and actively participate in the energy market and demand response programs. The bidirectional metering capability in smart meters ocan also enable customer-owned distributed generations to be easily integrated with the grid system.
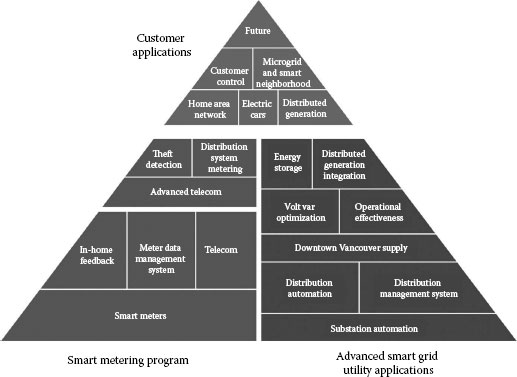
FIGURE 17.3 SMI in the smart grid framework.
Due to the lagging of distribution automation implementation in North America, SMI is considered to be the first step for power utilities to move toward smart grid. Utilities count on SMI to build the common telecom and IT infrastructure as a future smart grid foundation. Following SMI, power utilities can speed up advanced distribution operations, advanced transmission operations, and advanced asset management. In this sense, SMI is viewed as a smart grid enabler. As a matter of fact, a large portion of the Department of Energy’s smart grid stimulus funds in the United States has been allocated to SMI implementations. Figure 17.3 illustrates the relationship between SMI and smart grid in a utility’s planned smart grid implementation framework [4].
17.6 SMI IN SUPPORTING SYSTEM ANALYSIS, PLANNING, AND OPERATIONS
SMI collects bidirectional interval measurements over time for every customer location in the distribution system and, thus, provides utilities with much wider and deeper visibility into the distribution system than a traditional supervisory control and data acquisition (SCADA) network. The measurements with communication paths will significantly benefit the applications in distribution system analysis, planning, and operations, especially with the increasing penetration of customers’ distributed generations and electrical vehicles into distribution systems. This section briefly discusses some major applications that can be enabled through SMI implementation.
Load forecasting is an essential part of electric distribution operation planning and capital planning. Short-term load forecasting, over the next few hours or days, is primarily used for operation planning purposes. Operation planners use historical records of loading, day-of-week information, and weather forecasts to determine approximately what the load will be on a given date and time ahead. For example, short-term load forecasts enable operation support staff to determine whether load transfer switching can be performed during a specified period without overloading adjacent backup supply facilities.
Long-range forecasting, which predicts how the load will change over the next few years or decades, is an important aspect for system capital planning to meet long-term load requirements. The results of load forecasting heavily depend on the customer data and other supporting information availability. Many statistical analyses on a huge pool of data are needed. The collected interval measurements for each end customer over time, combined with the spatial information in utility enterprise GIS, enables the load forecasting to be conducted based on real measurements. This will improve the forecasting confidence level significantly.
17.6.2 DISTRIBUTION SYSTEM STATE ESTIMATION AND ANALYSIS
Traditionally, utility companies monitor distribution systems by SCADA devices located inside system substations or outside substations along distribution feeders, such as line reclosers, voltage regulators, and capacitor bank controllers. SCADA measurements provide information about the electrical conditions (current, voltage, etc.) at these locations. However, no visibility of the electric conditions elsewhere on the feeders is available.
Some utilities have deployed DMSs that include advanced software applications to improve the visibility and performance of distribution feeders. One key application is the state estimation for distribution feeders. It uses a three-phase unbalanced electric model of distribution feeders to estimate voltages, real and reactive power flows, electrical losses, and other parameters at all points on a distribution system. It leverages SCADA measurements to estimate the “real-time” electrical conditions at all points along a distribution feeder.
State estimation attempts to compensate for the lack of real-time data by using historical information and calculated data, and assigns an estimated current load value to each distribution transformer on the feeder using statistical load profile data obtained from load surveys of various general classes of customers. Obviously, state estimation has limited accuracy for the estimation of real-time energy consumption at each transformer and other parameters. The accuracy of a state estimation program can be improved as more actual measurements are included in the solution. Smart meter data offer opportunities to significantly improve the accuracy by provision of measurements at intervals of an hour or even a minute. The historical data collected from the SMI system, in conjunction with weather information and GIS modeling, can be used to create much more accurate customer models. Customer data can be collected in near real time and, thus, the exact power flow at these customer points can be known at all times.
17.6.3 OUTAGE LOCATION AND RESPONSE
Many utilities rely on customer phone calls to receive outage information. Usually, they will not send field crews until several additional phone calls become available in order to better understand the outage range and impacted area and to minimize the manpower waste in response to false alarms. This often results in a lengthy outage to affected customers. It is even worse when there are nested outages in any service area.
Each smart meter is a smart grid sensor in a distribution system since it has built-in capability in reporting outage whenever detecting loss of voltage. A “last gasp” message will be sent back to the outage management system immediately. Collected alarm messages from multiple smart meters will give a clear indication of the impacted area of outages. Before crew members are sent to the site for restoration, the operators in the dispatching center can issue an “on-demand ping” to the relevant meters to verify whether there is any loss-of-power situation on a meter. This can greatly reduce false alarms. Smart meters can also report the “first breath” when the power supplied to the customer is restored. The collected indications and interactive process between smart meters and operators can help confirm the service restoration and detect whether or not any nested outage exists.
This smart meter capability will dramatically reduce the customer service interruption time. The meter data can also be used in conjunction with the faulted circuit indicator’s measurement to identify the fault location before crews are dispatched.
17.6.4 VOLTAGE AND VAR OPTIMIZATION
Integrated Volt/Var optimization (VVO) refers to a system that controls the setting points of voltage controllers of on-load tap-changers of in-substation transformers and feeder voltage regulator controllers, as well as the operational statuses of feeder and substation capacitors. With the advancement in smart grid technology, more controllable variables will be involved in the VVO process. The VVO works as an integrated functionality because it optimizes the composition of all controllable variables in a coordinated manner and takes into account the multiple objectives and constraints in distribution, customer, and transmission domains together. The VVO application is a multiobjective function that may change from one operational objective to another depending on the current operational needs. The primary objective of VVO is to provide standard voltages at the customer service locations. Peak load reduction has been the most popular secondary objective. In recent years, increasing environmental concerns and more regulatory requirements have led to a wave of VVO implementation among North American utilities, targeting peak load reduction, energy conservation, and carbon emission reduction. At the same time, the modern digital community is much more sensitive to the voltage quality and has set stricter requirements for electric utilities in maintaining voltages at the customer service points within acceptable limits defined by regulatory bodies.
The currently implemented VVO function is based on a comprehensive near realtime distribution power flow model. In turn, the power flow model is built on a real-time connectivity model, nodal load models, and secondary circuit equivalent models. The load models are balanced in near real time with the SCADA measurements available from the substations and remotely monitored field devices. The estimated voltage from the state estimator at the bus feeding downstream distribution feeders is taken by the power flow model as a reference voltage. Hence, the accuracy of the modeled voltages at the customer service points depends on the accuracy of the reference voltage and modeled voltage drops in the primary feeder, distribution transformers, and secondary circuit equivalents. The inaccuracies of these component models create many uncertainties in Volt/Var control, thus reducing the benefits of VVO. SMI implementation brings an opportunity for utilities to enhance the VVO benefits by reducing the uncertainties in Volt/Var optimization, since this can be achieved by utilizing the system-wide smart grid sensing devices and communication networks of SMI [9].
Another purpose of VVO is to keep the distribution voltage as low as possible without violating electric service standards at any customer service point. Since most VVO schemes rely on the state estimation program to verify the low voltage constraint and the model results are inherently inaccurate, VVO applications tend to be conservative in order to avoid unacceptable low voltage violations. The historical and real-time voltage data in the SMI system can significantly improve the model’s accuracy and ensure that voltage–Var control actions do not violate operating constraints. In addition, bellwether meters at identified weak points in the system can be programmed to feed back near real-time measurements for VVO to guide its optimization operations.
Some SMI networks are able to meet the communication requirements for controlling voltage regulators and capacitors in fields. This further enhances the functions of VVO for field devices.
17.6.5 DISTRIBUTION PLANNING AND DISTRIBUTION OPERATION
Smart meters provide continuous measurements of all end customers. The system-wide time-stamped metering measurements combined with the distribution feeder model in utility GIS allow utilities to have information on load profiles at various levels or at any point along feeders.
This important component greatly elevates the quality of capital and investment planning activities, particularly in the following areas:
• Area reinforcement projects
• Station expansion and modification projects
• Distribution system improvement and capital investment
• Load interconnection projects
• Independent power producer interconnection projects
In distribution planning, feeder load profile measurements are very important information to support decision making in remote capacitor bank switching along a feeder, distribution automation scheme development, and load balance among phases, feeders, and substations to optimize system performance and defer capital investments.
The annual load profiles in feeders, and, through summation, in station transformers/busbars enable utilities to apply probabilistic planning [10] in substation and system planning based on actual measurements, equipment condition monitoring, and risk analysis. Ignoring the probabilistic nature of power system behaviors, traditional “N-1” planning often results in overbuilt or underbuilt system capacities. Probabilistic planning can be used to optimize system capacity investment based on required performance criteria.
In distribution operations, the feeder load profile measurements provide not only the real-time information for DMS but also sufficient information for demand-side management and demand response programs.
Smart meter measurements at customer service locations can be aggregated to obtain the load profiles of distribution transformers and substation transformers where there are no continuous telemetries. This will help asset engineers better manage the loading stress and assess the health condition of transformers for planning their replacement. Smart meters provide a quick indication of system condition changes at customer service points. Periodical alarm events from smart meters can function as warning messages to help the utility anticipate outages due to various causes, such as tree branches touching a wire.
Utilities are facing the challenge of dealing with a large volume of data caused by grid modernization projects. On the one hand, implementation of smart meters provides opportunities for utilities to make use of more online information to increase the visibility of power systems. On the other hand, it also increases difficulties in handling a huge pool of data. In other words, opportunities and challenges come together in parallel. Data analytics have become a major area of interest as utilities look to exploit the SMI. Data analytics promise to turn the “big data” problem into a benefit by improving operations and planning, reducing risk, and providing insights into customers.
Data analytics is a general term used to describe tools for turning unstructured or structured data into useful forms. It refers to the process of collecting, selecting, storing, visualizing, and modeling data, and then conducting statistical or engineering analysis of data with the aim of using the results to improve real-time and predictive modeling for utility purposes. The work associated with data analytics is often classified into grid analytics and customer analytics, and can be investigated from many different perspectives, including asset optimization, outage management, distribution management, energy theft detection, distribution system connectivity model verification, distribution system fault anticipation, call center operations, and demand response.
Conceptually, data analytics are not new to the power industry, since utilities have been applying analytics tools for many years in different aspects, such as customer segmentation, load research, and reliability analysis. However, the potential scale, sophistication, and applications in this area have been changed by the explosion in smart grid data. New analytics tools require the extensive use of advanced techniques and knowledge in computer engineering, electrical engineering, and new mathematical methods. Some data analytics use generic IT computation techniques, such as data mining, machine learning, and data processing techniques, whereas others use the methods of combined IT and power engineering knowledge.
For the majority of utilities, the growth in the amount of received information has been much faster than they expected. SMI implementation causes the number of reads for a single account to be significantly increased, from 12 monthly reads per year to at least 8760 reads with hourly intervals. This is a 730-fold increase in data points. Many utilities are actually collecting much more data from the meters for additional applications. For instance, BC Hydro in Canada, a residential smart meter with measurement attributes listed in Table 17.2, generates 3 KB each day and about 100 KB per month, and the smart meter data repository received 11 GB data per day when the number of installed smart meters reached 1.6 million [5]. The massive amount of information available can be used for far more applications than customer billing. Many utilities are now developing smart grid data analytics to transform the data into actionable information.
An essential issue in dealing with a huge pool of datasets is automatic data cleansing. Invalid data in the process of information collection and transfer are unavoidable in any data system, including smart metering systems. Missing or corrupted data can be caused by various reasons, including meter problems, communication failures, equipment outages, lost data, and unknown factors. Also, unexpected interruptions or shutdowns in power use due to strikes, unscheduled maintenance, and temporary closing of production lines can produce a significant deviation from a usual load pattern and do not repeat regularly, resulting in the related load data records being unrepresentative of actual usage patterns. Automatic data cleansing that aims at identifying and repairing outliers in raw datasets is an extremely important task in data analytics. Some effective methods and computer software have been successfully developed in this regard [11,12,13,14]. This topic is discussed in Chapter 16.
17.7.2 AN EXAMPLE OF SMART METER DATA ANALYTICS
This section describes an example of a data analytics tool developed for detecting and correcting distribution system topology errors in a utility GIS system [15].
Power companies use the enterprise GIS to keep an inventory of distribution system assets and information on their topological connections. There may be topology errors in the existing enterprise GIS records of the distribution system, including wrong geographical locations of assets, mismatching asset parameters, and incorrect network connectivity. These errors have a significantly negative impact on asset management, asset maintenance, outage response, system operations, system planning, and workforce safety.
Traditionally, utilities organize and commit dedicated resources, either by line inspection patrols or by leveraging the PLC technology or the clock-based phasor measurement technology of the global positioning system to detect and correct the topology errors. However, these initiatives require a lot of time and resources, and thus are not cost effective.
Smart meter data analytics has been proven to be an efficient and effective tool to detect and correct distribution system topology errors in existing GIS records. It is achieved by combining both power system analysis knowledge and statistical analysis techniques.
Distribution systems are mainly designed to operate in radial topology. Due to load uncertainties and load variations, distribution voltage profiles have the following characteristics:
• Voltage profiles for different feeders are different, since the associated load profiles are different.
• Voltage phase imbalances are common within the same distribution feeder.
• The voltage level (magnitude) decreases in the downstream direction along the feeder.
• Loads vary and impact each other across the system. Loads tend to have similar or well-correlated voltage profile patterns if they are connected to the same network branch or source. The shorter the electrical distance between two loads, the more similar their voltage profiles are; the further away the two loads are from each other, the greater is the diversity (or the lower the correlation) of their voltage profile patterns.
With these logics in mind, the data analytics tool calculates the correlation coefficients and relative magnitude levels of customers’ hourly voltage profiles, and identifies the customers that were incorrectly placed in the GIS network topology. Further correlation analysis and voltage magnitude profile comparison with information from neighboring meters for nearby transformers enables the algorithm to reposition the misplaced meters into the correct positions in the network tree. In other words, the algorithm corrects the errors and creates a correct distribution network topology tree. The algorithm includes the following steps:
1. Calculate the voltage profile VPCj at the point of coupling PCj for each meter j, based on the service wire impedance, hourly voltage, and energy measurements for a continuous period (e.g., 1–2 weeks).
2. Carry out statistical correlation analysis of the voltage series of all meters in a defined geographical area, which includes all meters on the same transformer and neighboring transformers within identified proximity. The result is an N ⨯ N correlation matrix that indicates the correlation coefficients denoted by corr (VPCj, VPCi) with i,j = 1, …, N, where N is the total number of meters considered in the analysis.
3. Use the computed correlation matrix to assess the electrical distance between each pair of meters. The meters with the highest correlation are expected to be direct neighbors, either due to sharing the same point of coupling, or due to being directly downstream or upstream from each other. The greater the electrical distance, the smaller the correlation coefficient is expected to be. Furthermore, the magnitude of VPCj indicates the meter’s downstream/upstream position in comparison with other nodes in the distribution network topology tree. If both the correlation and magnitude of voltage profiles conform to the network topology recorded in GIS, then the network topology is expected to be correct.
4. If an anomaly is found by a comparison with the existing connection relationship recorded in GIS, for instance, if VPCj has a relatively low correlation with its neighboring meters on the same transformer, this indicates that meter j may have been connected to a different transformer. The strongest correlation among all the evaluated meters should identify its actual neighbors with the shortest electrical distance in the system. Once the VPCj profile pattern identifies a specific meter group to which the meter belongs, its voltage magnitude can be used to position the meter into the correct location on the network branch.
With this approach, the correct network topology in GIS can be reconstructed after a topology error has been detected and corrected.
Utilities are facing serious problems with aging assets, lack of skilled workforce, and lagging in advanced IT applications. All these factors have encouraged utilities to look for advanced technologies. SMI has been the one of the hottest technologies, due to the tremendous advancement in electronic manufacturing and telecommunication technologies in the last two decades and the huge technical and economic benefits it can generate. Driven by regulation requirements, many utilities are implementing and planning SMI deployment in order to realize business transformation. This chapter provides an overview of SMI technologies, current implementation situations, and its major components, including smart meters, wide area communication network, MDMS, and HAN. Following a summary on the benefits of SMI and its relation to smart grids, this chapter also discusses the major applications of SMI in distribution system planning, analysis, and operations, and smart meter data analytics with a real‐world implementation example in correcting distribution network topology errors.
1. Advanced Metering Infrastructure, National Energy Technology Laboratory, February 2008.
2. Smart Meter 2012, Chartwell Inc., August 2012.
3. AMI Technology Trials Report, Department of Primary Industries, November 2007, Australia.
4. W. Luan and W. Cross, BC Hydro’s path to a modern grid, Transmission and Distribution World, 63(10), 26–33, 2011.
5. W. Luan, D. Sharp, and S. LaRoy, Data traffic analysis of utility smart metering network, in Proceedings of 2013 IEEE Power Engineering Society General Meeting, 21–25 July 2013, Vancouver, BC.
6. NIST Special Publication 1108, NIST framework and roadmap for smart grid interoperability standards, Release 1.0. Office of the National Coordinator for Smart Grid Interoperability, January 2010. Available at: http://www.nist.gov/public_affairs/releases/upload/smartgrid_interoperability_final.pdf.
7. W. Luan, D. Sharp, and S. Lancashire, Smart grid communication capacity planning for power utilities, in Transmission and Distribution Conference and Exposition, IEEE PES, pp. 1–4, April 2010, New Orleans, LA.
8. Itron, Meter data management: A key to the utility of the future, http://www.itron.com/, December 2012.
9. N. Markushevich and W. Luan, Achieving greater VVO benefit through AMI implementation, in IEEE Power and Energy Society General Meeting, 24–29 July 2011, Detroit, MI.
10. W. Li, Probabilistic Transmission System Planning, Wiley-IEEE Press, Hoboken, NJ, 2011.
11. J. Chen, W. Li, A. Lau, J. Cao, and K. Wang, Automated load curve data cleansing in power systems, IEEE PES Transactions on Smart Grid, 1(2), 213–221, 2010.
12. Z. Guo, W. Li, A. Lau, T. Inga-Rojas, and K. Wang, Detecting X-outliers in load curve data in power systems, IEEE Transactions on Power Systems, 27(2), 875–884, 2012.
13. Z. Guo, W. Li, A. Lau, T. Inga-Rojas, and K. Wang, Trend based periodicity detection for load curve data, in Proceedings of 2013 IEEE PES General Meeting, 21–25 July 2013, Vancouver, BC.
14. J. Chen, A. Lau, K. Wang, and W. Li, Load analyzer: A software tool for load data analysis, in Proceedings of 2010 CIGRE Canada, 17–19 October 2010, Vancouver, BC.
15. W. Luan, J. Peng, M. Maras, and J. Lo, Distribution network topology error correction using smart meter data analytics, in Proceedings of 2013 IEEE Power Engineering Society General Meeting, 21–25 July 2013, Vancouver, BC.