
Integrating Consumer Advance Demand Data in Smart Grid Energy Supply Chain |
|
CONTENTS
11.2 Smart Grid Technology: The State of The Art
11.2.1 Distribution Automation
11.2.2 Distributed Energy Generation and Integration
11.2.3 Optimal Asset Management
11.2.4 Advanced Metering Infrastructure
11.3 Principle of Virtual Energy Provisioning
11.3.1 Revisiting Manufacturing Supply Chain Model
11.3.2 Virtual Energy Supply Chain Model
11.4 System Architecture and Operational Conditions
11.5 Benefiting Operation of Smart Grid System
11.5.1 Facilitating Operation of Distributed Generation Systems
11.5.2 Optimizing Asset Management
11.5.3 Enhancing Load Forecasting
11.5.3.1 Discrete Bayesian Prediction
11.5.3.2 continuous Bayesian prediction
11.5.3.3 Bayesian Prediction with Normal Distributions
11.6 Consumer Performance Assessment
11.6.1 Minimizing Mean Square Error
11.6.2 Composite Performance Assessment Metrics
11.7 Communications and Automation Technology
11.8 System Preliminary Design
Smart grids are enabling technologies featuring high reliability, self-healing, full controllability, and optimal asset management. By combining intelligent control algorithms with advanced communication and information technology, smart grids allow utility suppliers to manage and control energy generation and distribution in real time. As such, the network security, reliability, and efficiency are significantly improved, benefiting all stakeholders, including generators, distributors, marketers, and end consumers. A key technology for smart grid deployment is demand-side management (DSM) technology. Leveraging communication and information technology, the purpose of DSM is to allow consumers to directly participate in the grid operation through various means such as load shifting, direct load control, dynamic pricing, and other demand response programs.
This chapter will introduce a novel DSM concept, virtual energy provisioning (VEP), to manage the energy supply chain from generation to delivery and final consumption. In a manufacturing supply chain system, the production typically is driven by advance demand information from the retailers or end customers. Similarly, the power system can be treated as an energy supply chain system in which the decision on electricity generation and distribution is made based on the consumption of end consumers. However, existing energy systems usually do not take into account the consumers’ advance demand information. In other words, electricity is generated according to forecasts based on historical consumption. Since consumers are the ultimate decision makers regarding future consumption, it is imperative for the utility supplier to let consumers participate in the forecasting process. To that end, we propose an online VEP system in which consumers are able to provide advance demand information so that better and more realistic forecasts can be made by the utility supplier. The utility company, after aggregating consumers’ advance demand data, can decide on an optimal generation and distribution scheme. This chapter will discuss the VEP concept, the operational condition, and the preliminary implementation.
The remainder of the chapter is organized as follows. Section 11.2 provides an overview on recent advances in smart grid initiatives, including DSM technology. Section 11.3 describes the principle of the VEP concept. Section 11.4 explains the operational condition of the VEP system. In Section 11.5, the system benefits will be discussed, focusing on asset management and distributed generation (DG) integration. Section 11.6 elaborates on the consumer performance assessment metrics. Section 11.7 investigates modern communication technology and its impact on VEP implementation. In Section 11.8, the preliminary implementation is presented. Section 11.9 concludes the chapter with some remarks on future research.
11.2 SMART GRID TECHNOLOGY: THE STATE OF THE ART
Smart grids are enabling technologies aiming to resolve major challenges arising from increased energy demands, the aging utility infrastructure, and growing concerns over the use of fossil fuels. Smart grids have been characterized or defined by many organizations as Intelligent Grid (or Intelligrid) or Future Grid [1]. In order to build intelligent features into the existing electric network, a comprehensive technological suite comprised of real-time monitoring, forecasting, decision making, controls, and optimization algorithms is necessary [2]. From the implementation perspective, smart grid technologies include (1) distribution automation; (2) distributed energy generation and integration; (3) optimal asset management; (4) advanced metering infrastructure (AMI); and (5) DSM. In conjunction with the deployment of information technology and telecommunication networks, smart grids allow utility companies to monitor and optimize the production and distribution of electric energy in real time. As a result, the system, reliability, power quality, and energy efficiency are consistently guaranteed, benefiting all the stakeholders, including generators, utilities, market traders, and end consumers.
11.2.1 DISTRIBUTION AUTOMATION
Distribution automation (DA) includes monitoring, control, and communication functions located on the electrical feeder [1]. Protection and switching functions are among the most important aspects when we design an effective DA mechanism. Nowadays, various intelligent DA devices have been deployed in distribution lines to track current and voltage states, exchange device information, and reconfigure the network to meet the changing environment. The topology in a smart grid is anticipated to be more flexible and adaptive, allowing the reconfiguration of the topology upon the occurrence of faults, excessive load demands, and malicious attacks.
Another important DA feature is automated fault diagnosis by monitoring the grid fault, identifying the root cause, and restoring the system. Automated fault and root-cause identification has also been investigated using cause–effect network, fuzzy rules, artificial intelligence, or Bayesian inference [3,4,5]. The deployment of wireless sensor networks, distributed actuators, and ubiquitous communication technologies on smart grids would generate more accurate real-time data about the system states, making automated fault diagnoses feasible and applicable in future grids.
11.2.2 DISTRIBUTED ENERGY GENERATION AND INTEGRATION
DG produces and supplies electricity from many small energy sources, which are often referred to as distributed energy resources (DERs). Typical DER units include wind turbines, solar photovoltaics (PV), fuel cells, microturbines, and internal combustion engines. The capacity of a DER unit ranges from 3 kW to 10 MW, while the capacity of a centralized generation unit usually exceeds 500 MW. Since energy generated from DER units is often consumed locally, there is no need to build long transmission lines to transport the electricity to end consumers, reducing costs significantly.
Wind power and solar PV emerge as sustainable energy resources to meet the increased electricity demand in the next two decades. It is anticipated that by 2030 about 20% of US electricity will be supplied from wind turbines, compared with the current 2% market share [6]. However, wind and solar energies are quite intermittent, and the power output depends on the weather conditions, the geographical location, and the season of the year. The techniques for integrating renewable energy resources into the distribution networks have been extensively studied in the literature, with the objective of designing robust and adaptive DG systems. For a comprehensive survey, readers are referred to [7].
11.2.3 OPTIMAL ASSET MANAGEMENT
The strategy of asset management can be perceived as a process to maximize the return on investment of the equipment over its life cycle [8]. Decision makers often leverage operations research and probability theory to identify the best asset management strategy that maximizes the long-term profits or minimizes the equipment life-cycle cost. Utilities have aggressively devised various asset maintenance strategies to monitor, predict, and extend the remaining useful lifetime of the equipment [9,10]. Advanced sensory technology combined with data mining provides ample opportunities to characterize and forecast the remaining useful life of wind turbines, solar PV, and transformers [11,12]. In smart grids, more intelligent sensors will be built into the equipment to monitor the performance parameters so that condition-based maintenance will be carried out immediately before the occurrence of equipment failures.
11.2.4 ADVANCED METERING INFRASTRUCTURE
Communication systems play a pivotal role in transmitting metering data, publishing price information, and sending grid protections and control commands. Power line communication, broadband Internet, and wireless meshes are three mainstream communication technologies currently used in the power industry. Ostertag and Imboden [13] propose a hybrid power line communication system to support both the DA and the DSM functions using a priority-based medium access protocol. In [14], it is reported that Texas New Mexico Power is using AT&T’s digital wireless cellular network to collect metering data from 10,000 residential smart meters.
Debates still continue with respect to the selection of communication infrastructures for AMI deployment. Power line communication has been demonstrated to be a reliable and secure communication technology, yet the transmission rate is quite limited. Internet-based AMI systems seem very promising because of the maturity of the technology and the ubiquity of network infrastructure. The concern with the Internet is reliability, security, and robustness when faced with high-volume metering transmission and malicious cyberattacks.
DSM is the key to the effective implementation of the smart grid concept. The purpose of DSM is to develop and deploy new technologies for achieving power efficiency, energy conservation, and demand responsiveness. Many studies have been published to explore various types of DSM concept along with the implementation technology. These technologies include optimal usage scheduling [15], load shifting [16], direct load control [17], dynamic pricing [18], and smart metering and appliances [19], among others. In [20], Zhong et al. reviewed the successes and challenges during the deployment of DSM technology in China, one of the fastest-growing countries in the world in terms of energy consumption.
Dynamic pricing such as real-time pricing (RTP) and time-of-use (TOU) encourages consumers to alter their energy usage patterns in order to reap financial benefits. The implementation of AMI makes dynamic pricing possible. Recently, many studies have been carried out to evaluate the impacts of dynamic pricing on electricity consumption patterns. For a comprehensive review, interested readers are referred to [21]. These methods usually apply game theory or develop financial incentives to guide consumers to reach a delicate balance between generation and consumption in peak hours.
11.3 PRINCIPLE OF VIRTUAL ENERGY PROVISIONING
The power system is considered healthy and reliable only when all demands are appropriately satisfied or the interruption is kept at a minimum level. It is almost impossible to find a global optimal algorithm to control such a complex and dynamic system based on today’s knowledge [2]. One viable approach is to leverage information technology and proactively collect future demand information from consumers. The utility company, after analyzing and aggregating consumers’ advance demand information, decides an optimal generation and distribution scheme to meet their actual needs. In fact, the idea of consolidating consumers’ advance demand information is not new in the literature. In a manufacturing setting, the production and distribution of goods are often driven by advance orders placed by end customers or retailers. However, it is quite novel when this order-then-production or make-to-order concept is extended and applied to the energy industry. In the following, we describe an Internet-based demand management system, called On-line Purchase Electricity Now (OPEN) system, which is genially proposed in [22]. Through the OPEN system, consumers are able to send advance demand information to the utility supplier before they actually consume the electricity.
11.3.1 REVISITING MANUFACTURING SUPPLY CHAIN MODEL
Figure 11.1 depicts a typical manufacturing supply chain system comprising customer orders, production, inventory, and delivery process. Obviously, the supply chain is driven or pulled by customers’ advance demand information. Upon receipt of customer orders, the manufacturer starts to produce the necessary goods to meet the demand. The inventory is widely used in manufacturing industries for temporarily storing finished goods before they are shipped to the retailers or end customers.

FIGURE 11.1 Manufacturing supply chain driven by customer orders.
An inventory usually involves three decision variables: the order quantity, the stocking level (i.e., quantity of goods), and the lead time. The lead time is the time interval between the arrival of the order and the instance of receiving the finished goods by the customer. Obviously, this closed-loop product supply chain mechanism remains stable as long as the inventory is not backordered. This stability can be easily maintained and sustained as long as the lead time is sufficiently long. As such, the manufacturer has enough time to produce the goods to meet the customer demand.
11.3.2 VIRTUAL ENERGY SUPPLY CHAIN MODEL
Many similarities can be found between a manufacturing enterprise system and an energy production system. In the former, goods are produced and sold to the end customers, and the inventory is used as a buffer to mitigate any potential backorders in the presence of demand uncertainty. Similarly, electricity is generated by power plants or wind farms, and it is delivered to the end consumers via transmission/distribution lines. Power interruptions or outages will occur if the load exceeds the generation. The problem can be mitigated or partially resolved if large storage systems can be created between the generation and the distribution lines. These storage systems, such as inventory systems, provide backup electricity to end consumers when the load exceeds the generation. At present, research is under way to develop efficient conversion or large storage technologies using flying wheels, batteries, and supercapacitors [23]. However, commercially large and inexpensive storage systems are still not mature enough for wide-scale applications.
We propose a VEP concept to complement and enhance the physical storage technology. Conceptually, the energy provisioning system is operated as follows (see Figure 11.2). The utility company will design and implement an online database, the OPEN system, in which an individual account will be assigned to each consumer. Consumers can conveniently log on and access their web-based account via desktops, laptops, and mobile devices. The system allows consumers to place demand orders based on expected needs. These orders, representing future electricity demand, can be specified on an hourly, daily, weekly, or monthly basis. The utility company, after aggregating all consumers’ orders, can decide an optimal generation and distribution scheme to meet the consumers’ needs. Just like a manufacturing supply chain system, this managed order-then-generation system is able to deliver the required electricity to the end consumers in a timely and reliable manner. In Section 11.6, various incentive programs are devised to motivate the consumers to place orders and then consume exactly the amount of energy that they ordered.

FIGURE 11.2 Generation-then-consumption versus order-then-generation.
The VEP model aims to achieve the same objective as the physical storage system, by delivering reliable and secure energy to end consumers. However, VEP does not store the electricity in physical media such as batteries or capacitors; rather, it leverages information technology to solicit advance demand information from consumers. The lead time between the demand order and the actual generation (i.e., consumption) allows the utility supplier to plan the optimal production scheme to meet the future need.
11.4 SYSTEM ARCHITECTURE AND OPERATIONAL CONDITIONS
The OPEN system is a realization of the VEP concept described in the previous section. The OPEN system will be built on a hybrid architecture integrating existing utility infrastructure with the Internet platform. Figure 11.3 depicts a conceptual configuration of the hybrid architecture, duplicated from [22]. Given the ubiquitous Internet technology, the deployment of the OPEN system only requires several cost-effective software programs and hardware components. Software programs include an online database, a data mining engine, and a decision-making tool. The purpose of the database is to collect the demand information from end consumers as well as to store the actual consumption transmitted by the smart meter. The data mining engine is capable of forecasting the future load condition by combining consumers’ orders with their historical consumption. The decision-making tool synthesizes the information and determines the optimal generation and distribution scheme.

FIGURE 11.3 A hybrid architecture for OPEN system implementation. (From Jin, T. and Mechehoul, M., IEEE Transactions on Smart Grid, 1, 302–310, 2010.)
The major hardware component is the smart meter, which transmits the data from the consumer site to the utility supplier. The consumption data are primarily in a short message or packet format, representing hourly or daily energy consumption by the consumer. Since the transmission of the discrete data is not time-critical, transmission control protocol/Internet protocol (TCP/IP) should be sufficient and reliable enough to undertake the communication task. Research [13,14] shows that such a communication function will be relatively easy to implement by directly integrating the smart meter with the Internet system or the wireless meshes.
Consumer participation is the key to the effective operation of the OPEN system. Various incentive packages can be developed so that consumers will participate in the program and provide demand information. Fahrioglu and Alvardo [24] show that financial incentives, when appropriately implemented, will motivate consumers to participate in the energy management system. For example, monetary discounts or energy credits could be used to reward the consumer whose demand order is equal or close to the actual consumption. In addition, the supplier can design customized usage portfolios to accommodate different users’ consumption behaviors. These incentive programs can be easily posted and distributed to individual consumers via the online database system.
Another assumption is that dynamic pricing, such as TOU or RTP, is an effective tool to influence and guide the consumer’s usage behavior. Studies [19,25] have shown that dynamic pricing is an effective tool to control and minimize demand uncertainty. Like an adaptive controller, dynamic pricing establishes a closed-loop feedback between the suppliers and their consumers, and brings the actual demand close to the generation via game theory [26]. Eventually, a long-term balance between generation and consumption is reached.
11.5 BENEFITING OPERATION OF SMART GRID SYSTEM
The utility supplier is able to gain substantial benefits from the deployment of the OPEN system. These benefits include (1) facilitating the integration and operation of DG systems; (2) optimizing asset management; and (3) improving demand forecasting. These benefits will be explained in the following paragraphs, and, for more detailed discussions, readers are referred to [27].
11.5.1 FACILITATING OPERATION OF DISTRIBUTED GENERATION SYSTEMS
Wind turbines and solar PV have emerged as clean and sustainable resources to meet growing electricity needs in the next 20–30 years. These renewable technologies, however, are quite intermittent due to the stochastic nature of wind speed and solar irradiation. Integrating renewable energy into existing power grids potentially creates additional uncertainty on top of the load variability. When planning and operating DG systems, the uncertainties in power generation and load profile must be taken into account at the same time. Otherwise, the grid reliability and stability could be jeopardized, as more variable energy resources are penetrating into the electricity market.
The OPEN system can play a substantial role in managing DG systems. Built upon the order-then-production principle, the OPEN system is capable of collecting and consolidating consumers’ future demands ahead of time. The lead time allows the utility supplier to perform demand predictions, plan optimal generation, and determine distribution schemes. Proactive measures can be adopted in advance to avoid the occurrence of power outage or interruption due to lower wind speed or cloudy weather. In this case, the OPEN system serves as an advance information system that allows the supplier to acquire future load conditions to mitigate the power uncertainty in renewable energy resources.
11.5.2 OPTIMIZING ASSET MANAGEMENT
The OPEN system creates a truly interactive environment in which the supplier and the consumers can engage in real-time communications. The system is quite beneficial in situations when a sudden change in demand occurs, such as a family leaving for a long vacation or a surge in energy demand due to manufacturing ramp-up. Consumers can easily send their reduced or increased energy demand information through the OPEN system.
The OPEN system facilitates the deployment of plug-in hybrid electric vehicles (PHEVs) or other electrical apparatus across the grid system. Charging a PHEV means pumping 20–40 kWh electricity from the grid within 2–4 h, causing a significant impact on the stability of the distribution grid [28]. Functions can be built into the OPEN system that allow PHEV users to notify utility suppliers when and where the charging will be performed, and how much energy will be needed. This allows the supplier to take the necessary measures to mitigate the impact of charging on the local distribution network.
The OPEN system can assist utility companies in optimizing the asset maintenance time based on consumers’ demand information. Maintenance activities on transformers, power lines, and other utility facilities can be carried out at times when the consumers’ demands are relatively low, based on their placed orders. If an urgent repair must be performed in a timely manner, the supplier can notify the affected consumers about the pending repair actions by broadcasting the message through the OPEN system. Consumers can then temporarily stop or reduce their energy usage to streamline the maintenance activity.
11.5.3 ENHANCING LOAD FORECASTING
Utility companies are able to perform more realistic load forecasting, as they can combine historical data with advance demand orders. Bayes’ theorem is capable of synthesizing historical usage with advance orders to estimate the future load. Although the theorem has been widely used in various domains, its application in the power industry for predicting future consumption is relatively new. Some studies [29,30] have reported construction of the prediction model using Bayes’ theorem. These works primarily focus on the utilization of Bayes’ theorem to obtain a better model structure.
In the OPEN system, the Bayesian forecasting model is adopted to predict future electricity demand without making any assumptions about the model structure. The probability function representing historical usage is referred to as the prior distribution, and the probability function representing future consumption is called the posterior distribution. As shown in Figure 11.4, Bayes’ theorem allows us to directly estimate the posterior distribution by synthesizing the prior information with the demand orders. Two Bayesian prediction methods are available: discrete Bayesian and continuous Bayesian models. In the former, the prior and the posterior distributions are represented by discrete probabilities. In the latter, continuous probabilities are used to model the prior or the posterior distribution or both.
11.5.3.1 Discrete Bayesian Prediction
The discrete Bayesian model can be applied in situations in which the demand data are characterized by attributes, or categorical data. The mathematical expression for the model is given in Equation 11.1:
(11.1) |
where:
k |
is the total number of events or categories |
P{Xi} |
is the prior probability for Xi with i = 1, 2, …, k |
P[Y|Xj} |
is the conditional probability for consuming Y given Xj |
P{Xi|Y} |
is the posterior probability for Xi given Y |
The following example, taken from [27], is used to explain the application of this model. Table 11.1 lists the daily energy consumption of a consumer over 15 days. The actual consumption of energy, denoted as X, is listed in the second column, while the forecast or ordered quantity, Y, provided by the consumer is shown in the last column. For example, on Day 10, the consumer’s original order is 13 kWh, while the actual consumption is 14 kWh on that day.

FIGURE 11.4 The Bayesian forecast process.
TABLE 11.1
Daily Energy Usage versus Prediction
Day |
Actual Usage (X) (kWh) |
Consumer Order (Y) (kWh) |
1 |
10 |
11 |
2 |
11 |
12 |
3 |
13 |
12 |
4 |
13 |
14 |
5 |
12 |
12 |
6 |
11 |
10 |
7 |
10 |
12 |
8 |
14 |
14 |
9 |
14 |
12 |
10 |
14 |
13 |
11 |
12 |
13 |
12 |
14 |
13 |
13 |
12 |
11 |
14 |
12 |
12 |
15 |
11 |
11 |
TABLE 11.2
Conditional Probability of P{Y|X}

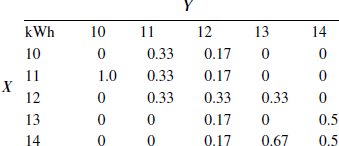
From Table 11.1, we can easily compute the prior probability for X, and the result is given as P{X = 10, 11, 12, 13, or 14} = {0.13, 0.20, 0.27, 0.13, or 0.27}, respectively. Using Equation 11.1, we are able to estimate the conditional probability for Y given X by using the data in Table 11.1, and the results are summarized in Table 11.2. For example, P{Y = 13|X = 14} = 0.5, as shown in the last row. Now the posterior probability for X can be extrapolated based on Table 11.2 along with the prior probability of X. The result is summarized in Table 11.3. For instance, the last row of the table shows P{X = 14|Y = 13} = 0.67, meaning that the probability of consuming 14 kWh electricity is 0.67, given that the consumer’s order is 13 kWh.
Given the consumer’s order, we can, further, compute the conditional mean demand and the variance based on the conditional probability in Table 11.3. For instance, if the consumer’s order quantity is Y = 13 kWh, then the conditional mean demand and its variance can be estimated as
TABLE 11.3
Posterior Probability of P{X|Y}
(11.2) |
(11.3) |
This numerical example, though relatively simple, clearly demonstrates how the discrete Bayesian inference model can be utilized to predict consumers’ actual consumption by synthesizing the historical data with their demand perspectives.
11.5.3.2 continuous Bayesian prediction
If the actual consumption data are continuous and the demand order is placed in a discrete format, forecasting can be performed by using the Bayesian model for density functions:
(11.4) |
When both X and Y are represented by continuous density functions, the Bayesian prediction model can be expressed by
(11.5) |
where:
X |
is the actual consumption, a continuous random variable |
Y |
is the consumer demand order, a discrete random variable |
P{Y} |
is the probability for Y |
fX(x) |
is the prior distribution for x |
fX(x|Y = y) |
is the probability density function for x given y |
P{Y|X = x} |
is the conditional probability for Y given x |
fY(y) |
is the marginal distribution for y |
fx,Y(x, y) |
is the joint distribution for x and y |
fY|X(y|x) |
is the conditional density function for y given x |
fX|Y(x|y) |
is the posterior density function for x given y |
The likelihood function fY|X(y|x) can be derived from consumers’ previous orders along with their actual consumption. All other notations are the same as in Equation 11.4.
11.5.3.3 Bayesian Prediction with Normal Distributions
Normal distributions are often used to represent random electricity loads [31]. If X and Y follow the normal distributions with , their joint density function is given as
(11.6) |
where ρ is the correlation coefficient with -1 ≤ ρ ≤ 1. By substituting Equation 11.6 into Equation 11.5, the posterior distribution for X is given as
(11.7) |
In summary, Bayes’ theorem is able to combine historical usage with the demand order to predict the future load. The discrete Bayesian model is preferred if the consumer usage and order are specified in discrete format. The continuous distributions are more appropriate in applications in which the consumption and demand data are expressed as continuous variables.
11.6 CONSUMER PERFORMANCE ASSESSMENT
Incentive programs are implemented to encourage consumers to participate in the OPEN system and place demand orders via their online accounts. Prior to constructing incentive programs, it is important to define the performance metrics in order to assess the quality of orders. One reasonable approach is to compare the difference between the order and the actual consumption. Then various financial incentive programs can be implemented, based on whether the actual usage matches the original order. The following set of performance measures to assess the quality of orders is based on [32].
11.6.1 MINIMIZING MEAN SQUARE ERROR
Minimum mean square error (MMSE) is often used to measure the difference between the prediction and the actual result. Let xi be the actual consumption and yi be the demand order for time ti; MMSE can be computed as
(11.8) |
where m is the sample size. A small MMSE indicates that actual consumption closely matches the demand order. Obviously, energy credits or monetary discounts should be used to reward the consumer who maintains a small MMSE over the consumption horizon.
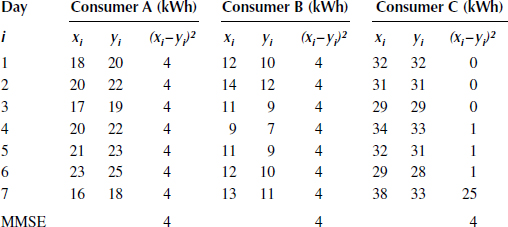
MMSE is a simple statistical tool, which can be easily implemented in the OPEN system. However, MMSE cannot effectively capture the discrepancy between xi and yi for a particular time. In other words, consumers with the same MMSE may have a very different usage profile. Table 11.4 shows a list of 7-day energy orders versus the actual usages collected from three consumers. All consumers have the same MMSE = 4. The variation for consumer C on Day 7 is more pronounced than those of A and B. In addition, the actual computation for A is consistently smaller than the order, while the actual consumption for B is consistently larger than the order. Therefore, additional metrics are required to capture the consumer performance variations.
11.6.2 COMPOSITE PERFORMANCE ASSESSMENT METRICS
Three major factors need to be considered when we perform the assessment on the quality of the demand order: (1) the mean error between the order and the actual consumption; (2) the variation between the order and the consumption; and (3) the largest deviation across the entire period. Based on these criteria, the following composite metrics are proposed:
TABLE 11.4
Demand Order versus Actual Consumption
(11.9) |
(11.10) |
(11.11) |
These metrics form a set of composite assessment instruments to address the concerns raised previously. q1 calculates the mean error between the order data and the actual usage. The result is able to indicate whether the order is always below or above the actual usage. q2 measures the deviation between the order and the actual usage. q3 identifies the largest discrepancy between xi and yi for all i. All these performance metrics have a simple analytical form, and together they are able to assess consumer performance by simply comparing the advance demand order and actual usage data.
The following example, taken from [32], is used to demonstrate the application of the performance assessment instrument. Three sets of 15-day orders from three consumers have been collected and listed in Table 11.5. The actual daily consumption is also recorded by the smart meters, and the results are also listed in the table.
Table 11.6 summarizes the performance metrics computed using Equations 11.9 through 11.11. According to the mean error q1, Consumer A overestimates the demand while B and C underestimate the needed electricity. In terms of variation, Consumer B has the smallest MMSE, meaning that the actual usage for B is close to what she ordered. Consumer A has the largest MMSE, indicating a high daily variation between the order and the actual usage. Although the MMSE for C is not the largest, the largest daily deviation occurred for Consumer C. By examining the dataset for C, we found that the difference between the order and actual usage is 7 kWh on Day 15, resulting in the largest daily discrepancy among all the consumers. These examples show that, based on the composite assessment instruments, the utility supplier is able to determine consumer performance in a fairly easy way.
Since the target value for q1, q2, and q3 is zero, the consumer performance can be easily evaluated in terms of the proximity to the target value. Based on this, various incentive packages can be devised to reward consumers who achieve good performance. In [22], a quadratic price model combining the reward function is proposed to incentivize the consumer to participate in the OPEN system. The model allows a consumer to save up to 30% of the monthly bill if all performance metrics meet the targets. Notice that other options are available, and they can be built into the reward functions. Interested readers are referred to [33,34].
TABLE 11.5
Demand Order versus Actual Consumption
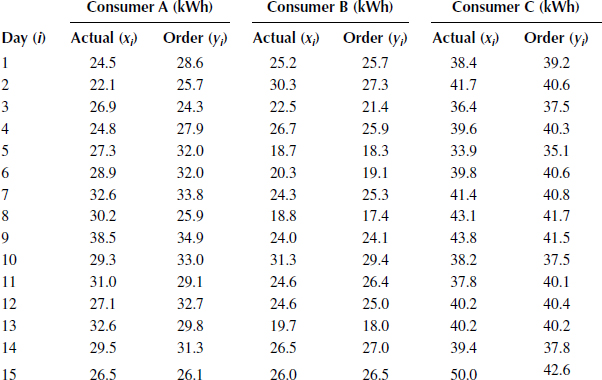
TABLE 11.6
Performance Assessment for Three Consumers
Metrics |
A |
B |
C |
Target Value |
q1 |
−1.0 |
0.5 |
0.5 |
0 |
q2 |
11.4 |
1.7 |
5.0 |
0 |
q3 |
32.0 |
9.3 |
54.8 |
0 |
11.7 COMMUNICATIONS AND AUTOMATION TECHNOLOGY
To help utility companies and consumers to generate a power usage profile, the actual power consumption has to be measured and available to both the utility company and the consumers. There are many advantages if the real-time power consumption is available:
• The transparency of power usage between utility companies and consumers is increased. Hence, the utility companies have a better understanding of consumers’ demand.
• The utility companies can schedule their power supply according to consumers’ demand. Thus, the power generation cost can be reduced and pollution can be decreased.
• Consumers will be aware of their real-time power usage rather than obtaining a monthly utility bill, or at even longer intervals. Thus, their power consumption can be altered and controlled.
• If dynamic pricing is available, consumers can schedule their power consumption according to the price profile. For example, they can schedule their washing machine when the price is lowest if they are not in a hurry to wash their clothes.
To measure the actual power consumption and make it available to both utility companies and consumers, smart meters and data communication networks have to be implemented. Since the Ethernet is widely used at both consumer sites and utility companies, using the existing communication infrastructure reduces the infrastructure cost and eliminates many implementation-related issues. Figure 11.5 shows a power consumption data collection and distribution scheme.
In Figure 11.5, the local smart sensors form a local network. The local servers are installed at the consumer sites. The utility servers are installed at the utility companies. As computers are becoming more powerful and have many different built-in interfaces, such as wireless, Ethernet, USB, and serial ports, it is convenient to connect the smart sensors with different communication interfaces to the computers at the consumer sites. Therefore, there are many possible ways for the local smart sensor network to communicate with the local server. The local servers exchange the data with the utility servers via Ethernet. The main reason for isolating the smart meters with their network from the local servers is security considerations. As the smart sensor network becomes more complex, network security will become a major issue in the near future. Since the local servers and the utility servers in the utility companies are connected via Ethernet, they can communicate with each other without sacrificing the security of smart meters.
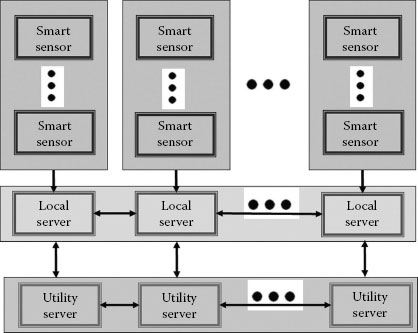
FIGURE 11.5 A sensor network interconnecting utility companies with consumers.
As the amount of data collected increases with time, servers require vast storage capacity, especially in the utility companies, because there are many smart meters connected via the local servers. There are several problems with storage of vast amounts of data: (a) extra hardware is needed to save the data; (b) data mining is becoming more difficult; and (c) the processing time is becoming longer. To deal with these problems, distributed data storage and processing techniques are being developed to reduce the amount of data transmitted to the utility servers.
Under the distributed processing framework, data from each smart meter are collected and saved in the smart meter, if it has a storage device, or in the local server. Since the storage capacity of a smart meter is typically limited, the data should be transferred to the local server for storage. As the local server is only connected to one or several local smart meters, the storage capacity of a local server should be large enough to store the data from the local smart meters. After the data are transferred to the local server, they are processed to reduce the data size. Here we propose a B-spline curve-fitting method. Suppose we have m power consumption data points Pi (i = 1, 2, …, m) during a cycle (e.g., 1 h or a day), a B-spline curve can be fitted to the m points:
(11.12) |
where:
t |
is the sampling time during a cycle |
S(t) |
is the B-spline curve |
Ci |
are the control points |
bi,n(t) |
is the B-spline basis function, which is defined as |
(11.13) |
For example, if a uniform cubic B-spline is used, the function can be represented as
(11.14) |
Therefore, instead of transmitting m data points, only four points are needed to represent the power consumption during a cycle if a common basis function is used. This will greatly reduce the data storage requirement and decrease the data processing time. For the local server, the control points have to be computed. Here we developed a least square method to obtain the optimal control points:
(11.15) |
After the objective function f is minimized, the control points are obtained. Since this optimization is performed in the local servers, this will greatly mitigate the data congestion issue.
11.8 SYSTEM PRELIMINARY DESIGN
Based on the concept proposed in Section 11.3, we have started system implementation in the laboratory setting. This section will summarize our preliminary designs and development of the user-friendly interface that is an integral part of the OPEN system. More detailed discussions are given in the recent work in [27].
In our VEP system, the user interface behaves like a bridge between users and service provider. Similarly to an online shopping web page, users can easily browse their historical usage data and input new usage profiles and other related consumption information, such as number of persons living in a house, appliance information, and daily activities. Hence, designing an interactive, functional, and user-friendly interface is very important. Figure 11.6 shows a web-based interface allowing consumers to specify the power capacity of major household appliances.
Our designed interface consists of four components: (1) User information. When the new user logs into the system, he or she needs to set up an account (user name and password) and input personal information, including the number of persons in the house and major appliances, for example, air conditioner model. This information will be stored in the database, and will be very useful for the OPEN system in predicting the future electricity load. The above example is taken from residential homes, but the same principle can be applied to industrial and business entities. (2) Visualization. In order for consumers to plan well, it is necessary for them to visualize past electricity usage (e.g., hourly, daily, weekly, or monthly), usage patterns of the same period in previous years, and usage patterns of similar households. Figures 11.7 and 11.8 graphically show the daily consumption profile by apparatus type and the cumulative usage, respectively. (3) Search. The major function of the “Search” module is to help users find the electricity consumption information for their appliances, such as air conditioners or refrigerators. For example, consumers can input their refrigerator model and the search module will find the average electricity consumption of this type of refrigerator. This information will be very helpful for them to make an accurate prediction. (4) Feedback. Through the feedback component, the system will provide the user with a predicted usage amount. Consumers can also input their estimated amount and give feedback to the system. For example, based on previous usage information, the system will automatically generate an estimated demand. It is up to the consumer to modify the recommended usage and place the order through the OPEN system. If the consumer will be out of town next month, for instance, he or she can input a very small amount of electricity usage. This advance demand information, once appropriately analyzed by the data mining engine at the utility side, can be used as the baseline to plan future generation.

FIGURE 11.6 Interface for specifying power capacity of apparatus.
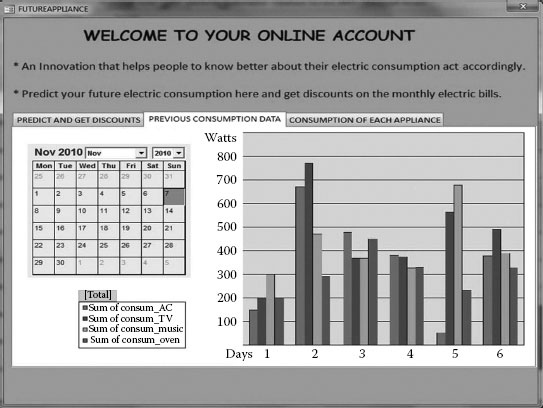
FIGURE 11.7 Consumer online account.

FIGURE 11.8 Consumer’s actual usage profile.
This chapter presented a novel DSM technology, VEP, which allows smart grid consumers to predict and order electricity via the broadband Internet as if performing an online purchasing transaction. This new energy management concept intends to shift the electricity delivery service from production-then-consumption mode to an order-then-production paradigm. The system architecture, operational conditions, and potential benefits to energy stakeholders are elaborated from various aspects, including generation, marketing, delivering, and end consumption. We also investigated several statistical instruments to assess the quality of demand orders. The purpose is to evaluate consumers’ performance and further develop incentive programs to increase their participation. The preliminary research shows that the OPEN system is technically feasible, theoretically justifiable, and financially achievable. The ultimate goal of the VEP concept is to make the consumers “order the electricity they need, and consume exactly what they ordered.” As a result, the stochastic load profile is turned into a deterministic demand curve, reducing operational uncertainty and improving system robustness. Many research opportunities will be opened up by implementing this new DSM concept. These areas include, but are not limited to, dynamic pricing, optimal generation and distribution planning, and consumer incentive management. Future efforts will be focused on software development and laboratory testing, and will eventually move to real-world applications.
1. Brown, R.E., Impact of smart grid on distribution system design, in Proceedings of the IEEE Power and Energy Society General Meeting, pp. 1–4, July 20–24, 2008, Pittsburgh, PA.
2. Venayagamoorthy, G.K., Potentials and promises of computational intelligence for smart grids, in Proceedings of the IEEE Power and Energy Society General Meeting, pp. 1℃6, July 26–30, 2009, Calgary, AB.
3. Chen, W.-H., C.-W. Liu, and M.-S. Tsai, On-line fault diagnosis of distribution substations using hybrid cause-effect network and fuzzy rule-based method, IEEE Transactions on Power Delivery, 15, 710–717, 2000.
4. Xu, L. and M.-Y. Chow, A classification approach for power distribution systems fault cause identification, IEEE Transactions on Power Systems, 21, 53–60, 2006.
5. Cai, Y. and M.-Y. Chow, Exploratory analysis of massive data for distribution fault diagnosis in smart grids, in Proceedings of the IEEE Power and Energy Society General Meeting, pp. 1–6, July 26–30, 2009, Calgary, AB.
6. US DOE, The 20% wind energy by 2030: Increasing wind energy’s contribution to the U.S. electricity supply, US Department of Energy Report, p. 7, 2008.
7. Jin, T. and J. Jimenez, A review on planning and automation for distributed generation systems, in Proceedings of Conference on Automation Science and Engineering, pp. 269–274, August 21–24, 2010, Toronto, ON.
8. Tor, O. and M. Shahidehpour, Power distribution asset management, in Proceedings of the IEEE Power Engineering Society General Meeting, pp. 1–7, June 18–22, 2006, Montreal, QC.
9. Garrity, T.F., Innovation and trends for future electric power systems, in Proceedings of the Power Systems Conference (PSC ‘09), pp. 1–8, March 10–13, 2009, Clemson, SC.
10. Gao, Z., J. McCalley, and W. Meeker, A transformer health assessment ranking method: Use of model based scoring expert system, in Proceedings of North American Power Symposium (NAPS), pp. 1–6, October 4–6, 2009, Starkville, MS.
11. Nilsson, J. and L. Bertling, Maintenance management of wind power systems using condition monitoring systems—Life cycle cost analysis for two case studies, IEEE Transactions on Energy Conversion, 22(1), 223–229, 2007.
12. Tian, Z., T. Jin, B. Wu, and F. Li, Condition-based maintenance optimization for wind power generation systems under continuous monitoring, Renewable Energy, 36, 1502–1509, 2011.
13. Ostertag, M. and Ch. Imboden, High data rate, medium voltage powerline communications for hybrid DA/DSM, in Proceedings of the IEEE Transmission and Distribution Conference, vol. 1, pp. 240–245, April 11–16, 1999, New Orleans, LA.
14. Heidell, J. and H. Ware, Is there a case for broadband utility communications networks? Valuing and pricing incremental communications capacity on electric utility smart grid networks, The Electricity Journal, 23(1), 21–33, 2010.
15. Molderink, A., V. Bakker, M.G.C. Bosman, J.L. Hurink, and G.J.M. Smit, A three-step methodology to improve domestic energy efficiency, in Proceedings of the Innovative Smart Grid Technologies (ISGT), pp. 1–8, January 19–21, 2010, Gaithersburg, MD.
16. Babu, C.A. and S. Ashok, Peak load management in electrolytic process industries, IEEE Transactions on Power Systems, 23(2), 399–405, 2008.
17. Ramanathan, B. and V. Vittal, A framework for evaluation of advanced direct load control with minimum disruption, IEEE Transactions on Power Systems, 23(4), 1681–1688, 2008.
18. Moholkar, A., P. Klinkhachorn, and A. Feliachi, Effects of dynamic pricing on residential electricity bill, Power Systems Conference and Exposition, 2, 1030–1035, 2004.
19. Sui, H., H. Wang, M.-S. Lu, and W.-J. Lee, An AMI system for the deregulated electricity markets, IEEE Transactions on Industry Applications, 45(6), 2104–2108, 2009.
20. Zhong, J., C. Kang, and K. Liu, Demand side management in China, in Proceedings of the IEEE Power and Energy Society General Meeting, pp. 1–4, July 25–29, 2010, Minneapolis, MN.
21. Zeng, S., J. Li, and Y. Ren, Research of time-of-use electricity pricing models in China: A survey, in Proceedings of the IEEE International Conference on Industrial Engineering and Engineering Management, pp. 2191–2195, December 8–11, 2008, Singapore.
22. Jin, T. and M. Mechehoul, Ordering electricity via Internet and its potentials for smart grid systems, IEEE Transactions on Smart Grid, 1(3), 302–310, 2010.
23. Kusko, A. and J. DeDad, Stored energy—Short-term and long-term energy storage methods, IEEE Industry Applications Magazine, 13(4), 66–72, 2007.
24. Fahrioglu, M. and F.L. Alvardo, Designing incentive compatible contracts for effective demand managements, IEEE Transactions on Power Systems, 15(4), 1255–1260, 2000.
25. Tsoukalas, L.H. and R. Gao, From smart grids to an energy Internet: Assumptions, architectures and requirements, in Proceedings of the Third International Conference on Electric Utility Deregulation and Restructuring and Power Technologies, pp. 94–98, April 6–9, 2008, Nanjing.
26. Guan, X., Y.-C. Ho, and D.L. Pepyne, Gaming and price spikes in electric power markets, IEEE Transactions on Power Systems, 16(3), 402–408, 2001.
27. Jin, T., L. Lu, and C. Kang, Energy management system for smart grid consumers using advance demand information, in Proceedings of the IASTED European Conference on Power and Energy Systems, pp. 300–306, June 22–24, 2011, Greece.
28. Clement-Nyns, K., E. Haesen, and J. Driesen, The impact of charging plug-in hybrid electric vehicles on a residential distribution grid, IEEE Transactions on Power Systems, 25(1), 371–380, 2010.
29. Barghinia, S., S. Kamankesh, N. Mahdavi, A.H. Vahabie, and A.A. Gorji, A combination method for short term load forecasting used in Iran electricity market by NeuroFuzzy, Bayesian and finding similar days methods, in Proceedings of the 5th International Conference on European Electricity Market, pp. 1–6, May 28–30, 2008, Lisbon.
30. Niu, L., J. Zhao, and M. Liu, Application of relevance vector regression model based on sparse Bayesian learning to long-term electricity demand forecasting, in Proceedings of the International Conference on Mechatronics and Automation, pp. 2363–2367, August 9–12, 2009, Changchun.
31. Couchman, P., B. Kouvaritakis, M. Cannon, and F. Prashad, Gaming strategy for electric power with random demand, IEEE Transactions on Power Systems, 20(3), 1283–1292, 2005.
32. Jin, T. and Y. Yu, Online virtual electricity provisioning system and its preliminary design, Automation of Electric Power Systems, 35(4), 35–40, 2011.
33. Ferrero, R.W. and S.M. Shahidehpour, Short-term power purchases considering uncertain prices, IEE Proceedings—Generation, Transmission and Distribution, 144(5), 423–428, 1997.
34. Mohsenian-Rad, A.H., V. Wong, J. Jatskevich, and R. Schober, Optimal and autonomous incentive-based energy consumption scheduling algorithm for smart grid, in Proceedings of the Innovative Smart Grid Technologies (ISGT), pp. 1–6, January 19–21, 2010, Gaithersburg, MD.