Comparison-Model Hybrid
You can also use a combination of comparison estimation and mathematical models. Even a linear model of counting User Stories depends on the estimation of whether a User Story is “story size” by comparing with past experience and other stories. A linear model using Story Points nudges the comparison-model hybrid boundary in that it uses comparison-based sizes as input to a model calculation. Even the expensive commercial parametric models depending on Function Points can be adjusted by subjective factors.
Linear Projection of Affinity Estimates
I’ve used this approach when performing long-term estimation of requirements that are being detailed iteratively. It dovetails with the Multi-Level Decomposition approach of breaking the planned work down to a few large chunks, and then breaking each of those chunks down into User Stories as time gets near to implementing them. This is a healthy agile software development practice, as it defers work until the “last responsible moment,” when the most knowledge is available.
The estimating problem is that you don’t know the number of User Stories ahead of time, so you can’t estimate long-term with fine-grained estimates. Nor do you want to do so, as discussed in Decomposing into an Unmanageable Number of Pieces.
The procedure is fairly simple. Start by Decomposing by Functionality into A Small Number of Large Parts. Use Affinity Estimation to sort these parts by perceived size and then label them with T-shirt sizes or some other non-numerical scheme. Take a rough guess as to how much bigger the items are in one grouping than those in the next smaller.
Order the parts by priority (see Ordering the Parts). You don’t have to get this perfect, but you do need to determine which part you want to build first. Split that part into smaller functional parts. If these are “story sized” then you’ve gone far enough, otherwise repeat the process followed so far, but with a different range of size names.
Once you’ve reached story sized parts, then order them by priority as well. Consider whether you need them all within the priority of this larger part. You will likely find that some of them are less urgent than some parts of the next large chunk of functionality. Split this chunk into the high-priority stories and the ones to be deferred.
Take a look at the chunk of high-priority stories. Is it still the same size category as before? If not, give it (and the deferred chunk) the appropriate size names.
Develop these high-priority stories. How long did that take? You now have some data for the time it takes for that size grouping.
If this is not the first group of stories to be completed, then compare the sizing with the others previously completed. For ones in the same grouping, does this seem close enough to the others to be the same group? Perhaps you need to split the group, or reconsider which group different chunks belong in. You have some information now that you didn’t have when you performed the original affinity grouping.
For stories in other groups, does the factor between group sizes seem right? If a “medium” chunk was estimated as twice the size of a “small,” but the time to implement is a factor of three, then consider what that might be telling you. Is this a problem with the affinity grouping or the assumed factor between groups? Or, possibly but not probably, has the rate of development changed? In general, you should assume that the same people working in the same fashion within the same context will have a pretty constant rate of progress. It could be, though, that the development team has changed significantly. Or that they’ve changed the way they’re working. Or that the context around the team has impacted their progress.
Each time you complete a chunk of work, revisit your sizing estimates. Think what the new information means and how it affects that sizing.
An Early Forecast
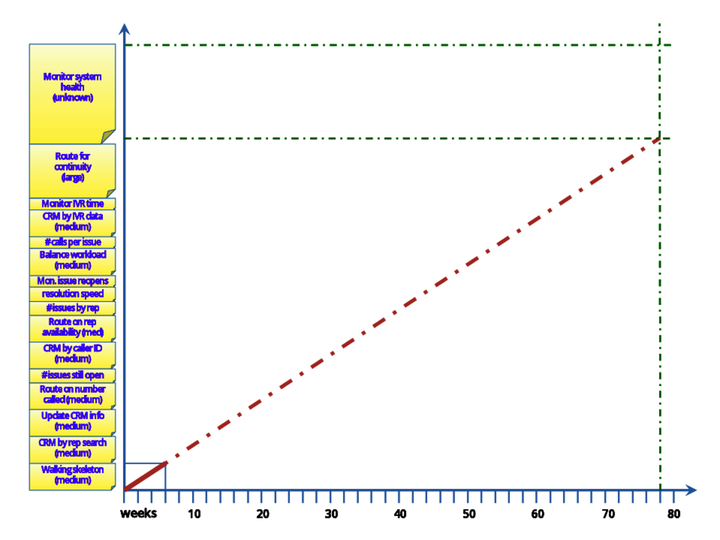
Sidney, Marion, and Blaise were in the Empire Enterprise hallway, decorating a big whiteboard outside the call center development team room. Marion and Blaise were taping cards labeled with the feature decomposition they’d made when planning the project. The cards were different heights, depending on whether the feature was deemed small, medium, or large. They’d made the "medium" cards twice the height of the "small," and the "large" twice the height of the "medium." That was, at this point, an arbitrary choice, but it was easy to measure, as shown in the figure.
Sidney had taped a horizontal line along the bottom of the whiteboard, and was now marking it at regular intervals. "Hmmm..." he muttered. "Forty intervals." Louder, he asked, "Hey Blaise, how long is 80 weeks?"
Blaise pulled out their calculator. "Just over 18 months."
"That’ll be good enough, at least for now."
Blaise drew a box corresponding to the Walking Skeleton they’d just finished developing.
Marion called out to Ryan who was approaching down the hall. "Ryan, would you take a look at the order of these features? We’ve taken our best guess at doing them from bottom to top, but it’s easy to rearrange them if you’d like."
Ryan stopped and looked at the whiteboard. "When do you need an answer?"
"No time in particular. We’ll continue next with the capability of bringing up the right customer in the CRM system by letting the rep search on various attributes. That seemed to be the most general case covering any circumstance, even if it’s not the most convenient. Beyond that, we’ll go in whatever order makes sense by that time."
Ryan watched Blaise and Sidney taping a piece of yarn on the whiteboard. "What’s that for?"
"That’s a straight line projection based on the rudimentary functionality completed so far."
"It looks like we won’t have the monitoring system to catch our current problem in over a year and a half."
"There’s a lot of uncertainty in the data, of course. The features could be bigger or smaller than shown on here. There might even be other features that take precedence over these. The rate of development is pretty uncertain, too. A lot of times there are one-time delays when starting a project. Of course, we might lose someone on the team and slow down, too. It’s all pretty loose, but it lets us visualize if we’re in the ballpark. And it shows why the order of development is an important business decision. When we have enough functionality that it’s worth putting into production, for at least one product line, we can find out how well it works for you. And that’ll be a lot sooner than 18 months."
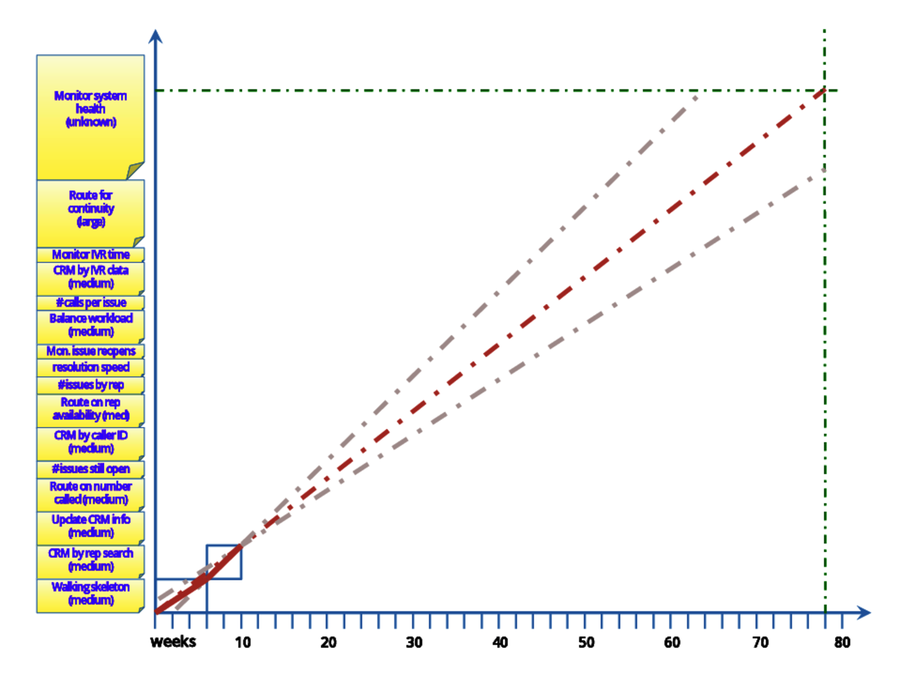
Sure enough, when the second feature was finished, it looked a bit more optimistic. The search of the CRM database from the Customer Service Rep screen was finished in four weeks, compared to the six it took for the initial Walking Skeleton. Both had been rated as medium-sized features. Were they really the same size and the rate of development had improved? Or had the start-up work of the Walking Skeleton invisibly made it larger than the CRM Search feature? You could go with gut feel, but two data points is hardly enough to define a trend.
To stay on the conservative side, Marion decided to project using the average rate of the two features rather than projecting with the faster rate of the second feature. Of course, projecting using the rate of the first feature would have been more conservative, but Marion had a couple reasons to not do that:
-
The second feature, being more recent, seemed a better choice for the team’s current rate of development.
-
The second feature, not having any project start-up activities, seemed more like the future work.
On the other hand, the rate of development indicated by the second feature seemed too optimistic. What did they have to let them presume it was more representative of the future than the first one was? Perhaps they just got lucky. Or perhaps the feature was slightly smaller than it initially appeared.
Given there was very little data so far and a long way to go in the project, it seemed premature to Marion to decide which data was biased. It’s a judgment call, and Marion made a decision. The BurnUp Chart showed the decision clearly, rather than hiding it in some mathematical formula. Every time Marion looked at the BurnUp, that decision was visible. They could accept or reevaluate that decision as appropriate with current knowledge.
The start of a project has a lot of uncertainty. Unless it’s an extension of a previous project, the work is different. Unless you maintain durable teams working together, the rate of the work is almost certainly different. The rate may be different even if you maintain durable teams, as they may not be as proficient, or may be more proficient, at the new work.
Functions Applied to Affinity Estimates
Technical people like to build tools, and the temptation is strong to build your own model using subjective measures and objective measures of the work, the workers, and the context. These measures are combined using mathematical coefficients representing their contribution to the development times.
Effectively they roll their own parametric model with the “T-shirt sizes” of work items as one of the inputs. Sometimes they go further and start building something approaching the complexity of the commercially available estimation models. The difference, though, is that these models are usually based on much less historical data, and the model is not usually tested on a wide variety of situations.
Building the "Super Model" |
|---|

|
I’ve seen a quite complex model that used a list of project sub-features developed early in the project by analysts, rating those sub-features by
- perceived difficulty
- number of dependencies on other systems
- whether they represented new, similar, or same functionality compared to prior work
and calculated optimistic and pessimistic durations based on expected number of teams working and historic average team throughputs. I could tell that this model was not based on empirical data as the coefficients tended to be nice neat figures such as 0.25, 0.5, and 1.0.
Alas, I cannot tell you how well this worked, as no one ever compared the model’s prediction with actuals. Applying detailed adjustments based on individual characteristics of work items is a difficult thing to do well. Each coefficient needs to be evaluated and calibrated separately for the model to have true validity. This is perhaps worthwhile when there is a great deal of similar work being done by a stable workforce, but seems unreliable in the practice I’ve observed.
Seat-of-the-pants coefficients can work, but I would caution you to check your model both against historical data that wasn’t used to derive the model, and against actuals in the future. Remember, the actuals are the real data. The model is a hypothesis.
|