Creating Formatted Output
Creating HTML Output for a Web Browser
Understanding the Four Types of HTML Output Files
HTML output is created b
default. However, if you want to use ODS HTML statement options, or
create a table file, page file, or frame file, you must use the ODS
HTML statement. When you use the ODS HTML statement, you can create
output that is formatted in HTML. You can browse the output files
with Internet Explorer, Netscape, or any other browser that fully
supports the HTML 4.
Creating HTML Output: The Simplest Case
To produce the simplest
type of HTML output, the only file that you need to create is a body
file. The following example executes the SORT, MEANS, TABULATE, UNIVARIATE,
and SGPANEL procedures. These files contain summary statistics for
the sales of office furniture in various countries. Notice that no
ODS statement is needed, because the HTML destination is open and
SAS automatically creates the HTML body file.
options nodate nonumber;
proc sort data=sashelp.prdsale out=prdsale;
by Country;
run;
proc tabulate data=prdsale;
class region division prodtype;
classlev region division prodtype;
var actual;
keyword all sum;
keylabel all='Total';
table (region all)*(division all),
(prodtype all)*(actual*f=dollar10.) /
misstext=[label='Missing']
box=[label='Region by Division and Type'];
run;
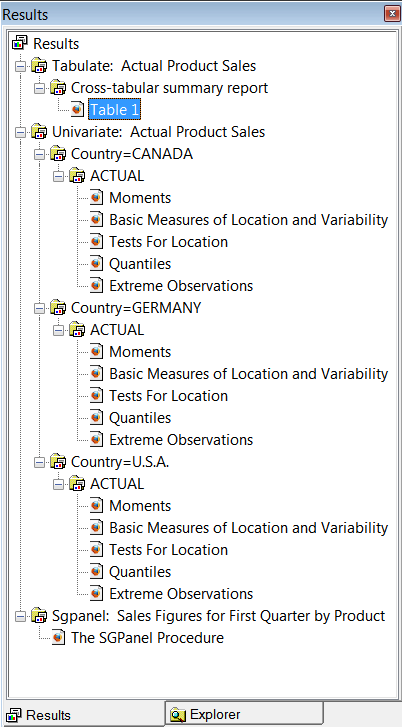
title 'Actual Product Sales';
title2 '(millions of dollars)';
proc univariate data=prdsale;
by Country;
var actual;
run;
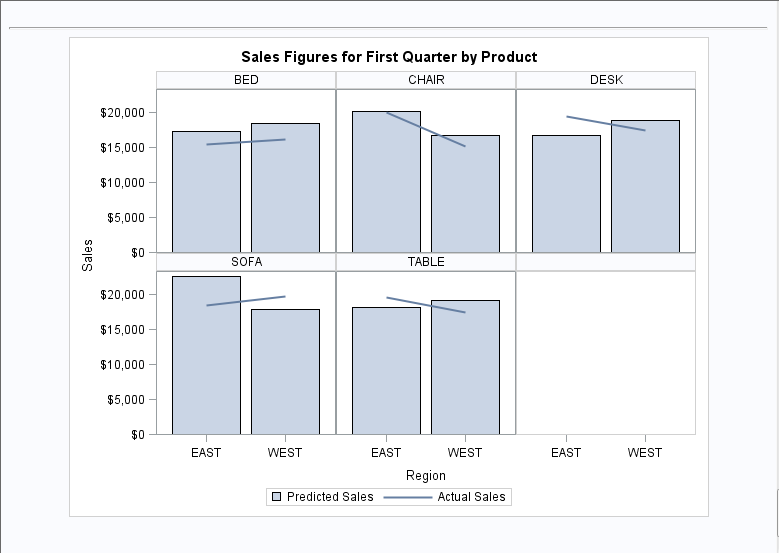
title 'Sales Figures for First Quarter by Product';
proc sgpanel data=prdsale;
where quarter=1;
panelby product / novarname;
vbar region / response=predict;
vline region / response=actual lineattrs=GraphFit;
colaxis fitpolicy=thin;
rowaxis label='Sales';
run;You can view the output
in the Results Viewer window, and browse
the output objects in the Results window.
You can view information about each output object such as name, type,
description, and template in the Table Properties window.
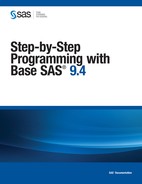
Display 34.1 Output Viewed in the Results Window
In the Results window,
the following output corresponds to the output object Table 1 under Tabulate: Actual Product Sales Cross-tabular
summary report. The name of this output
object is Table 1.
Cross-tabular
summary report. The name of this output
object is Table 1.
Display 34.2 PROC TABULATE Output
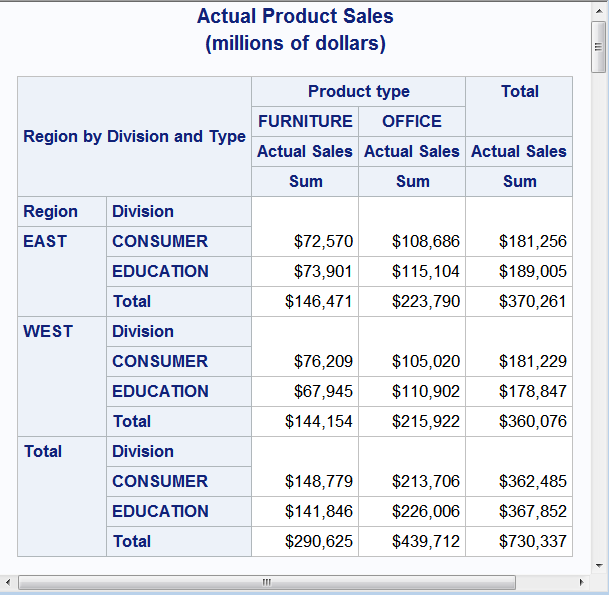
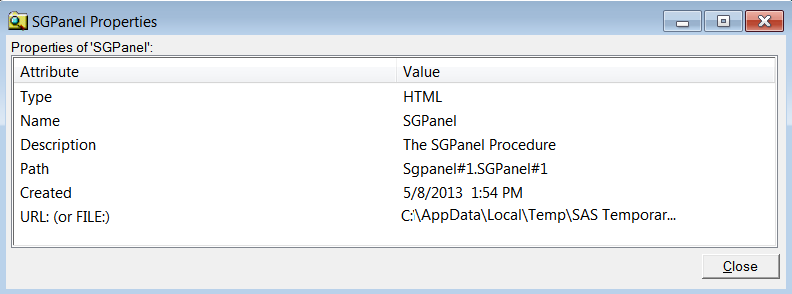
You can view the properties
of each output object in the Table Properties window
by right-clicking on the highlight output object and selecting Properties from
the drop down list.
Display 34.3 PROC TABULATE: Properties of Table 1
In the Results window,
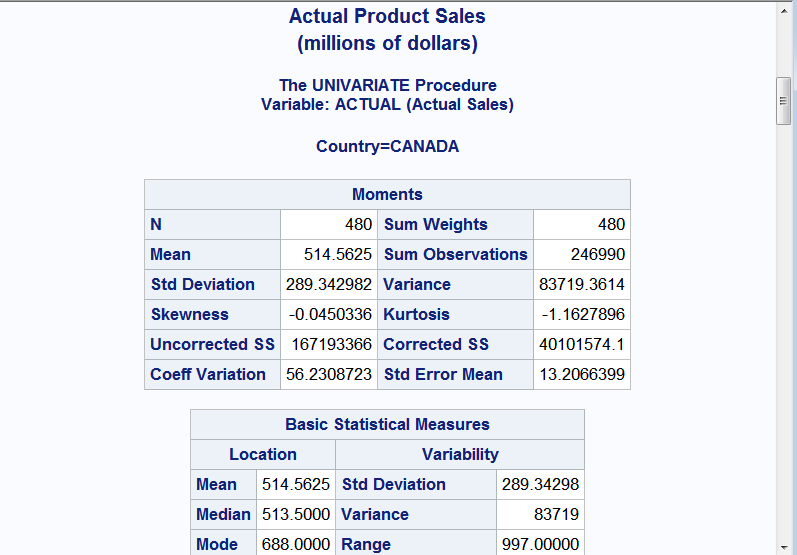
the following output corresponds to the output object Moments under: Univariate: Actual Product SalesCountry=CANADAACTUAL. The name of this output
object is Moments.
Display 34.4 PROC UNIVARIATE Output
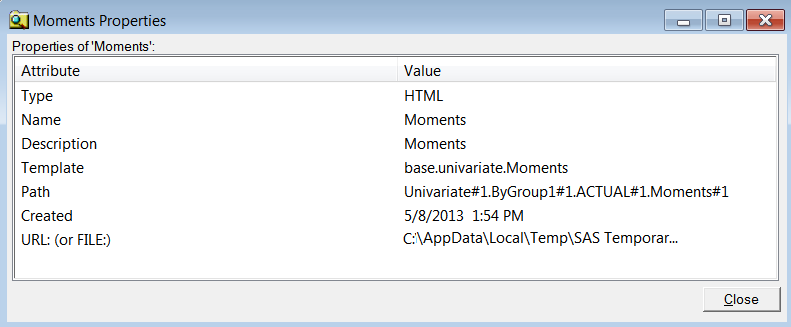
You can view the properties
of each output object in the Table Properties window
by right-clicking on the highlight output object and selecting Properties from
the drop down list.
Display 34.5 PROC UNIVARIATE: Properties of Moments
Creating HTML Output: Linking Results with a Table of Contents
The ODS HTML destination
enables you to link to your results from a table of contents and a
table of pages. To do this, you need to create the following HTML
files: a body file, a frame file, a table of contents, and a table
of pages. When you view the frame file and select a link in the table
of contents or the table of pages, the HTML table that contains the
selected part of the procedure results appears at the top of your
browser.
The following example
creates multiple pages of output from the UNIVARIATE procedure. You
can access specific output results (tables) from links in the table
of contents or the table of pages. The results contain statistics
for the average SAT scores of entering first-year college classes.
The output is grouped by the value of Gender in the CLASS statement
and by the value of Test in the BY statement.
options nodate nonumber;
proc sort data=sashelp.prdsale out=prdsale;
    by Country;
run;

1ods html file='SalesFig–body.htm'
         contents='SalesFig–contents.htm'
         page='SalesFig–page.htm'
         frame='SalesFig–frame.htm';

2proc tabulate data=prdsale;
   class region division prodtype;
   classlev region division prodtype;
   var actual;
   keyword all sum;
   keylabel all='Total';
   table (region all)*(division all),
         (prodtype all)*(actual*f=dollar10.) /
         misstext=[label='Missing']
         box=[label='Region by Division and Type'];
run;

title 'Actual Product Sales';
title2 '(millions of dollars)';

3proc univariate data=prdsale;
   by Country;
   var actual;
run;

title 'Sales Figures for First Quarter by Product';

4proc sgpanel data=prdsale;
    where quarter=1;
    panelby product / novarname;
    vbar region / response=predict;
    vline region / response=actual lineattrs=GraphFit;
    colaxis fitpolicy=thin;
    rowaxis label='Sales';
run;

5ods html close;
6ods html;| 1 | The
ODS HTML statement opens the HTML destination and creates four types
of files:
|
| 2 | The TABULATE procedure creates a summary report for actual product sales. |
| 3 | The UNIVARIATE procedure creates moments, basic measures, quantiles, and extreme observations tables for the actual sales for each country. |
| 4 | The SGPANEL procedure creates a graph of the sales figures for the first quarter by product. |
| 5 | The ODS HTML CLOSE statement closes the HTML destination to make output available for viewing. |
| 6 | The ODS HTML statement reopens the HTML destination so that the next program that you run can produce HTML output. |
Log 34.1 Partial SAS Log: HTML File Creation
1    options nodate nonumber;
2    proc sort data=sashelp.prdsale out=prdsale;
3        by Country;
4    run;

NOTE: There were 1440 observations read from the data set SASHELP.PRDSALE.
NOTE: The data set WORK.PRDSALE has 1440 observations and 10 variables.
NOTE: PROCEDURE SORT used (Total process time):
      real time           0.03 seconds
      cpu time            0.03 seconds


5
6    ods html file='SalesFig–body.htm'
7             contents='SalesFig–contents.htm'
8             page='SalesFig–page.htm'
9             frame='SalesFig–frame.htm';
NOTE: Writing HTML Body file: SalesFig–body.htm
NOTE: Writing HTML Contents file: SalesFig–contents.htm
NOTE: Writing HTML Pages file: SalesFig–page.htm
NOTE: Writing HTML Frame file: SalesFig–frame.htm
10
11
12   proc tabulate data=prdsale;
13   class region division prodtype;
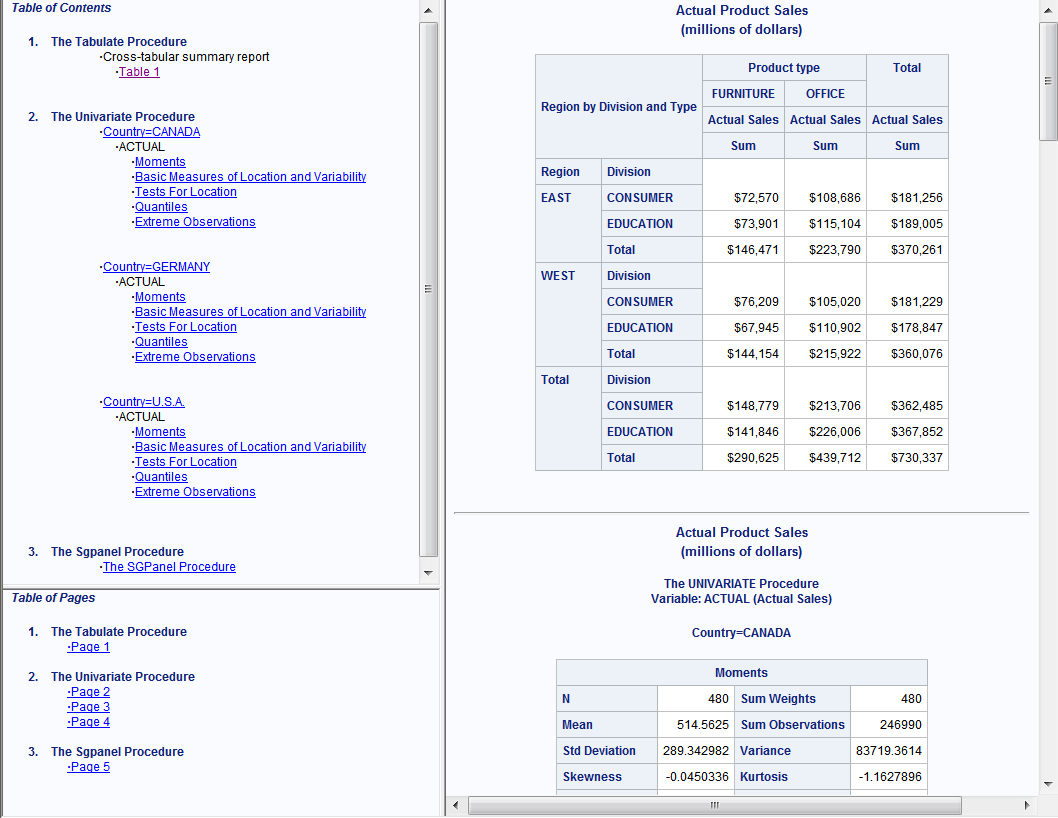
The following output
displays the frame file, name SalesFig-frame.htm, which displays the
table of contents (upper left side), the table of pages (lower left
side), and the body file (right side). Both the Table of Contents
and the Table of Pages contain links to the results in the body file.
If you click on a link in the Table of Contents or the Table of Pages,
SAS displays the corresponding results at the top of the browser.
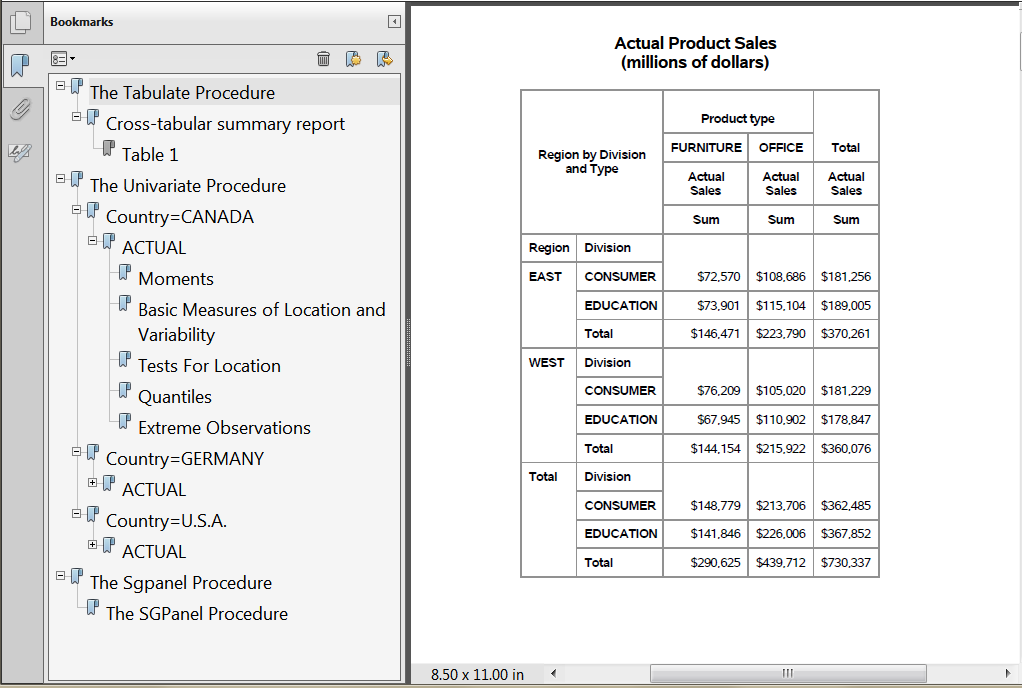
Creating PDF Output for Adobe Acrobat and Other Applications
You can
create output that is formatted for Adobe Acrobat and other applications.
Before you can access the file, however, you must close the PDF destination.
The following example
executes the SORT, MEANS, TABULATE, UNIVARIATE, and SGPANEL procedures.
These files contain summary statistics for the sales of office furniture
in various countries.
options nodate nonumber;
proc sort data=sashelp.prdsale out=prdsale;
    by Country;
run;

1ods html close;
2ods pdf file='odspdf_output.pdf';

3proc tabulate data=prdsale;
   class region division prodtype;
   classlev region division prodtype;
   var actual;
   keyword all sum;
   keylabel all='Total';
   table (region all)*(division all),
         (prodtype all)*(actual*f=dollar10.) /
         misstext=[label='Missing']
         box=[label='Region by Division and Type'];
run;

title 'Actual Product Sales';
title2 '(millions of dollars)';

4proc univariate data=prdsale;
   by Country;
   var actual;
run;

title 'Sales Figures for First Quarter by Product';

5proc sgpanel data=prdsale;
    where quarter=1;
    panelby product / novarname;
    vbar region / response=predict;
    vline region / response=actual lineattrs=GraphFit;
    colaxis fitpolicy=thin;
    rowaxis label='Sales';
run;

6ods pdf close;
7ods html;
The following list corresponds to the numbered items in the
preceding program:
| 1 | By default, the HTML destination is open. To conserve resources, the program uses the ODS HTML CLOSE statement to close this destination. |
| 2 | The ODS PDF statement opens the PDF destination and specifies the file to write to. |
| 3 | The TABULATE procedure creates a summary report for actual product sales. |
| 4 | The UNIVARIATE procedure creates moments, basic measures, quantiles, and extreme observations tables for the actual sales for each country. |
| 5 | The SGPANEL procedure creates a graph of the sales figures for the first quarter by product. |
| 6 | The ODS PDF CLOSE statement closes the PDF destination to make output available for viewing. |
| 7 | The ODS HTML statement reopens the HTML destination so that the next program that you run can produce HTML output. |
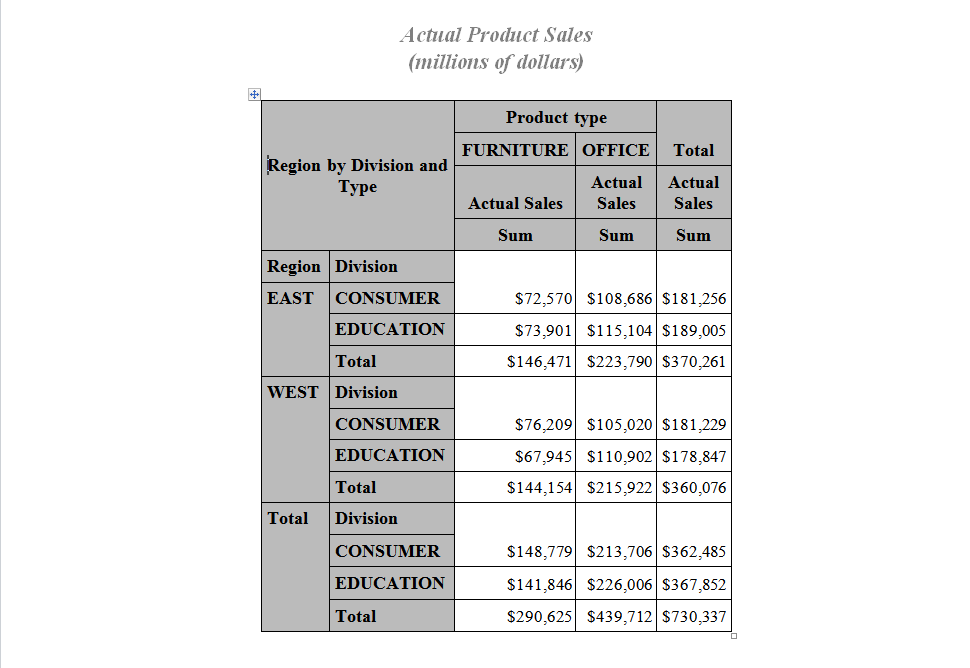
Creating RTF and PowerPoint Output
You can send output
to multiple destinations at the same time. The ODS RTF statement create
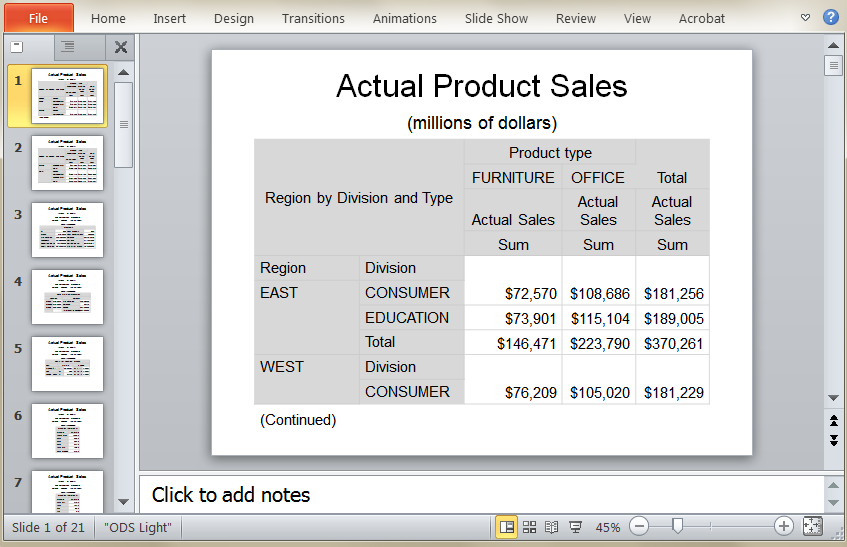
output that is formatted for use with Microsoft Word. The ODS POWERPOINT
statement creates output that is formatted for Microsoft PowerPoint.
Before you can access the files, you must close the destinations.
You can close all open destinations with the ODS _ALL_ CLOSE statement.
The following example
executes the SORT, MEANS, TABULATE, UNIVARIATE, and SGPANEL procedures.
These files contain summary statistics for the sales of office furniture
in various countries.
options nodate nonumber;
proc sort data=sashelp.prdsale out=prdsale;
    by Country;
run;

1ods html close;
2ods rtf file='odsrtf_output.rtf';
3ods powerpoint file='odspp_output.ppt';

4proc tabulate data=prdsale;
   class region division prodtype;
   classlev region division prodtype;
   var actual;
   keyword all sum;
   keylabel all='Total';
   table (region all)*(division all),
         (prodtype all)*(actual*f=dollar10.) /
         misstext=[label='Missing']
         box=[label='Region by Division and Type'];
run;

title 'Actual Product Sales';
title2 '(millions of dollars)';

5proc univariate data=prdsale;
   by Country;
   var actual;
run;

title 'Sales Figures for First Quarter by Product';

6proc sgpanel data=prdsale;
    where quarter=1;
    panelby product / novarname;
    vbar region / response=predict;
    vline region / response=actual lineattrs=GraphFit;
    colaxis fitpolicy=thin;
    rowaxis label='Sales';
run;

7ods _all_ close;
8ods html;
The following list corresponds to the numbered items in the
preceding program:
| 1 | By default, the HTML destination is open. To conserve resources, the program uses the ODS HTML CLOSE statement to close this destination. |
| 2 | The ODS RTF statement opens the RTF destination and specifies the file to write to. |
| 3 | The ODS POWERPOINT statement opens the POWERPOINT destination and specifies the file to write to. |
| 4 | The TABULATE procedure creates a summary report for actual product sales. |
| 5 | The UNIVARIATE procedure creates moments, basic measures, quantiles, and extreme observations tables for the actual sales for each country. |
| 6 | The SGPANEL procedure creates a graph of the sales figures for the first quarter by product. |
| 7 | The ODS _ALL_ CLOSE statement closes all open destinations to make output available for viewing. |
| 8 | The ODS HTML statement reopens the HTML destination so that the next program that you run can produce HTML output. |
..................Content has been hidden....................
You can't read the all page of ebook, please click here login for view all page.