
8
Volcanology: The Crucial Contribution of Surface Displacement Measurements from Space for Understanding and Monitoring Volcanoes
Virginie PINEL1, Fabien ALBINO1, Grace BATO2 and Paul LUNDGREN2
1ISTerre, Grenoble, France
2NASA Jet Propulsion Laboratory, California Institute of Technology, Pasadena, USA
8.1. Introduction
Eight hundred million people currently live within a radius of 100 km around a volcano which has erupted in the last 10,000 years (Brown et al. 2015). This means that around 10% of the global population may be directly affected by a volcanic eruption. The most explosive eruptions, producing the highest volumes, are the most lethal; these are characterized by a volcanic explosivity index (VEI) (Newhall et al. 1982) greater than or equal to 4. Deaths generally result from pyroclastic flows: rock fragments suspended in hot gas flowing down the slopes of the volcano at speed. Secondary phenomena, such as lahars, which are mudflows triggered by volcanic activity, or tsunamis also have the potential to cause loss of life on a significant scale (Voight 1990; Syamsidik et al. 2020). The consequences of volcanic activity in terms of human casualties have been significantly attenuated over the last few centuries with the development of modern volcanology (Auker et al. 2013). Volcanic eruptions cannot be prevented, but it is possible to evacuate the neighboring population in time (Surono et al. 2012), as precursors can often be observed before magma reaches the surface. The accumulation of magma in the upper part of the Earth’s crust, along with its transport towards the surface, can create ground displacements, with stress modifications resulting in seismic events and gaseous emissions. The measurement and interpretation of these signals, based on in-depth knowledge of magmatic processes, offer a means of reducing volcanic risk. The problem is that only a tiny proportion (around 10%) of the 1500 known active volcanoes are correctly instrumented and monitored (Ferrucci et al. 2012). Over the last few decades, the development of remote sensing techniques has presented opportunities for improved knowledge and monitoring of volcanic systems (Sparks et al. 2012; Pyle et al. 2013). Radar satellite data can notably be used to measure surface displacement resulting from volcanic activity (Pinel et al. 2014), and optical data can be used to measure displacements of larger amplitudes (Hollingsworth et al. 2012). In this chapter, we describe different techniques for measuring surface displacement in volcanoes, essentially using radar data, but also using high-resolution optical data. The application of these techniques to the specific context of volcanology is discussed in detail, in terms of both signal processing, for example the management of atmospheric artifacts, and the spatio-temporal characteristics of the observed displacements. We show how remote sensing has been used to develop global statistical observations of volcanic activity, and how displacement measurements obtained from space can be combined with other remote sensing observations (gas emissions, thermal measurements, etc.) or ground instrumentation. Finally, we demonstrate the contribution made by satellite displacement measurements in managing recent volcanic crises.
8.2. Origin of surface displacement and topographic changes in a volcano
The displacements observed in a volcano can be of gravitational or tectonic origin, but are more often caused by volcanic activity (storage, transport and effusion of magma at the surface) (Pinel et al. 2014). Studying these displacements can thus provide us with crucial information concerning the state of the magma supply system and its future evolution. Magma, produced by partial fusion of the lithospheric mantle, does not generally rise to the surface directly. Instead, it is usually stored a few kilometers below the surface in the Earth’s crust. When magma is stored at shallow level and the rate of accumulation is relatively fast, this results in an uplift, which can be observed from a few months to a few decades prior to an eruption. This displacement is thus a long-term precursor. The amplitude of the deformation is mostly dependent on the quantity of magma, the depth and the quantity of volatiles; it may reach several tens of centimeters in size. The lateral extent of a deformation is essentially a function of the depth of storage, and also of the shape of the reservoir; it may reach scales of up to 10 kilometers.
At a certain point, when a large quantity of magma has been accumulated, the resulting overpressure or buoyancy may cause the reservoir to rupture. At this point, the magma will begin to ascend towards the surface, and an eruption may result. Magma transport occurs by magmatic intrusions (planar fractures are created and expanded through the injection of fluid) or through cylindrical conduits (the liquid flows through a pipe which is already open). This stage is generally fast, lasting from a few hours to a few days. The resulting surface displacement can be considered as a short-term precursor. The uplift which results from the arrival of magma can be accompanied by subsidence, over a wider area but of lower amplitude, due to the simultaneous emptying of the feeding storage area.
Volcanic products emitted at the surface, such as lava or pyroclastic flow, cause topographic changes over a surface of several tens of meters. Displacements are often observed in deposits and may continue to occur for several decades after their emplacement. This is a result of continued flow, thermal contraction and the reaction of the Earth’s crust to the weight of the deposit. These signals are localized in, or in immediate proximity to, deposits. Their amplitude is generally a function of the thickness of the deposit and decreases exponentially over time. Studying these signals provides us with information concerning the physical (thermal and mechanical) properties of emitted lava and of the volcanic edifice itself.
Finally, volcanic activity can have a strong destabilizing effect on the volcano itself, resulting in major displacements, such as the collapse or destruction of the summit area or flank sliding. In cases where these displacements occur suddenly, they may reach one hundred meters and have visible effects over a kilometer. However, displacements of this type can also occur at slower rates and over longer periods.
Generally speaking, large amplitude topographic changes (from several tens to hundreds of meters) are a result of significant modifications in the morphology of the edifice (collapse of the crater zone, major destabilization of the flanks) or of the emergence of thick eruptive deposits (lava flows). The propagation of magmatic intrusions of several tens of kilometers beneath the surface may also result in surface displacements of several meters.
Furthermore, in many volcanoes, a hydrothermal system develops in the zone up to one hundred meters below the surface, resulting from interactions between rain or sea water and magmatic fluids. Perturbations of this system, due to changes in the heat source or in the arrival of magma, may also result in surface displacements; in this case, the spatial footprint is very close to that of the hydrothermal system, since the latter is very close to the surface.
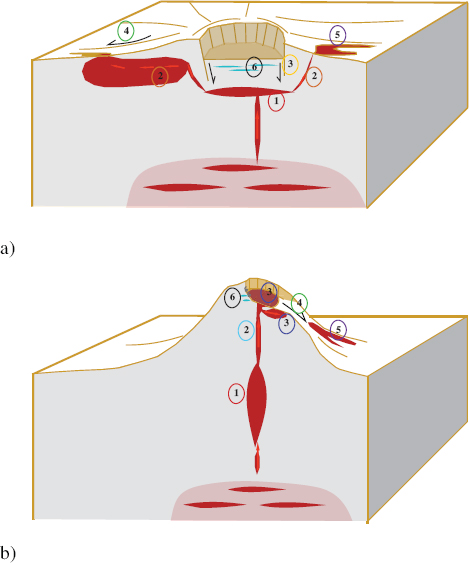
Figure 8.1. Different sources of deformation and topographic change affecting volcanoes. a) Typical case of a basaltic (shield) volcano: 1. storage zone, 2. propagation of a magmatic intrusion, 3. subsidence of the caldera, 4. flank sliding, 5. creation of a lava flow and associated subsidence, 6. hydrothermal system. b) Typical case of an andesitic stratovolcano: 1. storage zone, 2. flow of magma through the conduit, 3. endogenous and exogenous growth of the dome, 4. flank sliding, 5. creation of a pyroclastic flow and associated subsidence, 6. hydrothermal system. For a color version of this figure, see www.iste.co.uk/cavalie/images.zip
The morphology of a volcanic edifice and its eruptive deposits, along with the geometry of its magma supply system, are strongly affected by the type of magma being emitted. A distinction can be made between basaltic systems and andesitic stratovolcanoes. Basaltic systems mostly produce relatively homogeneous magma with a low silica content. These shield volcanoes are characterized by relatively gentle slopes, often with a crater or caldera zone at their summit (see Figure 8.1a). They typically occur in extension or rifting zones and at hotspots; their activity is essentially effusive in nature, and the magma which they produce is of low viscosity and relatively dense. Andesitic stratovolcanoes emit more differentiated magmas with a higher silica content; this magma has a lower density than basalt, but is much more viscous. The higher viscosity limits gas escape, making explosive activity more likely. Andesitic stratovolcanoes generally have steep flanks (see Figure 8.1b) and are mostly encountered in subduction zones.
8.2.1. Typical deformations in a basaltic system
Figure 8.1a shows the typical deformations observed in a basaltic volcano. The low viscosity of the magma favors the propagation of magmatic intrusions up to the surface, where they feed into eruptive fissures. Intrusions may extend laterally over several tens of kilometers, as in the case of the intrusive episode at Afar, Ethiopia, in 2005 (Grandin et al. 2009) or the 2014 eruption of Bardabunga, Iceland (Sigmundsson et al. 2015). Not all magmatic intrusions reach the surface, and even when this occurs, a significant quantity of magma remains trapped in the crust, leading to a surface displacement which can easily reach ten centimeters (Froger et al. 2004; Fukushima et al. 2010). Trapped magmatic intrusions contribute to the intrusive growth of the volcanic edifice. They may also trigger large-scale flank sliding events, as in the case of the Piton de la Fournaise volcano on Réunion Island (France) (Chaput et al. 2014; Froger et al. 2015). In cases where the storage zone is emptied to a significant extent by intrusions, there is also a possibility that the summit zone will collapse, with the formation of a caldera or its subsequent subsidence over several hundred meters (Froger et al. 2015; Sigmundsson et al. 2015; Anderson et al. 2019; Shreve et al. 2019). Deformations which are classically associated with recharging or emptying of shallow storage zones are sometimes linked to sliding along the faults marking the edge of the caldera (Liu et al. 2019). Basaltic lava flows are affected by subsidence caused by thermal contraction and mechanical loading effects (Bato et al. 2016; Wittmann et al. 2017). Hydrothermal systems can also cause localized surface deformations.
8.2.2. Typical deformations in an andesitic stratovolcano
Figure 8.1b shows the typical deformations observed in an andesitic stratovolcano. These volcanoes erupt less frequently than basaltic systems, with dormant periods lasting for decades or even centuries. For this reason, geophysical observations of volcanoes of this type are generally less complete. The greater viscosity of the magma and the maturity of the volcanic system mean that magma is generally transported over the final kilometers to the surface through the reactivation of more or less cylindrical permanent conduits. This form of magma transfer can be linked to transient displacements of low amplitude which evolve quickly over time (Voight et al. 1999). Viscous magma can settle just under the surface or in the crater, in thick, domed accumulations. The topographic changes resulting from the growth of these domes can reach hundreds of meters, and their temporal evolution provides direct information concerning the magma emission rate and thus the level of activity of the system (Watts et al. 2002). Domes can be destroyed very quickly during explosive phases, with the formation of excavations of tens or even hundreds of meters (Arambula-Mendoza et al. 2020). The lava flows that occur in these systems are generally thicker than those produced by basaltic volcanoes and take the form of fast, lethal pyroclastic flows. Studying these deposits provides further information regarding the physical properties of lava (Carrara et al. 2019).
8.3. Techniques used to measure displacements and topographic changes in volcanoes
Systematic monitoring of volcanoes, notably in the form of regular measurements of ground displacements, began in the late 19th century with the creation of the first volcanological observatories. Initially, very few volcanoes were monitored: the first observatory was built on the flanks of Vesuvius, in Italy, in 1841, followed by observatories on Etna, in Sicily, and Mount Pelée, in Martinique; in the latter case, monitoring essentially began in response to a lethal eruption in 1902. Other observatories included Mount Azama, in Japan, and Hawaii for the United States. The first measurements were generally leveling surveys, i.e. estimations of distances and angles across a network of designated benchmarks. Additional tilt measurements were often made, quantifying variations in the slope. The first time series featured only small numbers of points and were characterized by very weak temporal sampling, of the order of a few years (Dvorak and Dzurisin 1997). Extensometry was also used in some cases to characterize the opening and shear displacement of faults: the empirical information gathered in this way can provide interesting insights into volcanic systems (Peltier et al. 2006). The development of modern geodesy, with the appearance of GPS technology, made it possible to quantify displacements in 3D, with a degree of precision of within a millimeter for horizontal components and a centimeter for the vertical component; these techniques are crucial for modern volcanology. In terms of ground geodetic measurement, however, the main advance lies in the generalization of continuous measurements (with sampling periods as short as one second), leading to significant improvements in the temporal resolution of displacement measurements. Despite these advances, ground geodetic measurements are beset by intrinsic limitations due to the fact that measurements are punctual by nature and sensors must be installed and maintained on-site. In the late 1990s, surface deformation information was only available for around 50 volcanoes (Dvorak and Dzurisin 1997). This number was multiplied by at least four over the following 25 years through the use of satellite observations (Biggs et al. 2014). While warnings of an imminent eruption rely essentially on ground measurements, remote sensing offers significant advantages, notably in terms of spatial coverage, where surface displacement maps can be obtained for large areas. This means that deformations can be detected and quantified in regions where it is not possible to install instruments, either due to access problems relating to the political context, a lack of financial resources or a lack of personnel (Pritchard and Simons 2002; Wauthier et al. 2013). In addition, space archives open up the possibility of studying, a posteriori, volcanoes that have erupted and thus grant access to the observation of possible precursors. This type of highly informative study is never possible with ground-based instrumentation for all the volcanoes whose monitoring was not planned and carried out before the onset of the activity.
Table 8.1. Techniques for measuring surface displacement and topographic changes in a volcano with remote sensing. Note that, compared to optical data, radar data present the advantage of providing information even in cases of cloud cover
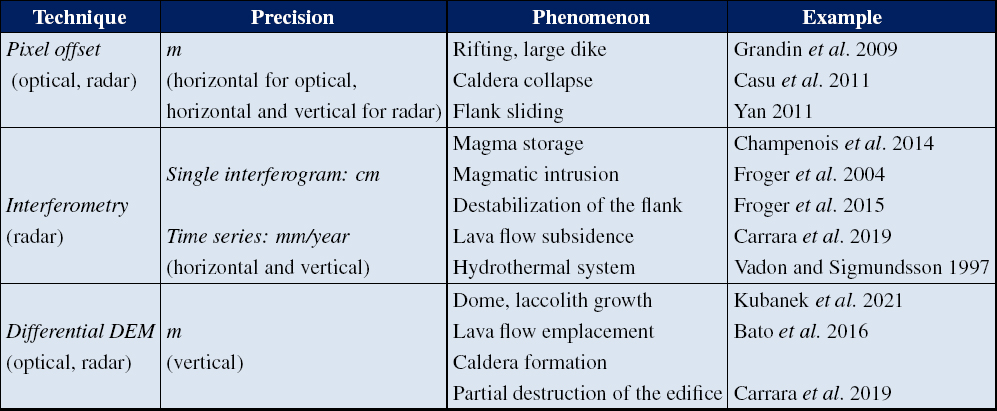
With remote sensing, displacement measurements are obtained by comparing images acquired at different dates in order to estimate any displacements which may have taken place on the ground between these dates, over all or part of the selected imaging area. Displacement measurements always rely on the extraction of information from an image at pixel level. Measurements can be based on the difference between the positions of the pixels in the images, taking account of the geometry of the sensor, or on the phase difference, which relates to the difference in the path followed by the electromagnetic wave in the case of radar imagery. Table 8.1 provides a summary of different detection techniques used to measure surface displacement in volcanic edifices, specifying the accuracy of the measurements obtained and the types of phenomena which can be observed; for each case, an example from the literature is also cited. Brief descriptions of all measurement techniques using satellite data are provided in the following sections, alongside specific examples of applications in volcanic regions. Where the ground surface is modified, for example by the emplacement of volcanic deposits, we cannot speak of surface displacement in the strict sense, but rather of topographic changes. This variation can be quantified, where significant, by differences in digital elevation models (DEMs; see section 8.3.3). The term “topographic change” is also used to refer to large-scale vertical displacements without surface alteration, as in the case of caldera formation.
Figure 8.2 shows a comparison of the resolutions of different techniques, along with the spatial and temporal characteristics of surface displacements typically observed in volcanoes.
8.3.1. Pixel offset tracking
This technique consists of measuring pixel offsets (variations in the positions of pixels within the image) using a maximum similarity search. It can be applied to both optical and radar amplitude images (see Chapters 2 and 3, respectively). The accuracy achieved depends on the resolution of the sensor, which is in the order of one-tenth of the pixel size (Michel et al. 1999). However, there is a visible dependency relationship between accuracy and signal coherence for radar amplitude images (De Zan 2014). Ionospheric disturbances can also cause significant errors (Gray et al. 2000). Accuracy thus varies from a few decimeters, for HR images, to a few meters. Since this technique takes account of both axes of the image, a two-dimensional (2D) displacement measurement is obtained. The differences in the geometries of optical and radar images mean that two horizontal displacement components are obtained for optical images; in radar imagery, we obtain a horizontal displacement component in the direction of the satellite trajectory (azimuth) and a displacement in the direction of the line of sight (in range or distance). The displacement in distance thus combines a horizontal component and a vertical component, with respective weights depending on the angle of view of the satellite.
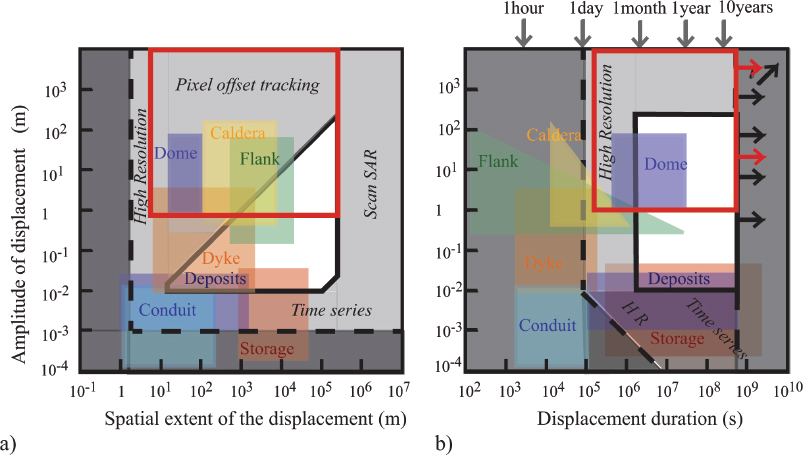
Figure 8.2. Comparison of spatial and temporal characteristics of volcanic surface displacement and displacement which can be measured by remote sensing. a) Amplitude of the displacement as a function of spatial extent (deformation gradients), b) amplitude of the displacement as a function of duration (deformation rate). The zone shown in white with a full black outline shows the InSAR validity domain (the displacement amplitude considered is in the line of sight) with classical Sentinel-type data. The gray area bounded by dashed black lines shows the limits of SAR data, including pixel offset tracking, HR data and the use of time series. This illustration clearly shows the advances made possible by the use of high spatial and temporal resolution (HR) sensors and time-series data-processing methods and by the increasing amount of archival data available. The pixel-offset tracking technique is used as a complement to InSAR, extending the range of use of SAR data in the case of strong deformation gradients. The solid red lines indicate displacements which can be measured using optical imagery, in the form of photogrammetry for vertical displacements and pixel offset measurement for horizontal displacements. Storage: deformation caused by a magma reservoir, Dyke: deformation resulting from a magmatic intrusion, Conduit: deformation induced by the flow of magma in the cylindrical conduit at shallow depth, Deposits: deformation induced by magma deposits (the change in topography induced by lava flow emplacement is not taken into account here), Flank: deformation associated with flank sliding of the volcanic edifice, Caldera: vertical displacements induced by collapse of the summit zone, Dome: variation in topography induced by the emplacement of a viscous dome. For a color version of this figure, see www.iste.co.uk/cavalie/images.zip
Only large amplitude displacements, in the order of several tens of decimeters to a meter, can be observed using this method (area shown within the red outline in Figure 8.2). In volcanology, amplitude correlation is essentially used to measure horizontal displacements induced by rifting episodes associated with the creation of magmatic intrusions of several tens of kilometers in length. Key examples include the Krafla rifting episode, which took place in Iceland from 1975 to 1984, observed using optical imagery (Hollingsworth et al. 2012); the Afar rifting episode that took place in the horn of Africa in 2005, studied with both optical imagery (Barisin et al. 2009; Grandin et al. 2009) and radar (Wright et al. 2006; Grandin et al. 2009); and the most recent episode associated with the 2014 eruption of Bardarbunga, in Iceland, studied with radar imagery (Ruch et al. 2016). The strong horizontal displacements resulting from the lateral propagation of a dike over several tens of kilometers and the subsidence of the summit caldera during the 2018 Ambrym eruption in Vanuatu, a relatively isolated and poorly instrumented volcanic region, were also measured by pixel-offset tracking in radar images (Shreve et al. 2019). This technique has also been used to document vertical displacements of the order of a meter in the calderas of basaltic volcanoes.
During the 2005 eruption of the Sierra Negra, in the Galapagos, a pre-eruptive uplift of the summit caldera along circumferential faults followed by co-eruptive subsidence (Casu et al. 2011) were described using radar images. The same technique was used to detect sliding down the eastern flank of the Piton de la Fournaise during the lateral eruption of January 2004, again using radar imagery (Yan 2011); prior to the installation of GNSS sensors in the Grandes Pentes area of the volcano in 2010, this type of flank sliding could only be detected using radar data.
8.3.2. Measurement by interferometry (phase difference)
Differential interferometry uses the phase of the radar signal. It provides a projection of the ground displacement in the direction of the line of sight (d) accurate to within a centimeter. The displacement measurement is obtained by calculating the difference between the phases of radar images acquired on two different dates, after coregistration. The basic principles of InSAR, or differential interferometry from synthetic aperture radar (SAR) images, can be found in the work by Hanssen (2001) or Massonnet and Souyris (2008). The difference between two phase images, commonly called an interferogram, contains information relating to ground displacement, and can be written as follows (see Chapter 4):
where W{.} is the wrapping operator of the measured phase modulo 2π. The ground displacement term is thus proportional to 4π/λ, where λ is the wavelength of the radar emission used. The phase difference also contains an orbital term and a topography term that can be corrected using knowledge of orbits and a digital elevation model (DEM), respectively. This value is subject to noise, some of which is of atmospheric origin, induced by variations in the propagation speed of the radar wave in the atmosphere between two acquisitions (see Chapter 8, section 8.4.3), resulting in a delay in the reception of the wave.
The phase variation is known modulo 2π and represented as fringes. The phase must be unwrapped in order to obtain a displacement map. At each point in the image, the aim is to find the integer number of factor 2π to add to the phase difference measured between −π and π (see Chapter 6). If done incorrectly, this step can result in errors in the displacement estimate. A preliminary filtering step is usually required.
The accuracy of the displacement measurement obtained by differential interferometry can be improved by applying noise reduction, using the redundancy of information available in a time series of images (see Chapter 5). In this way, ground displacements in the line of sight can be measured with an accuracy of the order of 1 mm/year.
Almost all surface deformations of volcanic origin have been observed using InSAR (for a full list of studies published before 2014, see Pinel et al. (2014)) with the exception of highly localized, transient phenomena, such as displacements triggered by magma flows through cylindrical conduits and very high-amplitude displacements (dome growth or caldera collapse, see Figure 8.2).
8.3.3. Measurement of topographic changes from differences in digital elevation models
Optical or radar satellite imagery can be used to obtain digital elevation models with a spatial resolution of a few meters, accurate to within around ten centimeters. Updating DEMs is crucial for volcanic risk management, since the topography of a volcano can evolve rapidly through partial destruction of the edifice or the emplacement of eruption products. A clear understanding of the topography of the volcano is key to modeling surface flows and their impacts, but is also essential for mechanical modeling, where the effects of topography must be taken into account (Cayol and Cornet 1998; Beauducel and Carbone 2015). The difference between two successive DEMs provides vertical surface displacements on a decimetric scale (see Figure 8.2). Cases where the change in elevation results from the addition of volcanic material on the surface are not counted as displacements in the strictest sense; however, the change in topography allows us to quantify deposit volumes and thus to determine the emission rate of the volcanic edifice.
8.3.3.1. Building a digital elevation model
A digital surface model (DSM) can be obtained by stereo-photogrammetry, using several optical images of the same area taken from different viewing angles, coregistered using image correlation techniques. In the absence of vegetation or human constructions, the DSM can be directly assimilated to a DEM. The resolution of the DEM depends directly on that of the source images, and its accuracy is a function of the relationship between the ground baseline and the altitude of the satellite (B/H ratio) and of the local slope. It is generally of the order of several tens of centimeters. Currently, the most widely used images of volcanic edifices are the Pléiades images, obtained in stereo or tri-stereo at a resolution of 0.7 m in panchromatic mode.
DEMs can also be obtained using two radar images, using the fact that the phase is affected by the topography via the term ψtopo in the phase difference expression (see equation [8.1]). This term is a function of the altitude H according to the following expression:
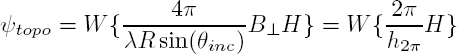
where R is the distance between the surface and the satellite, θinc is the angle of incidence, B⊥ is the perpendicular baseline and h2π is the altitude of ambiguity. The resolution of the DEM is a function of the original resolution of the radar images and the required multi-looking. Accuracy increases with the perpendicular baseline, and decreases as the altitude of ambiguity increases. A reference DEM is used to correct for topography and to ensure correct unwrapping. The residual fringes reveal variations in elevation with respect to this reference. Given that monostatic data are used, a time series needs to be processed in order to avoid atmospheric artifacts and to clearly distinguish between the topographic contribution and ground displacement. When available, bistatic data should be preferred, with two images acquired at the same time: this approach limits atmospheric errors and guarantees that no ground displacement will occur between the two acquisitions.
8.3.3.2. Differential DEM
DEMs obtained at successive time steps can be compared in order to estimate variations in altitude. In some cases, precise recalibration must be carried out first. The use of differential DEMs allows us to estimate lava emission volumes based on Pléiades optical data (Bagnardi et al. 2016), from TerraSAR-X and Tandem-X high-resolution radar data (Poland 2014; Albino et al. 2015; Kubanek et al. 2015a; Bato et al. 2016) or using a combination of Pléiades optical data and Tandem-X radar data (Carrara et al. 2019).
This technique can be used to quantify partial destructions of an edifice: for example, a volumetric loss of 4 Mm3 was observed in the summit area of the Colima volcano in Mexico during an eruption in July 2015 (Carrara et al. 2019). It also allows estimation of the evolution of domes in a summit crater (e.g. Merapi, Indonesia, as shown in Figure 8.3 and described by Kubanek et al. (2015)); this information is crucial for assessing stability and determining the likelihood of future explosions.
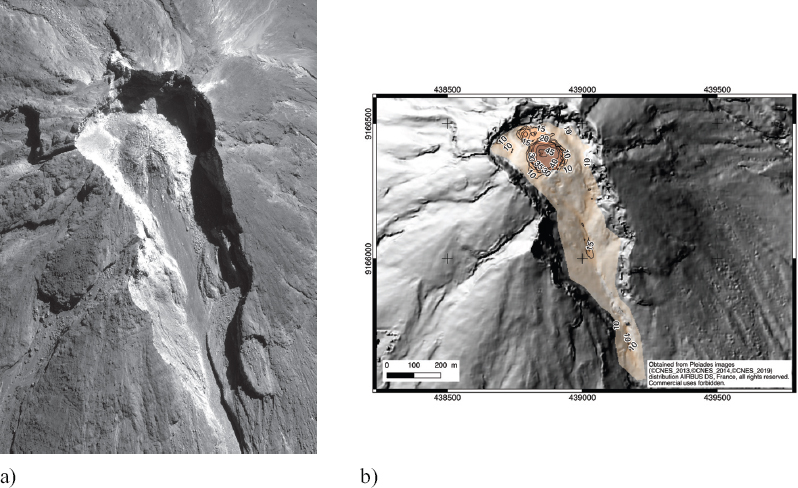
Figure 8.3. Use of Pléiades optical images (©CNES 2019, distribution AIRBUS, DS, images available through the DINAMIS/ISIS Science Support Programme) to quantify the growth of the dome in the summit crater of Merapi, Indonesia. a) Pléiades image from August 2019. b) Estimation of altitude variations caused by dome growth between 2014 and February 2019. The volume of the dome was estimated at approximately 0.5 million m3
8.4. Main limitations of measurements obtained by remote sensing
8.4.1. Temporal resolution
The frequency with which satellite data are acquired has increased in recent years, but the time step between two images with the same geometry covers at least a few days (every five days for Sentinel-2 optical images, and every six days, at best, for Sentinel-1 radar images). Some magmatic processes are too fast for their temporal evolution to be followed by remote sensing: notable examples include rapid destabilizations of the volcanic edifice and the propagation of magma to the surface, the dynamics of which can only be observed by continuous field measurements (see Figure 8.2). Satellite displacement measurements are still essential for quantifying permanent, static deformations, revealing information about the magma which is trapped underground in the form of magmatic intrusions. Recent improvements in acquisition frequencies mean that images acquired during magma propagation can now be exploited (e.g. in the case of the Piton de la Fournaise (Smittarello et al. 2019b)). However, the transient and localized deformations resulting from flows in the conduits cannot yet be assessed using remote approaches (Albino et al. 2011).
8.4.2. Cloud cover (optical imagery)
Unlike radar images, useful optical images can only be obtained when there is no cloud cover and during daylight hours. The proportion of acquired images which are actually useful is therefore strongly dependent on the weather conditions of the volcanic area in question; generally, this proportion is relatively low for volcanoes in the intertropical zone. In the case of the Merapi volcano, Indonesia, Sentinel-2 images are acquired every five days and systematically transmitted to the observatory. The proportion of images where the summit area is visible is relatively good (around 75%) during the dry season, from May to October, but extremely low (less than 10%) during the wet season, from November to April. In addition to these meteorological issues, the surface of volcanoes is often hidden by volcanic plumes during periods of eruptive activity.
8.4.3. Atmospheric artifacts (radar imagery)
The main limitation on the use of radar interferometry to measure displacement comes from atmospheric artifacts (Zebker et al. 1997). This problem does not exist when using bistatic data, which combine images acquired at the same time. Variations in the physical properties of the atmosphere over time, notably in terms of water vapor content, induce significant variations in the speed of propagation of electromagnetic waves and cause a variation in phase (term ϕatm in equation [8.1]), with an amplitude which may be well in excess of that of the geophysical signal. On the first occasion when interferometry techniques were applied to volcanology, a deflation signal was identified on Etna (Massonnet et al. 1995); this signal was later found to contain a significant portion of atmospheric effects (Beauducel et al. 2000). Atmospheric artifacts include a turbulent component that can be reduced by temporal filtering using time series (Hooper et al. 2012); however, they also contain a stratified component correlating with the topography. The spatial characteristics of the stratified artifact are very similar to the displacement field produced by a magma storage source located deep beneath the volcanic edifice.
Atmospheric fringes correlating with topography can be eliminated empirically by using the correlation between phase and altitude from deformation-free zones (Remy et al. 2003), albeit with the risk of partly eliminating the displacement signal itself. GNSS data can also be used to estimate and correct for atmospheric effects (Li et al. 2006). Another common approach consists of using temperature, pressure and water vapor content profiles taken from global meteorological models in order to calculate the tropospheric delay (Doin et al. 2009). These models have a temporal resolution of a few hours and a spatial resolution of a few tens of kilometers. The most widespread example is ERA5 re-analysis, supplied by the European Centre for Median-Range Weather Forecasting (ECMWF), available within five days. The Generic Atmospheric Correction Online Service (GACOS) also publishes maps of estimated tropospheric phase delays, extrapolated from the ECMWF data in conjunction with GNSS data. This information is made available one to two days after acquisition (Yu et al. 2018).
8.5. Main contributions of spatial geodesy for monitoring and studying volcanoes
In the years since the first study in this area was carried out by Massonnet et al. (1995), spatial geodesy has come to play a major role in modern volcanology (Pinel et al. 2014; Biggs and Pritchard 2017). This approach can be used to detect magma storage in non-instrumented areas. The broad extent of spatial coverage has brought significant improvements in terms of our knowledge of the geometry of magmatic intrusions and has enabled the detection of storage zones far below the surface or at some distance from the main volcanic edifice.
8.5.1. The development of global and statistical studies
The use of remote sensing techniques means that more active volcanoes can be studied using geodetic techniques than ever before, increasing the feasibility of broad statistical studies at the planetary level (Biggs et al. 2014) or across a specific volcanic region (e.g. Pritchard and Simons 2002; Biggs et al. 2009; Chaussard and Amelung 2012; Ebmeier et al. 2013). This approach has enabled systematic investigations of the relationship between eruptive activity and ground deformations (Biggs et al. 2014), along with a characterization of the depth of magma storage zones as a function of the tectonic context (Chaussard and Amelung 2014; Pinel et al. 2014) and their position with respect to eruptive centers (Ebmeier et al. 2018). The findings of these studies provide new information to further our understanding of magma transport mechanisms, the respective roles of lateral and vertical transport and the localization of zones where transport slows or even ceases. The use of remote techniques has also promoted cooperation between different international teams: one example is an initiative launched by the Committee on Earth Observation Satellites (CEOS), with a pilot project focusing on Latin America (2013–2017; Pritchard et al. (2018)), extended in 2019 to cover southeast Asia and Africa, with the aim of promoting the use of remote sensing techniques for the study and monitoring of volcanoes.
8.5.2. Improving knowledge of the magma supply system
The surface displacement maps provided by the InSAR, inverted using analytical or numerical models, have provided key information on the subject of storage zones, their location (Ebmeier et al. 2018) and shape, and on the presence of multiple sources operating simultaneously beneath a single volcanic edifice (see Pinel et al. (2014), section 4.2.1). Trajectories from these zones up to the surface, which can be complex, can now be represented at a sufficiently high resolution (Bagnardi et al. 2013; Galetto et al. 2020) to increase our understanding of the way in which the stress field influences the trajectory of magmatic intrusions (Corbi et al. 2015).
8.5.3. Growth and stability of volcanic edifices
Remote sensing data is unique in that it can be used to quantify volumes of magma both beneath and above the surface (in the form of volcanic deposits). This provides valuable quantitative information concerning the volcano growth modes, making a distinction between endogenous growth, from intrusions beneath the surface, and exogenous growth resulting from the accumulation of deposits on the surface (e.g. studying five eruptions of the Piton de la Fournaise, Fukushima et al. (2010) showed that 17% of the volume of magma which began transiting towards the surface remained trapped). The mode of growth has an effect on edifice stability, and thus on volcanic risk.
8.6. Recent progress
8.6.1. Integrating satellite imagery with field data
In relation to dynamic phenomena such as the propagation of magmatic intrusions, it can be useful to combine the spatial resolution of InSAR data with GNSS data, which has high temporal resolution but lower spatial coverage. A method for joint inversion of InSAR and GNSS was recently proposed and applied to the Piton de la Fournaise (Smittarello et al. 2019a). In this case, co-eruptive interferograms were used to model the final trajectory of a magmatic intrusion, then the temporal evolution of the opening of the intrusion was modeled using GNSS time series. The validity of this method was confirmed using a radar image obtained during the propagation of the intrusion. It highlighted both deceleration and acceleration phases in magma propagation, probably linked to the sensitivity of the stress field surrounding a small volume of magma with limited driving force (Smittarello et al. 2019b).
8.6.2. Automating processing chains for real-time detection
As the number of SAR missions increased, a number of international initiatives were launched with the aim of automating InSAR processing chains, rapidly providing the scientific community with InSAR products (interferograms, coherency and amplitude) in response to natural hazards such as volcanic eruptions or earthquakes. Global efforts in favor of automation and near-real time production accelerated still further after 2014, when the ESA made Sentinel data freely available. Key examples of these initiatives include:
- – the SARVIEWS online service, developed by the University of Alaska Fairbanks and Alaska Satellite Facility (ASF), produces interferograms for earthquakes and volcanic eruptions just a few hours after the acquisition of SAR data (Meyer et al. 2019);
- – the Advanced Rapid Imaging and Analysis (ARIA) project, run by the NASA Jet Propulsion Laboratory (JPL), provides displacement maps and value-added products, such as damage maps, in response to earthquakes, hurricanes or floods (Agram 2016);
- – the online Geohazard Exploitation Platform (GEP), developed by the European Space Agency (ESA), provides satellite data for use in evaluating different natural hazards such as earthquakes, volcanic eruptions or landslides. Unlike the other services listed above, the GEP allows users to process SAR data directly within the platform. The service also offers automatic production for certain priority zones, including a selection of 22 active volcanoes;
- – the Center of Observation and Modeling of Earthquakes and Volcanoes (COMET), based in the United Kingdom, has developed an automatic processing chain for Sentinel-1 data, known as LïCSAR, for monitoring major tectonic zones (the Alps, Turkey, the Himalayas) along with all active volcanoes (Lazecky et al. 2020; Morishita et al. 2020);
- – in France, the Observatoire InSAR de l’Océan Indien (OI2) works closely with the Observatoire Volcanologique du Piton de la Fournaise (OVPF). Using the Casoar online platform, the OI2 service provides the OVPF with displacement maps and lava flow tracking maps for each eruption of the Piton de la Fournaise volcano.
This systematic production of InSAR data has also contributed to the development of methods for automatically detecting and extracting displacement signals and for predicting the evolution of ground displacements. The long-term objective is to develop a valuable detection system for volcano observatories, with near-real time alerts each time a new displacement signal is detected.
Blind source separation methods, such as principal component analysis (PCA) or independent component analysis (ICA), can be used to extract spatial and temporal signal information from InSAR time series. In the context of volcanology, these methods have been applied to a number of case studies, such as Long Valley (USA), Cordon del Azufre and Calbuco (Chili) and the Galapagos archipelago (Lin et al. 2010; Remy et al. 2014; Ebmeier 2016; Gaddes et al. 2018, 2019). By extracting the different components of a signal, this method makes it possible to separate displacement signals and atmospheric signals without performing a pre-correction step. Other work, such as that of Albino et al. (2020), has demonstrated the effectiveness of simpler algorithms, such as CUSUM, which rely on anomaly detection in order to rapidly flag the start of inflation periods.
All of the methods cited above rely on the production of InSAR time series. In spite of recent efforts (Dalaison and Jolivet 2020), real-time and automatic time-series production continues to present a major challenge. This means that PCA and ICA methods are not entirely suitable for automatic detection of displacement signals on a global level.
Machine learning (ML) techniques can provide an answer to this limitation, taking advantage of the large number of raw interferograms routinely produced by InSAR processing chains. The value of ML techniques in a remote sensing context has already been proved for tasks such as image merging, scene classification, object detection and terrain classification (Ma et al. 2019). Work carried out at the University of Bristol has shown the value of ML for automatically detecting displacement signals in InSAR data (Anantrasirichai et al. 2018, 2019). The authors of this study used a dataset of 30,000 interferograms produced by LïCSAR for over 900 active volcanoes in order to develop and train a convolutional neural network (CNN), which successfully detected displacements in around 40 interferograms.
Finally, data assimilation strategies, commonly used for weather forecasting, have recently been applied to volcanology with the aim of increasing forecasting capacity (Bato et al. 2017). Combining observations with dynamic models of magma flow gives us information concerning magma pressure in storage zones, whilst providing insights into deep phenomena, such as variations in the deep magma inflow in volcanic systems (Bato et al. 2018).
8.6.3. Integration of all satellite sources in multi-parameter studies
Several recent studies have adopted a “multiparameter” approach, combining multiple satellite observations. Furtney et al. (2018) systematically compiled deformation signals, SO2 emissions and thermal anomalies detected by satellite measurements before and during volcanic eruptions over the whole period covered by satellite observations, starting in the late 1970s. They found that those eruptions for which no signals are found in remote sensing data are essentially minor events, or date from the earlier part of the investigation period, prior to 2000, for which observations are much less frequent. This study demonstrates the potential offered by these observations in a volcanology context. A systematic comparison of thermal satellite data, gas emissions and InSAR data was also carried out for 47 volcanoes in Latin America over a period of 17 years (Reath et al. 2019, 2020). This work contributed to the development of a classification of volcanic systems and provided valuable information for databases. WOVOdat, an international database aimed at improving the detection and interpretation of pre-eruption precursors, initially contained compilations of measurements from volcanological laboratories, to which satellite data were then added. More focused studies also exist, such as Kilbride et al.’s (2016) comparison of the relationship between variations in magma volumes in the storage areas, estimated using geodetic techniques, and the volumes of magma emitted at the surface with gas emissions. The aim of this study was to better defining the effects of compressibility induced by the volatiles contained in the magma.
8.7. Volcanic crisis management: the contribution of displacement measurements obtained using spatial imagery
In the context of volcanic crises, as for any natural disaster, the authorities of the affected countries can invoke the International Charter for Space and Major Disasters. This triggers the rapid acquisition of satellite data covering the impact zone, which are then used to map the damage.
8.7.1. Piton de la Fournaise, Réunion: benefits of spatial imagery for a highly active, closely monitored volcano
The Piton de la Fournaise, a basaltic shield volcano associated with hot spot activity, is one of the most active volcanoes on Earth, averaging two to three eruptions per year since 1998 (Global Volcanism Program, https://volcano.si.edu/volcano.cfm?vn=233020). Most historic eruptions have taken place in the Enclos Fouqué-Grand Brûlé, a long horseshoe depression which extends over 13 km along an east–west axis, likely formed by the collapse of a summit caldera or by catastrophic flank sliding of the eastern part of the edifice. The Piton de la Fournaise is actively monitored by the Observatoire Volcanologique du Piton de la Fournaise (OPVF), which has been recording seismicity, monitoring gas emissions and collecting regular ground displacement measurements since the 1980s (Peltier et al. 2018). In 1998, ground displacement maps obtained by InSAR were added to this list. Initially produced on a punctual basis, these maps began to be created systematically (Froger et al. 2004) by the Observatoire InSAR de l’Océan Indien at the Observatoire de Physique du Globe in Clermont-Ferrand, France, following the eruption of August 2003. Using SAR data acquired by the different available satellites, the OI2 was able to model the ground displacements generated by over 40 eruptions (Froger et al. 2020). The deformation of the volcano’s central cone was clearly detected by a dense GPS network, but InSAR made significant contributions for areas further from the summit. InSAR data was used to model the geometry of intrusions and, more importantly, highlighted the presence of flank sliding in the Grandes Pentes zone to the east of the summit, an area in which field instrumentation was only installed in 2007 (Richter and Froger 2020). InSAR also offers a means of better understanding the intrusive and extrusive growth of volcanic edifices (Fukushima et al. 2010) and, as a result, their stability (Chen et al. 2017; Richter and Froger 2020). Radar data can be used in real time during eruptions for rapid and efficient mapping of the extent of lava flows, drawing on the loss of coherence which results from the emplacement of deposits. This information, combined with satellite thermal data, can be used to validate lava flow models and to update predictions concerning the areas affected by an eruption in real time (Harris et al. 2019).
8.7.2. Mount Agung, Indonesia: using InSAR data in real time in a crisis management situation
Mount Agung is an andesitic stratovolcano in northeastern Bali, Indonesia (Global Volcanism Program, https://volcano.si.edu/volcano.cfm?vn=264020). Following a major explosive eruption in 1963 (Volcanic Explosivity Index (VEI) 5), the volcano remained inactive for over 50 years, before displaying signs of seismic activity in August 2017 (Figure 8.4a). The seismic crisis accelerated in September before reaching a plateau in October, with over 800 events per day (Figure 8.4b). Activity then dropped off until the start of the eruption on November 21, 2017. Believing eruption to be imminent, the Indonesian authorities, working in collaboration with the Centre for Volcanology and Geological Hazard Mitigation (CVGHM), began preventive evacuation of 140,000 inhabitants in late September and created an exclusion zone of around 10 kilometers around the volcano (Syahbana et al. 2019). Evidently, this decision prevented a major human catastrophe.
The magmatic origin of the seismic activity was discussed at length during the crisis management period. The collection and analysis of displacement data played a crucial role in developing an understanding of the processes leading to the reactivation of the volcano. While only five GNSS stations (installed in 2012) were available in September 2017, some of these instruments detected an inflation in the ground, interpreted as the pressurization of a deep-lying magma source (Syahbana et al. 2019). However, with so few stations, it was not possible to constrain the nature or depth of the source. In this context, InSAR data was key to characterizing the displacement field and identifying the source(s) of the observed signals.
The fact that Sentinel-1 SAR data (ESA) are freely available presents an advantage to the scientific community and volcanological observatories in crisis situations, as preliminary results can be produced and circulated rapidly. However, the free accessibility of InSAR products is not without its drawbacks. In the case of the Mount Agung eruption, certain Sentinel-1 interferograms were shared on social media sites, such as Twitter, in September 2017, along with interpretations suggesting that the volcano had expanded by over 10 cm in 12 days. In reality, the signal in question was a result of atmospheric effects, an issue that is frequently encountered in the case of stratovolcanoes (see section 8.4.3). The tropical island of Bali, where Mount Agung is located, is subject to strong variations in atmospheric conditions, notably in terms of water vapor content, due to proximity to the sea and the high topographical gradient between the coast (0 m) and the summit of the volcano (>3,000 m). The spread of false information, not recalibrated or contextualized by scientists, created problems in terms of crisis management; the Indonesian authorities were forced to communicate and reassure the population in a way which would not otherwise have been necessary.
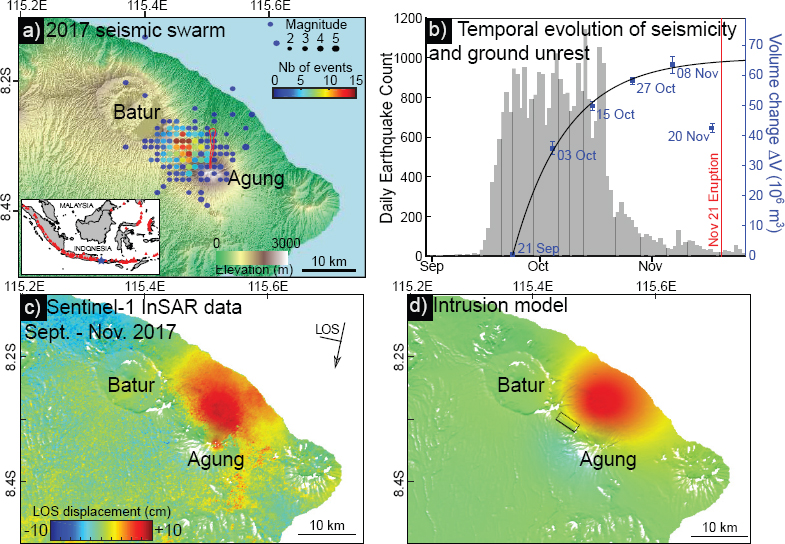
Figure 8.4. Volcanic crisis (seismicity and surface deformation) observed at Mount Agung in the pre-eruptive period from September to November 2017. a) Location and magnitude of seismic activity; b) temporal evolution of seismicity and variations in the volume of the magmatic intrusion; c) cumulative displacements obtained using Sentinel-1 InSAR data; d) deep magmatic intrusion model adjusting the deformation signal. For a color version of this figure, see www.iste.co.uk/cavalie/images.zip
In-depth analysis of InSAR data is crucial. First, atmospheric signals are systematically corrected using meteorological models (from the ECMWF), and then, time series are produced (Albino et al. 2020). Using this approach, an inflation signal with a radius of around 5 km was identified after the event between Mount Agung and Mount Batur, with displacements of around 10 cm over the period from September to October 2017 (Figure 8.4c). This deformation episode was concurrent with the seismic crisis (Figure 8.4b). Numerical modeling of the displacement signals showed that these precursors were caused by the propagation of a deep magmatic intrusion (7–12 km) between the Agung and Batur volcanoes (Albino et al. 2019) (Figure 8.4d).
The eruption essentially took the form of a dome growing in the summit crater, with a volume quantified at 24 ± 1 million m3 by differential DEM using tristereo Pléiades images, acquired in February 2018 in response to a request from the CEOS Volcano supersite. The magma surface emission was combined with a deflation corresponding to the emptying of the deep source identified by the GNSS data.
The study of the 2017 Mount Agung eruption highlights a number of important points for discussion relating to crisis management, the contribution of InSAR to volcanic monitoring and the understanding of the magmatic systems of arc volcanoes:
- – in a globalized world, the rapid diffusion of false information or “fake news” (such as mistaken interpretations of InSAR products) hinders correct management of volcanic crises by the competent authorities and organizations and has a visible impact on local populations. This shows the need for the scientific community to take greater responsibility and, more generally, raises questions concerning the communication and diffusion of information;
- – in-depth analysis of InSAR data, while difficult in a tropical context, provides information to complement that provided by field monitoring networks (seismic stations, GNSS). This information is key to developing a better understanding of the magmatic processes leading up to eruption.
8.7.3. Taal, Philippines: innovative use of InSAR information in real time
Taal is the second most active volcano in the Philippines (Delos Reyes et al. 2018), located just south of Manila, the national capital (Global Volcanism Program, https://volcano.si.edu/volcano.cfm?vn=273070). At around 05:00 UTC on January 12, 2020, the Taal volcano underwent a phreatic eruption, spewing a column of ash mixed with water vapor up to an altitude of 15 km while producing a number of volcanic lightning blots, reported by the Philippine Institute of Volcanology and Seismology (PHIVOLCS). The eruption entered a magmatic phase at 18:49 UTC, with the emission of low-intensity lava fountains. Visibility of the main crater of the erupting volcanic island was extremely limited, and most of the on-site field instruments (GNSS stations, seismic stations and MultiGAS) operating at Taal were destroyed or disabled in the paroxysm of the crisis. The “Space and Major Catastrophes” charter was activated. Programmed optical acquisitions, notably Pléiades data, showed significant cloud cover. In this context, radar data from the Sentinel-1 satellite provided crucial information to the local observatory, directed by the PHIVOLCS, helping scientists to evaluate the state of the volcano with relatively high temporal resolution and wide spatial coverage. Figure 8.5a shows the very first interferogram shared by the Jet Propulsion Laboratory team at Caltech on January 16, 2020, mere hours after the second SAR image became available to download from the Copernicus platform. Each of the concentric fringes shown in the figure is equivalent to a displacement of around 2.8 cm on the ground in the line of sight (LOS) of the satellite. However, the large ground displacement gradients in the immediate vicinity of the eruptive crater meant that fringes were difficult to discern and impossible to unwrap: this phenomenon is known as aliasing. Figure 8.5b is a surface displacement map, produced by pixel offset analysis of the amplitude image (see Chapter 1, section 1.2.1). It shows how the displacement measurements obtained using pixel offset tracking can be used as a complement to InSAR results, notably in regions with large displacement gradients, such as the Taal volcanic island and the Pansipit valley (southwest of the caldera lake). A displacement of tens of meters in the direction of the line of sight of the satellite, moving away from the satellite, was detected for most regions of the volcanic island; in the Pansipit valley, around 1.5 m of positive and negative displacements in the direction of the line of sight of the satellite. Ground fissures, generally an indicator of subterranean magma activity, were also observed, mostly around the Pansipit valley area: these findings corroborated the results of the pixel offset analysis. This method also allows new deposits of eruptive products, shown as red pixels in the volcanic island in Figure 8.5b, to be detected and their areas to be measured. Note, however, that the accuracy of pixel offset results is sub-metric and, as such, is well below that of InSAR results.

Figure 8.5. Surface displacement measurements using a) interferometry and b) pixel offset tracking from the first Sentinel-1 image acquired after the start of the eruption. In addition to the displacement field centered on the volcanic island, there is a signal induced by a vertical intrusion extending south of the caldera, with boundaries corresponding to the lake surrounding the volcanic island. For a color version of this figure, see www.iste.co.uk/cavalie/images.zip
The Sentinel-1 mission involves two satellites, meaning that interferograms can be produced every six days. However, this level of systematic acquisition in ascending and descending trajectories only applies to Europe. Thanks to the support of the Copernicus program (ESA), the JPL’s request for a six-day acquisition frequency for Taal was accepted and implemented until February 22, 2020. This allowed the JPL to provide the PHIVOLCS with regular data and analysis as and when it became available.
The role that Sentinel-1 data played throughout the Taal eruption was unprecedented (Bato et al. 2021); this data was used to follow the progression of a magmatic intrusion of several tens of kilometers in length, just below the surface, in real time. This magmatic intrusion had not been detected by the field network as it had been in the case of the Bardarbunga eruption of August 2014 in Iceland. Although InSAR data provide a vast amount of information, it is important to note that the behavior of a volcano cannot be understood and predicted on this basis alone, especially during a crisis. Additional in situ measurements, ground observations and local and historic knowledge of the volcano are of critical importance. For this reason, in a crisis management context, data and analysis should be transmitted to the local scientific community and not sent directly to the authorities in charge of evacuation proceedings.
Sentinel-1 data allowed an ongoing crisis to be monitored from a distance and in near-real time. At the time of writing, Taal has not undergone any major eruptions since the instance discussed above (January 2020). The JPL continues to support the local volcanic observatory using time-series analysis, and the PHIVOLCS now include InSAR data in scientific discussions and in routine monitoring activity.
8.8. Conclusion
The role of remote sensing in volcanology continues to grow, notably thanks to the increasing number of observations of volcanic systems and to the development of multiparameter statistical studies on a global scale. Satellite ground displacement measurements have contributed to significant advances in imaging and in understanding magma supply systems, although the low temporal resolution of this data is currently a limiting factor for the observation of system dynamics. Note that the techniques applied to satellite data are also used for optical or radar acquisitions obtained at ground level, by drones or from the air (Derrien et al. 2015). They have the potential to be used in planetary volcanology and in analog laboratory experiments (Galland et al. 2016; Liu et al. 2019). In conclusion, radar data, which can be used irrespective of cloud cover, present a major advantage in comparison with optical data; furthermore, radar data offer the only means of measuring low amplitude displacements, which constitute the majority of precursors of volcanic activity. Satellite data are not yet being used to their full potential for real-time monitoring and crisis management; nevertheless, current initiatives should increase the impact of these techniques.
8.9. Acknowledgments
The authors thank Valérie Cayol and Jean-Luc Froger for reviewing this chapter and for their useful suggestions.
8.10. References
Agram, P. (2016). ARIA: Delivering State-of-the-Art InSAR Products for End Users. NASA Jet Propulsion Laboratory, Pasadena.
Albino, F., Pinel, V., Massol, H., Collombet, M. (2011). Conditions for detection of ground deformation induced by conduit flow and evolution. Journal of Geophysical Research Solid Earth, 116, B06201.
Albino, F., Smets, B., d’Oreye, N., Kervyn, F. (2015). High-resolution TanDEM-X DEM: An accurate method to estimate lava flow volumes at Nyamulagira Volcano (D. R. Congo). Journal of Geophysical Research: Solid Earth, 120(6), 4189–4207.
Albino, F., Biggs, J., Syahbana, D.K. (2019). Dyke intrusion between neighbouring arc volcanoes responsible for 2017 pre-eruptive seismic swarm at Agung. Nature Communications, 10(1), 748.
Albino, F., Biggs, J., Yu, C., Li, Z. (2020). Automated methods for detecting volcanic deformation using Sentinel-1 InSAR time series illustrated by the 2017–2018 unrest at Agung, Indonesia. Journal of Geophysical Research: Solid Earth, 125(2), e2019JB017908.
Anantrasirichai, N., Biggs, J., Albino, F., Hill, P., Bull, D. (2018). Application of machine learning to classification of volcanic deformation in routinely generated InSAR data. Journal of Geophysical Research: Solid Earth, 123(8), 6592–6606.
Anantrasirichai, N., Biggs, J., Albino, F., Bull, D. (2019). A deep learning approach to detecting volcano deformation from satellite imagery using synthetic datasets. Remote Sensing of Environment, 230, 111179.
Anderson, K.R., Johanson, I.A., Patrick, M.R., Gu, M., Segall, P., Poland, M.P., Montgomery-Brown, E.K., Miklius, A. (2019). Magma reservoir failure and the onset of caldera collapse at Kilauea Volcano in 2018. Science, 366(6470).
Arambula-Mendoza, R., Varley, N., Garcia-Flores, R., Vargas-Bracamontes, D., Navarro-Ochoa, C., Marquez-Ramirez, V., Capra, L., Gonzalez-Amezcua, M., Martinez-Fierros, A., Ramirez-Vazquez, C. (2020). Destruction of a lava dome observed with photogrammetry, acoustic and seismic sensors at Volcán de Colima, Mexico. Journal of Volcanology and Geothermal Research, 395, 106834.
Auker, M.R., Sparks, R.S.J., Siebert, L., Crosweller, H.S., Ewert, J. (2013). A statistical analysis of the global historical volcanic fatalities record. Journal of Applied Volcanology, 2(1), 2.
Bagnardi, M., Amelung, F., Poland, M.P. (2013). A new model for the growth of basaltic shields based on deformation of Fernandina volcano, Galápagos Islands. Earth and Planetary Science Letters, 377–378(0), 358–366.
Bagnardi, M., González, P.J., Hooper, A. (2016). High-resolution digital elevation model from tri-stereo Pleiades-1 satellite imagery for lava flow volume estimates at Fogo Volcano. Geophysical Research Letters, 43(12), 6267–6275.
Barisin, I., Leprince, S., Parsons, B., Wright, T. (2009). Surface displacements in the September 2005 Afar rifting event from satellite image matching: Asymmetric uplift and faulting. Geophysical Research Letters, 36(7).
Bato, M.G., Froger, J.L., Harris, A.J.L., Villeneuve, N. (2016). Monitoring an effusive eruption at Piton de la Fournaise using radar and thermal infrared remote sensing data: Insights into the October 2010 eruption and its lava flows. In Detecting, Modelling and Responding to Effusive Eruptions, Harris, A.J.L., De Groeve, T., Garel, F., Carn, S.A. (eds). Geological Society, London.
Bato, M.G., Pinel, V., Yan, Y. (2017). Assimilation of deformation data for eruption forecasting: Potentiality assessment based on synthetic cases. Frontiers in Earth Science, 5, 48.
Bato, M.G., Pinel, V., Yan, Y., Jouanne, F., Vandemeulebrouck, J. (2018). Possible deep connection between volcanic systems evidenced by sequential assimilation of geodetic data. Scientific Reports, 8(1), 11702.
Bato, M.G., Lundgren, P., Pinel, V., Solidum, R., Daag, A., Cahulogan, M. (2021). The 2020 eruption and large lateral dike emplacement at Taal volcano, Philippines: Insights from satellite radar data. Geophysical Research Letters, 48, e2021GL092803.
Beauducel, F. and Carbone, D. (2015). A strategy to explore the topography-driven distortions in the tilt field induced by a spherical pressure source: The case of Mt Etna. Geophysical Journal International, 1471–1481.
Beauducel, F., Briole, P., Froger, J.-L. (2000). Volcano wide fringe in ERS synthetic aperture radar interferograms of Etna (1992–1998): Deformation or tropospherique effect? Journal of Geophysical Research: Solid Earth, 105, 16391–16402.
Biggs, J. and Pritchard, M.E. (2017). Global volcano monitoring: What does it mean when volcanoes deform? Elements, 13(1), 17–22.
Biggs, J., Anthony, E.Y., Ebinger, C.J. (2009). Multiple inflation and deflation events at Kenyan volcanoes, East African Rift. Geology, 37, 979–982.
Biggs, J., Ebmeier, S.K., Aspinall, W.P., Lu, Z., Pritchard, M.E., Sparks, R.S.J., Mather, T.A. (2014). Global link between deformation and volcanic eruption quantified by satellite imagery. Nature Communications, 5, 3471.
Brown, S., Loughlin, S., Sparks, R., Vye-Brown, C., Barclay, J., Calder, E., Cottrell, E., Jolly, G., Komorowski, J.-C., Mandeville, C., Newhall, C., Palma, J., Potter, S., Valentine, G., Baptie, B., Biggs, J., Crossweller, H., Ilyinskaya, E., Kilburn, C., Mee, K., Pritchard, M. (2015). Global volcanic hazard and risk. In Global Volcanic Hazards and Risk, Loughlin, S.C., Sparks, S., Brown, S.K., Jenkins, S.F., Vye-Brown, C. (eds). Cambridge University Press, Cambridge.
Carrara, A., Pinel, V., Bascou, P., Chaljub, E., la Cruz-Reyna, S.D. (2019). Post-emplacement dynamics of andesitic lava flows at Volcán de Colima, Mexico, revealed by radar and optical remote sensing data. Journal of Volcanology and Geothermal Research, 381, 1–15.
Casu, F., Manconi, A., Pepe, A., Lanari, R. (2011). Deformation time-series generation in areas characterized by large displacement dynamics: The SAR amplitude pixel-offset SBAS technique. IEEE Journal of Selected Topics in Applied Earth Observations and Remote Sensing, 99, 1–12.
Cayol, V. and Cornet, F.H. (1998). Effects of topography on the interpretation of the deformation field of prominent volcanoes – Application to Etna. Geophysical Research Letters, 25, 1979–1982.
Champenois, J., Pinel, V., Baize, S., Audin, L., Jomard, H., Hooper, A., Alvarado, A., Yepes, H. (2014). Large-scale inflation of Tungurahua volcano (Ecuador) revealed by persistent scatterers SAR interferometry. Geophysical Research Letters, 41(16), 5821–5828.
Chaput, M., Pinel, V., Famin, V., Michon, L., Froger, J.-L. (2014). Cointrusive shear displacement by sill intrusion in a detachment: A numerical approach. Geophysical Research Letters, 41, 1937–1943.
Chaussard, E. and Amelung, F. (2012). Precursory inflation of shallow magma reservoirs at west Sunda volcanoes detected by InSAR. Geophysical Research Letters, 39.
Chaussard, E. and Amelung, F. (2014). Regional controls on magma ascent and storage in volcanic arcs. Geochemistry, Geophysics, Geosystems, 15(4), 1407–1418.
Chen, Y., Remy, D., Froger, J.-L., Peltier, A., Villeneuve, N., Darrozes, J., Perfettini, H., Bonvalot, S. (2017). Long-term ground displacement observations using InSAR and GNSS at Piton de la Fournaise volcano between 2009 and 2014. Remote Sensing of Environment, 194, 230–247.
Corbi, F., Rivalta, E., Pinel, V., Maccaferri, F., Bagnardi, M., Acocella, V. (2015). How caldera collapse shapes the shallow emplacement and transfer of magma in active volcanoes. Earth and Planetary Science Letters, 431, 287–293.
Dalaison, M. and Jolivet, R. (2020). A Kalman filter time series analysis method for InSAR. Journal of Geophysical Research: Solid Earth, 125(7), e2019JB019150.
De Zan, F. (2014). Accuracy of incoherent speckle tracking for circular Gaussian signals. IEEE Geoscience and Remote Sensing Letters, 11, 264–267.
Delos Reyes, P., Bornas, M., Dominey-Howes, D., Pidlaoan, A., Magill, C., Solidum, R. (2018). A synthesis and review of historical eruptions at Taal Volcano, Southern Luzon, Philippines. Earth Science Reviews, 177, 565–588.
Derrien, A., Villeneuve, N., Peltier, A., Beauducel, F. (2015). Retrieving 65 years of volcano summit deformation from multitemporal structure from motion: The case of Piton de la Fournaise (La Réunion Island). Geophysical Research Letters, 42(17), 6959–6966.
Doin, M.P., Lasserre, C., Peltzer, G., Cavalié, O., Doubre, C. (2009). Corrections of stratified tropospheric delays in SAR interferometry: Validation with global atmospheric models. Journal of Applied Geophysics, 69, 35–50.
Dvorak, J.J. and Dzurisin, D. (1997). Volcano geodesy: The search for magma reservoirs and the formation of eruptive vents. Reviews of Geophysics, 35, 343–384.
Ebmeier, S.K. (2016). Application of independent component analysis to multitemporal InSAR data with volcanic case studies. Journal of Geophysical Research: Solid Earth, 121(12), 8970–8986.
Ebmeier, S.K., Biggs, J., Mather, T.A., Amelung, F. (2013). Applicability of InSAR to tropical volcanoes: Insights from Central America. In Remote Sensing of Volcanoes and Volcanic Processes: Integrating Observation and Modelling, Pyle, D.M., Mather, T.A., Biggs, J. (eds). Geological Society, London.
Ebmeier, S.K., Andrews, B.J., Araya, M.C., Arnold, D.W.D., Biggs, J., Cooper, C., Cottrell, E., Furtney, M., Hickey, J., Jay, J., Lloyd, R., Parker, A.L., Pritchard, M.E., Robertson, E., Venzke, E., Williamson, J.L. (2018). Synthesis of global satellite observations of magmatic and volcanic deformation: Implications for volcano monitoring and the lateral extent of magmatic domains. Journal of Applied Volcanology, 7(2), 1–26.
Ferrucci, F., Prata, F., Amelung, F., Bawden, G., Biggs, J., Briole, P., Del Negro, C., Eineder, M., Jordan, C., Loughlin, S., Puglisi, G., Bianchi, M., Tait, S., Theys, N., Schneider, D., Norbury, D. (2012). Perspectives concerning satellite EO and geohazard risk management: Volcanic hazards. In The International Forum on Satellite EO and Geohazards, The Santorini Conference, Bally, P. (ed.). European Space Agency, Santorini.
Froger, J.-L., Fukushima, Y., Briole, P., Staudacher, T., Souriot, T., Villeneuve, N. (2004). The deformation field of the August 2003 eruption at Piton de la Fournaise, Reunion Island, mapped by ASAR interferometry. Geophysical Research Letters, 31, L14601.
Froger, J.-L., Famin, V., Cayol, V., Augier, A., Michon, L., Lénat, J.-F. (2015). Time-dependent displacements during and after the April 2007 eruption of Piton de la Fournaise, revealed by interferometric data. Journal of Volcanology and Geothermal Research, 296, 55–68.
Froger, J.-L., Pinel, V., Bato, M.-G., Tridon, M., Smittarello, D., Prival, J.-M., Hrysiewicz, A., Cayol, V., Guehenneux, Y. (2020). Apport des données sar à la compréhension et à la surveillance des volcans : exemple du piton de la fournaise. Revue française de photogrammétrie et de télédétection, (219–220), 83–90.
Fukushima, Y., Cayol, V., Durand, P., Massonnet, D. (2010). Evolution of magma conduits during the 1998–2000 eruptions of Piton de la Fournaise volcano, Réunion Island. Journal of Geophysical Research: Solid Earth, 115(B10).
Furtney, M.A., Pritchard, M.E., Biggs, J., Carn, S.A., Ebmeier, S.K., Jay, J.A., Kilbride, B.T., Reath, K.A. (2018). Synthesizing multi-sensor, multi-satellite, multi-decadal datasets for global volcano monitoring. Journal of Volcanology and Geothermal Research, 365, 38–56.
Gaddes, M.E., Hooper, A., Bagnardi, M., Inman, H., Albino, F. (2018). Blind signal separation methods for InSAR: The potential to automatically detect and monitor signals of volcanic deformation. Journal of Geophysical Research: Solid Earth, 123(11), 10226–10251.
Gaddes, M.E., Hooper, A., Bagnardi, M. (2019). Using machine learning to automatically detect volcanic unrest in a time series of interferograms. Journal of Geophysical Research: Solid Earth, 124(11), 12304–12322.
Galetto, F., Hooper, A., Bagnardi, M., Acocella, V. (2020). The 2008 eruptive unrest at Cerro Azul Volcano (Galápagos) revealed by InSAR data and a novel method for geodetic modelling. Journal of Geophysical Research: Solid Earth, 125(2), e2019JB018521.
Galland, O., Bertelsen, H.S., Guldstrand, F., Girod, L., Johannessen, R.F., Bjugger, F., Burchardt, S., Mair, K. (2016). Application of open-source photogrammetric software MicMac for monitoring surface deformation in laboratory models. Journal of Geophysical Research: Solid Earth, 121(4), 2852–2872.
Grandin, R., Socquet, A., Binet, R., Klinger, Y., Jacques, E., de Chabalier, J.-B., King, G.C.P., Lasserre, C., Tait, S., Tapponnier, P., Delorme, A., Pinzuti, P. (2009). September 2005 Manda Hararo-Dabbahu rifting event, Afar (Ethiopia): Constraints provided by geodetic data. Journal of Geophysical Research: Solid Earth, 114.
Gray, A.L., Mattar, K.E., Sofko, G. (2000). Influence of ionospheric electron density fluctuations on satellite radar interferometry. Geophysical Research Letters, 27(10), 1451–1454.
Hanssen, R.F. (2001). Radar Interferometry – Data Interpretation and Error Analysis, 1st edition. Kluwer Academic Publishers, Dordrecht.
Harris, A., Chevrel, M., Coppola, D., Ramsey, M., Hrysiewicz, A., Thivet, S., Villeneuve, N., Favalli, M., Peltier, A., Kowalski, P., Muro, A.D., Froger, J., Gurioli, L. (2019). Validation of an integrated satellite-data-driven response to an effusive crisis: The April–May 2018 eruption of Piton de la Fournaise. Annals of Geophysics, 61(0), 48.
Hollingsworth, J., Leprince, S., Ayoub, F., Avouac, J.-P. (2012). Deformation during the 1975–1984 Krafla rifting crisis, NE Iceland, measured from historical optical imagery. Journal of Geophysical Research: Solid Earth, 117(B11).
Hooper, A., Bekaert, D., Spaans, K., Arikan, M. (2012). Recent advances in SAR interferometry time series analysis for measuring crustal deformation. Tectonophysics, 514–517, 1–13.
Kilbride, B.M., Edmonds, M., Biggs, J. (2016). Observing eruptions of gas-rich compressible magmas from space. Nature Communications, 7, 13744 EP.
Kubanek, J., Richardson, J.A., Charbonnier, S.J., Connor, L.J. (2015a). Lava flow mapping and volume calculations for the 2012–2013 Tolbachik, Kamchatka, fissure eruption using bistatic TanDEM-X InSAR. Bulletin of Volcanology, 77, 106.
Kubanek, J., Westerhaus, M., Schenk, A., Aisyah, N., Sri Brotopuspito, K., Heck, B. (2015b). Volumetric change quantification of the 2010 Merapi eruption using TanDEM-X InSAR. Remote Sensing of Environment, 164, 16–25.
Kubanek, J., Poland, M., Biggs, J. (2021). Applications of bistatic radar to volcano topography – A review of 10 years of TanDEM-X. IEEE Journal of Selected Topics in Applied Earth Observations and Remote Sensing, 14, 3282–3302.
Lazecky, M., Hatton, E., Gonzalez, P.J., Hlavacova, I., Jirankova, E., Dvorak, F., Sustr, Z., Martinovic, J. (2020). Displacements monitoring over Czechia by IT4S1 system for automatised interferometric measurements using Sentinel-1 data. Remote Sensing, 12(18).
Li, Z., Fielding, E.J., Cross, P., Muller, J.-P. (2006). Interferometric synthetic aperture radar atmospheric correction: GPS topography-dependent turbulence model. Journal of Geophysical Research: Solid Earth, 111, B02404.
Lin, Y.-N., Kositsky, A.P., Avouac, J.-P. (2010). PCAIM joint inversion of InSAR and ground-based geodetic time series: Application to monitoring magmatic inflation beneath the Long Valley Caldera. Geophysical Research Letters, 37(23), L23301.
Liu, Y.-H., Ruch, J., Bathke, H., Jonsson, S. (2019). Influence of ring faulting in localizing surface deformation at subsiding calderas. Earth and Planetary Science Letters, 526, 115784.
Ma, L., Liu, Y., Zhang, X., Ye, Y., Yin, G., Johnson, B.A. (2019). Deep learning in remote sensing applications: A meta-analysis and review. ISPRS Journal of Photogrammetry and Remote Sensing, 152, 166–177.
Massonnet, D. and Souyris, J.C. (2008). Imaging with Synthetic Aperture Radar. CRC Press, Boca Raton.
Massonnet, D., Briole, P., Arnaud, A. (1995). Deflation of Mount Etna monitored by spaceborne radar interferometry. Nature, 375, 567–570.
Meyer, F.J., Whitley, M., Logan, T., McAlpin, D.B., Hogenson, K., Nicoll, J.B. (2019). The sarviews project: Automated processing of Sentinel-1 SAR data for geoscience and hazard response. IEEE International Geoscience and Remote Sensing Symposium, 5468–5471.
Michel, R., Avouac, J.-P., Taboury, J. (1999). Measuring ground displacements from SAR amplitude images: Application to the Landers earthquake. Geophysical Research Letters, 26, 875–878.
Morishita, Y., Lazecky, M., Wright, T.J., Weiss, J.R., Elliott, J.R., Hooper, A. (2020). LiCSBAS: An open-source InSAR time series analysis package integrated with the liCSAR automated Sentinel-1 InSAR processor. Remote Sensing, 12(3), 424.
Newhall, G.C. and Self, S. (1982). The volcanic explosivity index (VEI) an estimate of explosive magnitude for historical volcanism. Journal of Geophysical Research: Oceans, 87(C2), 1231–1238.
Page, E.S. (1954). Continuous inspection schemes. Biometrika, 41, 100–115.
Peltier, A., Staudacher, T., Catherine, P., Ricard, L.-P., Kowalski, P., Bachélery, P. (2006). Subtle precursors of volcanic eruptions at Piton de la Fournaise detected by extensometers. Geophysical Research Letters, 33, L06315.
Peltier, A., Villeneuve, N., Ferrazzini, V., Testud, S., Hassen, A.T., Boissier, P., Catherine, P. (2018). Changes in the long-term geophysical eruptive precursors at Piton de la Fournaise: Implications for the response management. Frontiers in Earth Science, 6(22), 104.
Pinel, V., Poland, M., Hooper, A. (2014). Volcanology: Lessons learned from synthetic aperture radar imagery. Journal of Volcanology and Geothermal Research, 289, 81–113.
Poland, M.P. (2014). Time-averaged discharge rate of subaerial lava at Kīlauea Volcano, Hawai‘i, measured from TanDEM-X interferometry: Implications for magma supply and storage during 2011–2013. Journal of Geophysical Research: Solid Earth, 119(7), 5464–5481.
Pritchard, M.E. and Simons, M. (2002). A satellite geodetic survey of large-scale deformation of volcanic centres in the central Andes. Nature, 418, 167–171.
Pritchard, M.E., Biggs, J., Wauthier, C., Sansosti, E., Arnold, D.W.D., Delgado, F., Ebmeier, S.K., Henderson, S.T., Stephens, K., Cooper, C., Wnuk, K., Amelung, F., Aguilar, V., Mothes, P., Macedo, O., Lara, L.E., Poland, M.P., Zoffoli, S. (2018). Towards coordinated regional multi-satellite InSAR volcano observations: Results from the Latin America pilot project. Journal of Applied Volcanology, 7(1), 5.
Pyle, D.M., Mather, T.A., Biggs, J. (2013). Remote sensing of volcanoes and volcanic processes: Integrating observation and modelling – Introduction. In Remote Sensing of Volcanoes and Volcanic Processes: Integrating Observation and Modelling, Pyle, D.M., Mather, T.A., Biggs, J. (eds). Geological Society, London.
Reath, K., Pritchard, M., Poland, M., Delgado, F., Carn, S., Coppola, D., Andrews, B., Ebmeier, S.K., Rumpf, E., Henderson, S., Baker, S., Lundgren, P., Wright, R., Biggs, J., Lopez, T., Wauthier, C., Moruzzi, S., Alcott, A., Wessels, R., Griswold, J., Ogburn, S., Loughlin, S., Meyer, F., Vaughan, G., Bagnardi, M. (2019). Thermal, deformation, and degassing remote sensing time series (CE 2000-2017) at the 47 most active volcanoes in Latin America: Implications for volcanic systems. Journal of Geophysical Research: Solid Earth, 124(1).
Reath, K., Pritchard, M., Biggs, J., Andrews, B., Ebmeier, S.K., Bagnardi, M., Girona, T., Lundgren, P., Lopez, T., Poland, M. (2020). Using conceptual models to relate multiparameter satellite data to subsurface volcanic processes in Latin America. Geochemistry, Geophysics, Geosystems, 21(1), e2019GC008494.
Remy, D., Bonvalot, S., Briole, P., Murakami, M. (2003). Accurate measurements of tropospheric effects in volcanic areas from SAR interferometry data: Application to Sakurajima volcano (Japan). Earth and Planetary Science Letters, 213, 299–310.
Remy, D., Froger, J.-L., Perfettini, H., Bonvalot, S., Gabalda, G., Albino, F., Cayol, V., Legrand, D., Saint Blanquat, M.D. (2014). Persistent uplift of the Lazufre volcanic complex (Central Andes): New insights from PCAIM inversion of InSAR time series and GPS data. Geochemistry, Geophysics, Geosystems, 15(9), 3591–3611.
Richter, N. and Froger, J.-L. (2020). The role of interferometric synthetic aperture radar in detecting, mapping, monitoring, and modelling the volcanic activity of Piton de la Fournaise, La Réunion: A review. Remote Sensing, 12(6).
Ruch, J., Wang, T., Xu, W., Hensch, M., Jónsson, S. (2016). Oblique rift opening revealed by reoccurring magma injection in Central Iceland. Nature Communications, 7(1), 12352.
Shreve, T., Grandin, R., Boichu, M., Garaebiti, E., Moussallam, Y., Ballu, V., Delgado, F., Leclerc, F., Vallée, M., Henriot, N., Cevuard, S., Tari, D., Lebellegard, P., Pelletier, B. (2019). From prodigious volcanic degassing to caldera subsidence and quiescence at Ambrym (Vanuatu): The influence of regional tectonics. Scientific Reports, 9(1), 18868.
Sigmundsson, F., Hooper, A., Hreinsdottir, S., Vogfjord, K.S., Ofeigsson, B.G., Heimisson, E.R., Dumont, S., Parks, M., Spaans, K., Gudmundsson, G.B., Drouin, V., Arnadottir, T., Jonsdottir, K., Gudmundsson, M.T., Hognadottir, T., Fridriksdottir, H.M., Hensch, M., Einarsson, P., Magnusson, E., Samsonov, S., Brandsdottir, B., White, R.S., Agustsdottir, T., Greenfield, T., Green, R.G., Hjartardottir, A.R., Pedersen, R., Bennett, R.A., Geirsson, H., La Femina, P.C., Bjornsson, H., Palsson, F., Sturkell, E., Bean, C.J., Mollhoff, M., Braiden, A.K., Eibl, E.P.S. (2015). Segmented lateral dyke growth in a rifting event at Bárðarbunga volcanic system, Iceland. Nature, 517(7533), 191–195.
Smittarello, D., Cayol, V., Pinel, V., Froger, J.-L., Peltier, A., Dumont, Q. (2019a). Combining InSAR and GNSS to track magma transport at Basaltic volcanoes. Remote Sensing, 11(19), 2236.
Smittarello, D., Cayol, V., Pinel, V., Peltier, A., Froger, J.-L., Ferrazzini, V. (2019b). Magma propagation at Piton de la Fournaise from joint inversion of InSAR and GNSS. Journal of Geophysical Research: Solid Earth, 124(2), 1361–1387.
Sparks, R.S.J., Biggs, J., Neuberg, J.W. (2012). Monitoring volcanoes. Science, 335, 1310–1311.
Surono, M., Jousset, P., Pallister, J., Boichu, M., Buongiorno, M.F., Budisantoso, A., Costa, F., Andreastuti, S., Prata, F., Schneider, D., Clarisse, L., Humaida, H., Sumarti, S., Bignami, C., Griswold, J., Carn, S., Oppenheimer, C., Lavigne, F. (2012). The 2010 explosive eruption of Java’s Merapi volcano – A “100-year” event. Journal of Volcanology and Geothermal Research, 241–242, 121–135.
Syahbana, D.K., Kasbani, K., Suantika, G., Prambada, O., Andreas, A.S., Saing, U.B., Kunrat, S.L., Andreastuti, S., Martanto, M., Kriswati, E., Suparman, Y., Humaida, H., Ogburn, S., Kelly, P.J., Wellik, J., Wright, H.M.N., Pesicek, J.D., Wessels, R., Kern, C., Lisowski, M., Diefenbach, A., Poland, M., Beauducel, F., Pallister, J., Vaughan, R.G., Lowenstern, J.B. (2019). The 2017–19 activity at Mount Agung in Bali (Indonesia): Intense unrest, monitoring, crisis response, evacuation, and eruption. Scientific Reports, 9(1), 8848.
Syamsidik, Benazir, Luthfi, M., Suppasri, A., Comfort, L.K. (2020). The 22 December 2018 Mount Anak Krakatau volcanogenic tsunami on Sunda Strait coasts, Indonesia: Tsunami and damage characteristics. Natural Hazards and Earth System Sciences, 20(2), 549–565.
Vadon, H. and Sigmundsson, F. (1997). Crustal deformation from 1992 to 1995 at the Mid-Atlantic ridge, Southwest Iceland, mapped by satellite radar interferometry. Science, 275(5297), 194–197.
Voight, B. (1990). The 1985 Nevado del Ruiz volcano catastrophe: Anatomy and retrospection. Journal of Volcanology and Geothermal Research, 42(1), 151–188.
Voight, B., Sparks, R.S.J., Miller, A.D., Stewart, R.C., Hoblitt, R.P., Clarke, A., Ewart, J., Aspinall, W.P., Baptie, B., Calder, E.S., Cole, P., Druitt, H., Hartford, C., Herd, R.A., Jackson, P., Lejeune, A.M., Lockhart, A.B., Loughlin, S.C., Luckett, R., Lynch, L., Norton, G.E., Robertson, R., Watson, I.M., Watts, R., Young, S.R. (1999). Magma flow instability and cyclic activity at Soufriere Hills Volcano, Montserrat, British West Indies. Science, 283, 1138–1142.
Watts, R.B., Herd, R.A., Sparks, R.S.J., Young, S.R. (2002). Growth patterns and emplacement of the andesitic lava dome at Soufriére Hills volcano, Montserrat. In The Eruption of the Soufriére Hills Volcano, Montserrat, from 1995 to 1999, Druitt, T.H. and Kolelaar, B.P. (eds). Geological Society, London.
Wauthier, C., Cayol, V., Poland, M., Kervyn, F., D’Oreye, N., Hooper, A., Samsonov, S., Tiampo, K., Smets, B. (2013). Nyamuragira’s magma plumbing system inferred from 15 years of InSAR. In Remote Sensing of Volcanoes and Volcanic Processes: Integrating Observation and Modelling, Pyle, D.M., Mather, T.A., Biggs, J. (eds). Geological Society, London.
Wittmann, W., Sigmundsson, F., Dumont, S., Lavallée, Y. (2017). Post-emplacement cooling and contraction of lava flows: InSAR observations and a thermal model for lava fields at Hekla volcano, Iceland. Journal of Geophysical Research: Solid Earth, 122(2), 946–965.
Wright, T., Ebinger, C., Biggs, J., Ayele, A., Yirgu, G., Keir, D., Stork, A. (2006). Magma-maintained rift segmentation at continental rupture in the 2005 Afar dyking episode. Nature, 442.
Yan, Y. (2011). Fusion de mesures de déplacement issues d’imagerie SAR : application aux modélisations séismo-volcaniques. PhD thesis, University of Grenoble, Grenoble.
Yu, C., Li, Z., Penna, N.T., Crippa, P. (2018). Generic atmospheric correction model for interferometric synthetic aperture radar observations. Journal of Geophysical Research: Solid Earth, 123(10), 9202–9222.
Zebker, H.A., Rosen, P.A., Hensley, S. (1997). Atmospheric effects in interferometric synthetic aperture radar surface deformation and topographic maps. Journal of Geophysical Research, 102, 7547–7563.