
9
Anthropogenic Activity: Monitoring Surface-Motion Consequences of Human Activities with Spaceborne InSAR
Bénédicte FRUNEAU1, Dinh HO TONG MINH2 and Daniel RAUCOULES3
1LaSTIG, Gustave Eiffel University, Champs-sur-Marne, France
2UMR-TETIS, INRAE, France
3BRGM, Orléans, France
9.1. Introduction
Human activities ranging from water pumping for drinking water or irrigating purposes, to oil and gas extraction from buried reservoirs or underground structures often result in depletion or uplift of the ground. Subsurface anthropogenic activity can also amplify natural subsidence and can even trigger significant earthquakes (Grandin et al. 2017). Human-related deformation has been widely observed and covers a broad range of scales, both spatial and temporal: it includes diffuse and low ground subsidence (i.e. mainly vertical downward displacement) covering large areas, as well as fast and punctual subsidence, depending on the involved phenomena. Monitoring the spatial extent and temporal evolution of surface deformations is critical for the mitigation of related hazards, since they may affect populations, buildings and infrastructures. This is especially a major issue in urban areas, and more so in densely populated ones such as megacities, but also in coastal areas where subsidence can increase vulnerability to flooding and impact sea level rise (Chaussard et al. 2013). Several cities in the world are facing significant land subsidence due to groundwater over-extraction. In addition to threatening infrastructures, deformation can have important consequences on clean water access and on economic sustainability. The monitoring of human-induced surface deformation is sometimes mandatory and imposed by regulations. Land surface deformation is usually measured with ground-based methods, such as leveling, tiltmeters, inclinometers, total stations and extensometers, often complemented with GNSS measurements. These techniques, which are well recognized by authorities, are characterized by high precision but they are pointwise, i.e. they can only measure deformation at a limited number of discrete points and a limited spatial extent. In addition, they require ground-based instrumentation and thus only give access to measurement after installation. In contrast, remotely sensed observations do not depend on in situ deployment and are essential for mapping large regions. In particular, the use of satellite-based synthetic aperture radar (SAR) imagery processed by interferometry (InSAR) allows the measurement of large-scale land motion with unprecedented spatial resolution from space. Moreover, the current data archive – covering more than 25 years – allows the analysis of non-instrumented past motions. InSAR, as a space-based geodetic tool, thus provides interesting imaging capability for the mapping and monitoring of land motion in response to anthropogenic activities. In the 1990s, InSAR was first used to complete ground-based monitoring, providing access to a synoptic view of deformation. Over the years, it has evolved, improving its capability to map, monitor and analyze deformations, and provided new insights into deformation and physical-related processes, in particular through modeling. Thanks to the development of advanced time-series interferometric methods (see Chapter 5), especially since the early 2000s with persistent scatterer interferometry, InSAR has become much more precise. It is nowadays close to being systematically used in addition to in situ instrumentation as an operational tool for low-cost, high-density and large-coverage surface deformation monitoring.
9.2. Characteristics of subsidence/uplift phenomena associated with human activity
9.2.1. Underground activities
Underground construction works, such as tunneling projects and construction of new underground infrastructures, can lead to possible deformations at the surface and potential damage to buildings and infrastructures. More generally, ground deformation related to human activities can be the direct result of excavation (creating underground voids, i.e. cavities) or a consequence of the compaction of underground materials due to fluid extraction. In the case of underground construction works such as tunneling projects, water pumping is often required to enable the construction process in dry conditions. This water pumping reduces the piezometric head and induces ground subsidence, thus leading to possible damage in surrounding structures and buildings.
Groundwater extraction for industrial, agricultural or domestic purposes can also trigger land subsidence (Motagh et al. 2008). Oil and gas production, another activity aimed at underground fluid extraction, result in similar (in terms of size and motion rate) surface motion phenomena as water pumping. In both cases, the upper crust above the reservoir or aquifer is compacted due to the reduction in pressure caused by the removal of fluid, resulting in surface damage (e.g. to buildings or infrastructures required for the oil/gas extraction). Thus, there is a strong need to understand the dynamics and extent of subsidence, including for the requirements of exploitation itself (e.g. for the safety of the extraction wells). It is worth noting that, in contrast to other phenomena presented in this book, the evolution of deformation (and thus the consequences of the motion) can be modified by human action. Moreover, gas storage is specific to the production activity from the point of view of the surface motion’s response. Due to consumption needs, the resulting motion has seasonal periodicity: gas is mostly injected (resulting in uplift) in summer for storage and extracted (resulting in subsidence) in winter for consumption. In addition to damage to infrastructures and buildings, land subsidence may also have dramatic consequences, as it may increase the risk of flooding in coastal areas (Tung and Hu 2012). Ground subsidence depends on the compressibility of the aquifer and can be partly recovered if the underground water level rises again.
Urban subsidence due to underground activities can constitute a major hazard. In many cities, subsidence-related risk has become increasingly common, particularly Mexico, Bangkok, Bandung and Hanoi (Aobpaet et al. 2013). Subsidence resulting from extensive groundwater extraction is a major concern for these cities facing rapidly developing urbanization and an increasing water demand. Planning responses to ground subsidence requires knowledge about its spatial extent and its evolution over time. For example, Castellazzi et al. (2016) have shown that land subsidence in Querétaro City (Central Mexico) of up to 8 cm/year has been almost entirely mitigated by major changes in the water management practices of the city.
9.2.2. Cavities
Subsidence resulting from artificial cavities has plagued the extractive industries (mines and quarries) for a long time. Particularly, underground mining (including dissolution mining for salt and potash) and quarrying activities produce caverns (empty or filled with water or brine) from where material is extracted. Noteworthy is the fact that before the Industrial Age, material for construction – when these materials were locally available – were extracted directly below the urban centers. This has led to the presence of quarrying cavities underground the historical centers of numerous European cities, inducing a risk of cavity collapse. In some cases, land subsidence is the consequence of the collapse of underground cavities weakened by the dissolution of limestone or other materials (e.g. pillars in underground mines) by groundwater. These phenomena weaken the support structure for rocks surrounding pumping wells or created voids and eventually cause them to collapse. These activities hinder the ability to extract underground resources and damage the ground infrastructure, affecting the water management of large land areas. Surface deformations associated with extraction are generally monitored by operating companies for safety reasons (to protect infrastructures and surroundings and anticipate potential issues) and also to adapt the production means in order to minimize the surface consequences.
9.2.3. Suitability of the interferometric SAR techniques
The conventional spaceborne InSAR takes advantage of two SAR acquisitions to obtain the interferometric phase, which contains information on any potential surface displacement occurring between the acquisitions. This interferometric phase is composed of different components related to deformation, residual topography and atmosphere and is hampered by decorrelation noise. The goal is to estimate the deformation phase from the interferometric phase. The biggest challenge is certainly the fact that the interferometric phase can only be measured as a wrapped phase (see Chapter 6). InSAR has several issues relative to spatial and temporal decorrelations, as well as the atmosphere, which cannot be efficiently eliminated, resulting in interferograms not representing the ground deformation perfectly. This deficiency can be overcome by a specific analysis considering phase changes in a series of SAR images acquired at different times over the same region. The rationale of the InSAR time series is to combine multiple flight tracks to minimize the different issues: InSAR time-series analysis is a powerful SAR processing technique that makes it possible to track millimeter-scale surface deformation over long periods, some years typically (see Chapter 5). Two different approaches are generally used. The first approach is carried out from the wrapped phase, such as permanent/persistent scatterer interferometry (PSI) techniques, which use so-called point-like targets for deformation analysis. In the second approach, the unwrapped phase is required, as in small baseline (SB) techniques that exploit distributed targets (DSs) for deformation measurements.
In urban areas, PSI techniques are very powerful and, in general, outperform SB approaches. If the density of these point targets is high enough, it is possible to measure surface deformations with millimeter-scale precision. A drawback is that the computational effort required for processing point-like targets is high. However, for non-urban applications (e.g. volcanoes, landslides and permafrost), SB techniques, which use distributed targets, are more efficient. More details on these techniques can be found in Chapter 5 and in the study by Ho Tong Minh et al. (2020).
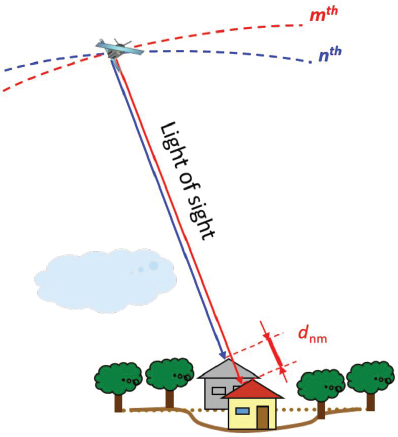
Figure 9.1. An example of target motion captured using the InSAR technique. For a color version of this figure, see www.iste.co.uk/cavalie/images.zip
In Figure 9.1, an example of target motion between the n-th and m-th acquisition times is shown. Once the displacement phase ![]() is estimated, its phase value is transformed into a metric as follows:
is estimated, its phase value is transformed into a metric as follows:
where dnm is the light-of-sight (LOS) distance change of the target1, v is the constant velocity and tnm is the temporal baseline between the n-th and m-th images.
The development of advanced multi-temporal interferometric techniques (PSI, PSDS and SBAS; see Chapter 5) and improved processing algorithms, combined with increasing accessibility of SAR images (including free and open access to the data acquired by the European Sentinel-1) and sensors with shorter revisit times and/or higher resolution, has greatly improved the monitoring of subsidence related to anthropogenic activities.
9.2.4. Optimum SAR data properties for monitoring anthropogenic activities
Due to the expected characteristics (geometry/size and motion rate) of the ground surface deformation resulting from human activities, some parameters of the data to be used can be emphasized.
9.2.4.1. Satellite repeat cycle
Typical anthropogenic surface deformation velocity can range from mm/year (e.g. residual post-mining motions) to m/year (e.g. collapses induced by underground activities). Slow motions are better assessed by relying on long time-spans to ensure that enough deformation occurs within the revisit time. PSI techniques, working on points little affected by temporal decorrelation, can be particularly efficient for long time-spans in areas where PS densities are sufficient (e.g. urban areas). In contrast, constraining faster motions requires shorter repeat cycles in order to avoid unwrapping errors. The shortest revisit time currently available for spaceborne SAR is less than a week (e.g. Sentinel-1, COSMO SkyMed). Despite the quick access to data and fast processing, InSAR still cannot be used as an alert system for real-time detection of abnormal movement.
9.2.4.2. Spatial resolution
The spatial extent of subsidence/uplift related to human activities ranges from a few tens of square meters for superficial collapses due to underground work to hundreds of square kilometers for motion related to water table changes (induced by pumping). Accordingly, depending on the context and objectives, the appropriate resolution can range from the meter scale to ~100 m. With high-resolution data, such as TerraSAR-X and COSMO SkyMed data, it is now even possible to measure through PSI the gradient of displacement within structures such as bridges or buildings (Lazecky et al. 2017; Weissgerber et al. 2017).
9.2.4.3. Archive continuity
Some phenomena resulting from human activity (such as post-mining deformation) can last for decades. Data availability over a long period is therefore required. Archived data (e.g. ERS-1/2 SAR, Envisat ASAR and ALOS-1 PalSAR data) are therefore of great interest for the calculation of the evolution of deformation over time. Moreover, since SAR data have been available since 1991, they can be exploited for retro-analysis of a phenomenon, even prior to the installation of ground instruments. Strategic planning of future missions should follow the Copernicus Sentinel-1 initiative, which guarantees continuity of free and open SAR data for the next decade through the development of a SAR satellite constellation.
9.2.4.4. Radar wavelength
The capabilities of radar sensors differ depending on the land-cover type (vegetated vs. urban). Sensors with longer wavelengths (e.g. L-band) are preferable in vegetated areas as they allow for greater penetration through the vegetation. Extractive (e.g. gas/oil production, mining) activities are often located in non- or partially urbanized areas. L-band SAR sensors (as provided by ALOS-1/2 and the future NISAR mission) are the most valuable. Similarly, L-band SAR sensors enable capture of rapid deformation as – due to the longer wavelength – L-band InSAR accepts larger motions between acquisitions than C-band (see e.g. Plattner et al. (2010) or Raucoules et al. (2007)).
9.3. Application examples: urban underground activities
9.3.1. Urban underground construction works
In urban areas, underground constructions require continuous monitoring to anticipate unexpected events and mitigate related risks.
In the late 1990s, InSAR was successfully used to map surface deformation related to construction works. The first examples of the application of SAR interferometry in urban areas were based on conventional InSAR, and it has shown its efficiency in the urban context, where coherence loss is not critical. There was, for example, the case of the Saint-Lazare area in Paris (France), which underwent important water pumping for the construction of the underground Haussmann–Saint-Lazare station for the Eole subway line in 1993. InSAR allowed the mapping of a large subsiding area near the station related to the water pumping (Fruneau and Sarti 2000). Temporal variations of the vertical displacements monitored in this area enabled the seperation of the different phases of the construction works – namely, subsidence, stability and uplift – linked to the pumping activity (Le Mouélic et al. 2002; Fruneau et al. 2005) (Figure 9.2). It was also shown that InSAR offered a better estimate of the spatial extension of the deforming area, which had been underestimated with leveling.
In Naples (Italy), where intensive construction of an underground railway was conducted between 1992 and 1995, deformations observed by InSAR were correlated with the excavation of the galleries (Tesauro et al. 2000). The use of advanced InSAR techniques, in particular PSI, has been generalized for underground construction monitoring. There are many examples of its application in tunneling projects. In the city of Bologna, in the framework of the high-speed Milan–Naples railway, the large construction project included a double-track tunnel crossing an urban area at shallow depths of about 10 m, with a high density of residential buildings and commercial activities. In this context, InSAR study made it possible to measure displacements in the order of cm/year (Figure 9.3) and also to isolate displacement induced by the excavation work from the natural subsidence induced by natural sediment compaction and groundwater exploitation.
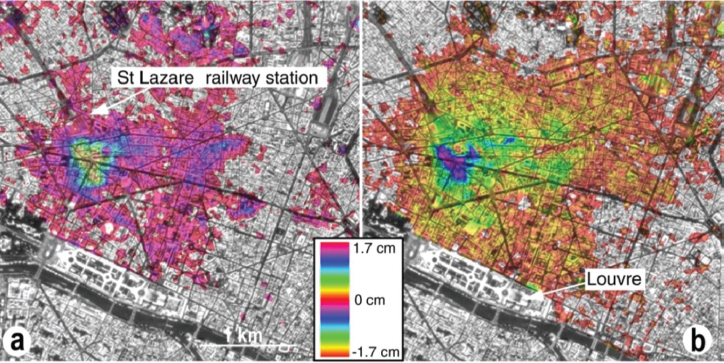
Figure 9.2. Deformation measured by InSAR with ERS images in the Saint-Lazare area (Paris) during the construction of the Haussmann–Saint-Lazare station (RER Eole). (a) Map of cumulate subsidence due to the start of water pumping from May 1994 to April 1995. (b) Map of cumulate uplift due to the end of water pumping and the slow recharge of the nappe (from June to October 1998) (Fruneau et al. (2005)). For a color version of this figure, see www.iste.co.uk/cavalie/images.zip
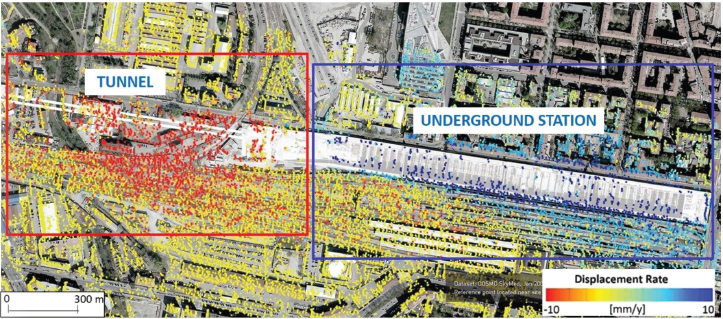
Figure 9.3. Bologna high-speed railway site. Average displacement rate measured during the post-construction period (2009–2011; courtesy of TRE ALTAMIRA). Some subsidence (on the left) is still evident over the tunnel advance section that was only completed in early 2010, while uplift on the east side is related to the rebound effect on the completed underground station (MacDonald et al. (2015)). For a color version of this figure, see www.iste.co.uk/cavalie/images.zip
Many cities around the world have exploited PSI for their tunneling projects: Madrid (Garcia et al. 2019); Lyon, for the construction of TEO urban highway (Thierry et al. 2005); Rennes, for the construction of subway line B (Nahli et al. 2018); the Vancouver metropolitan area, for the Canada Line LRT (Falorni and Iannacone 2014); Shanghai (Perissin et al. 2012); Beijing (Ge et al. 2016); and Paris, with the Grand Paris Express (Koudogbo et al. 2018). These measurements show the relationship between tunneling and surface settlements (Barla et al. 2016).
InSAR can be applied during all phases of tunneling projects: before, to identify pre-existing ground movements; during the work; and after the completion of the work for residual deformation monitoring. It allows coverage wider than the surroundings, in which most in situ instruments are deployed.
A recent study underlines the importance of using InSAR prior to tunneling. In east London, patterns of deformation during the construction of the Lee Tunnel were observed using InSAR with Radarsat-2 images in the 2010–2015 period, in particular subsidence at and around Newton hospital. This could be interpreted as a consequence of an unexpected geological feature discovered during tunneling. Thanks to an InSAR analysis of the period before tunneling (with 1999–2010 ERS and Envisat data), unusual and long-term deformation could be noted. This shows the importance of InSAR analysis prior to tunneling work (Scoular et al. 2020).
9.3.2. Urban groundwater extraction
InSAR is a valuable tool for monitoring surface displacements in response to aquifer deformation, both subsidence and uplift, accompanying groundwater discharge and recharge. InSAR also plays a growing role in evaluating water-management practices and in implementing appropriate water-management strategies that may include subsidence mitigation.
This has been shown from the first examples of InSAR applications, which involved mapping substantial and large-scale subsidence resulting from overdrafting of water resources in Antelope Valley, California (Galloway et al. 1998); Mexico City (Strozzi and Wegmuller 1999); and Las Vegas (Amelung et al. 1999). It has been proven that InSAR can measure the spatial extension and the magnitude of surface deformation associated with aquifer-system compaction. In Las Vegas Valley, where groundwater was pumped at a rate of two to three times more than the natural recharge and represented 25% of the water supply, detailed InSAR-derived ground deformation maps have shown that the extent of the subsidence was controlled by geological structures (Quaternary faults) and sediment composition (Figure 9.4). The temporal variability of surface displacements also highlighted seasonal subsidence and uplift associated with seasonal water decline and recovery.
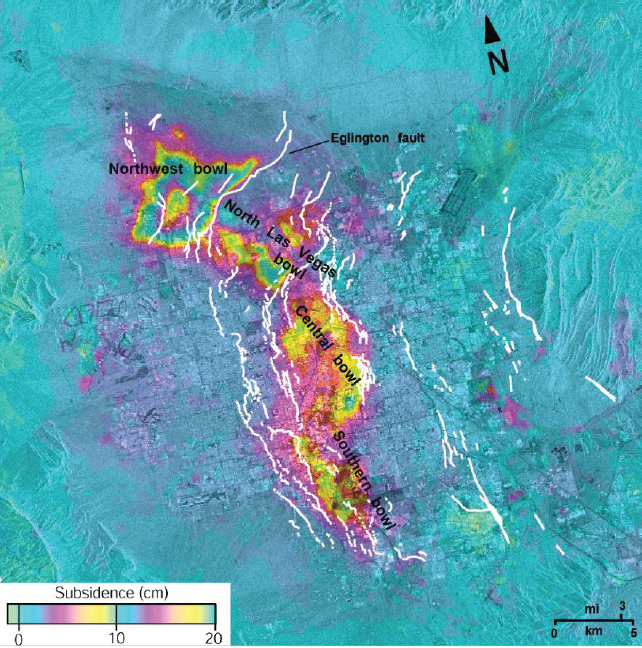
Figure 9.4. A five-year interferogram (April 1992 to December 1997) shows the full extent of the aquifer system and 190 mm of localized subsidence in a distinct bowl in the northwest part of the valley. Faults are subsidence barriers (Amelung et al. (1999)). For a color version of this figure, see www.iste.co.uk/cavalie/images.zip
In southeastern Iran, decades of extensive groundwater extraction in the Rafsanjan plain, which is used mainly for agricultural activities, have caused substantial land subsidence, monitored by InSAR, in an area of 1000 km2, with subsidence larger than 5 cm/year and exceeding 20–30 cm/year during the 2000s, degrading large parts of the agricultural lands (Motagh et al. 2017). The average volume storage loss of the aquifer system has also been estimated to be 300 million m3/year over the last decade. InSAR has greatly facilitated the monitoring of land subsidence in many metropolitan areas where vulnerability has continuously increased over the years, such as Las Vegas (Amelung et al. 1999; Hoffmann et al. 2001), Mexico City (Osmanoğlu et al. 2011; Yan et al. 2012; Chaussard et al. 2014), Venice (Bock et al. 2012) and Ho Chi Minh City (Ho Tong Minh et al. 2015).
In Central Mexico, as well as the well-known case of Mexico City, Castellazzi et al. (2016) addressed land subsidence problems in five other cities located within the Trans-Mexican Volcanic Belt, where compaction of an over-exploited aquifer causes significant structural damage to urban infrastructures with costly consequences. Water sewage structures must be constantly upgraded due to loss of gradient, and transitional areas between lacustrine beds and slope deposits are prone to severe differential subsidence, damaging housing and urban infrastructures.
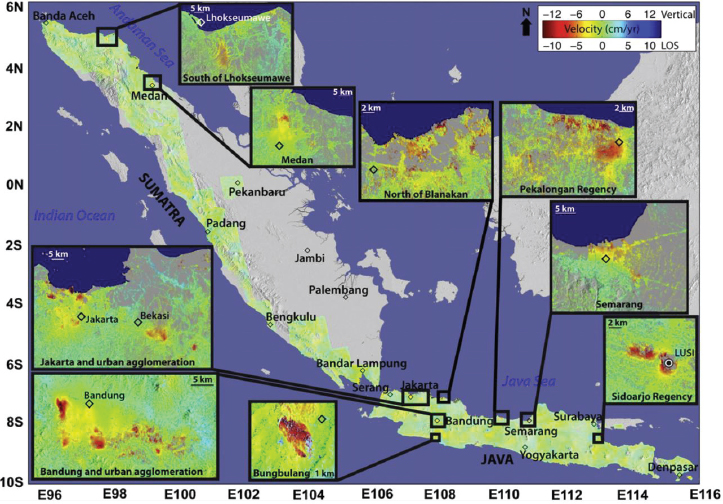
Figure 9.5. Averaged 2006–2009 LOS velocity map of Sumatra, Java and Bali from ALOS InSAR time-series analysis. Insets: magnification of the subsiding areas. Major cities are shown by black diamonds and labeled for reference. The color scale shows red colors for negative LOS velocities (subsidence) and blue colors for positive LOS velocities (uplift). Vertical subsidence rates converted from the LOS rates are labeled on the color scale (Chaussard et al. 2013). For a color version of this figure, see www.iste.co.uk/cavalie/images.zip
This phenomenon is especially critical in coastal areas. In Western Indonesia, InSAR time-series analysis has revealed subsidence in nine locations, including six major cities, including Jakarta, the capital and largest city of Indonesia (Chaussard et al. 2013) (Figures 9.5 and 9.6). Subsidence rates up to 22 cm/year have been measured. Rapid subsidence observed in cities is due to industrial groundwater extraction, while groundwater extraction for agricultural use and gas field exploitation induce subsidence in other places. Land subsidence is a major concern in those areas, as it increases the risk of major flooding: they could be below relative sea level within decades (or less). Manilla in the Philippines is another example of a city presenting the same kind of significant deformation (>10 cm/year) (Raucoules et al. 2013).
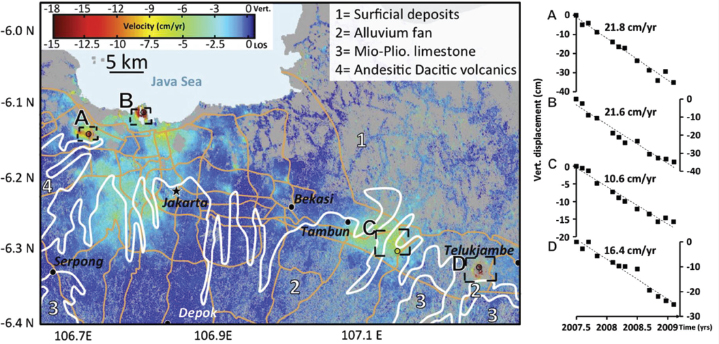
Figure 9.6. Subsidence observed near Jakarta. a) Average 2007–2009 velocity map. The contours of the geological units are shown by white lines and referred to using white numbers. Black circles within the boxes show the locations of the pixels whose time series are shown in b). b) Vertical displacement time series and corresponding linear rates of subsidence (Chaussard et al. 2013). For a color version of this figure, see www.iste.co.uk/cavalie/images.zip
These studies underline the importance of continuous InSAR monitoring of subsidence related to water withdrawal, which can help to mitigate hazards associated with this phenomenon. It can help water management slow down the subsidence processes and reduce the risk of inundation. This is crucial, as permanent inundation of densely populated coastal areas is a major threat for the coming decades.
Numerous studies have shown that the precise monitoring of subsidence offered by InSAR provides key elements that enhance the hydrogeologic understanding on different points: it enables the identification of groundwater flow barriers, characterization of seasonal surface deformation and estimation of aquifer-system storage and it provides additional constraints for numerical groundwater flow models (Galloway and Hoffmann 2007). InSAR can help characterize aquifer system properties and also evaluate management practices (Hoffmann et al. 2001; Chaussard et al. 2014, 2017; Bell et al. 2008; Motagh et al. 2008). In particular, InSAR allows better characterization of the elastic and inelastic properties of aquifer systems (Hoffmann et al. 2001; Tomás et al. 2011; Tung et al. 2016). Chaussard and Farr (2019) have proposed a new method, based on an independent component analysis, for isolating elastic from inelastic deformations in aquifer systems. Separating recoverable from permanent deformation of aquifer systems is of prime interest for resource management since elastic properties are used to define sustainable pumping rates. In this context, InSAR can be seen as a valuable tool assisting in groundwater resources management.
In the following, two applications of InSAR are detailed: one study conducted on Mexico City using Sentinel-1 images with high temporal sampling and the other on Hanoi with high-resolution TerraSAR-X and COSMO SkyMed data.
9.3.2.1. Mexico case study
Mexico City is the capital of Mexico and the most populated city in North America, with more than 21 million people in 2020. The Mexico City metropolitan area consumes over 65 m3/s of water and more than 70% of it comes from the aquifer beneath the city (Castellazzi et al. 2016). In a typical year, consumption exceeds recharge, lowering the water table by up to 1.5 m/year, reducing pore fluid pressure in the aquifer and overlying aquitard and leading to compaction of lacustrine shales and surface subsidence. The subsidence induced by deep well pumping has been affecting Mexico City since the end of the 19th century. Subsidence rates in many of Earth’s urban areas are relatively low (< 10 mm/year) and local (< 100 km2). However, Mexico City areas have undergone accelerated ground subsidence with much higher rates over a larger region since the 1950s, with an average subsidence rate of 90 mm/year for the 20 year period from 1965 to 1985 in the downtown area (Castellazzi et al. 2016).
Many studies measuring Mexico City subsidence by radar interferometry have focused on time-series analysis, which is capable of precisely mapping Mexico City subsidence in time and space (Osmanoğlu et al. 2011; Yan et al. 2012; Chaussard et al. 2014). These studies show that the Mexico subsidence zone has a Pac-Man-shape and that the largest subsidence rate can easily exceed 30 cm/year in many regions.
To obtain the recent displacement history, we processed 245 Sentinel-1 images (April 2015–April 2020) using the PSI technique. Figure 9.7 depicts the mean velocity maps in Mexico City from 2015 to 2020. The total PS pixels are more than four million, with corresponding densities of 2,500 point/km2. The velocity profile and displacement history are shown in Figure 9.8.
The subsidence zone fits well with the lacustrine unit composed of soft and compressible silts and clays with relatively low permeability. This indicates that subsidence is due to pressure loss in the shallow aquitard (clay-rich lake sediments) associated with groundwater overdraft (withdrawal in excess of recharge). This has implications for water management in the Mexico City metropolitan area because compaction of clay-rich aquitards is often associated with permanent loss of porosity and reservoir capacity.

Figure 9.7. Mexico city mapping. (a) Geological spatial information. Mexico Basin stratigraphy can be classified in three zones: (1) hard rock, (2) transitional and (3) lacustrine. (b) Averaged velocity (mm/year) from 2015 to 2020. A Pac-Man-shaped subsidence zone can be observed with subsidence over 30 cm/year. For a color version of this figure, see www.iste.co.uk/cavalie/images.zip
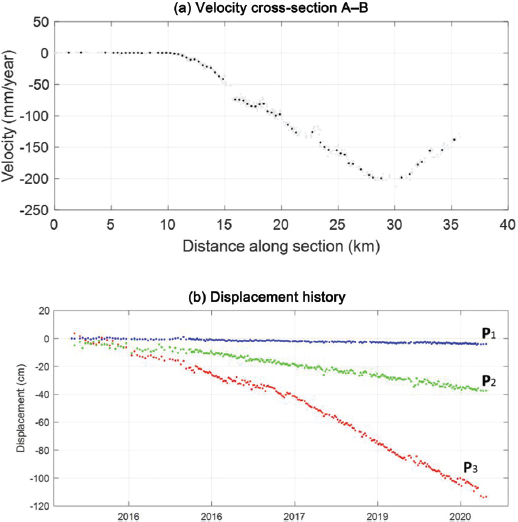
Figure 9.8. The velocity and displacement history in Mexico City at the locations in Figure 9.7. (a) Velocity cross-section along points A and B. (b) Displacement history for three points. Subsidence is not primarily seasonal, which agrees well with findings presented by Osmanoğlu et al. (2011), Yan et al. (2012) and Chaussard et al. (2014). For a color version of this figure, see www.iste.co.uk/cavalie/images.zip
9.3.2.2. Hanoi case study
Hanoi is the capital of Vietnam and is located in the Red River delta. It is a megacity with more than eight million people (in 2020) and great potential for the development of industry, exports, tourism and services. Hanoi is a good example of a quickly urbanized city in Vietnam, where water for domestic and industrial use comes from wells located within and around the city. In this city, the rapid increase in groundwater use started in the late 2010s (the groundwater abstraction was approximately 350,000 m3/day in 1999 and 630,000 m3/day in 2012, whereas the sustainable level of abstraction is estimated to be at most 300,000 m3/day (Ho Tong Minh et al. 2019)). Heavy pumping of groundwater has produced a serious subsidence problem, which in turn has affected surface structures in Hanoi.
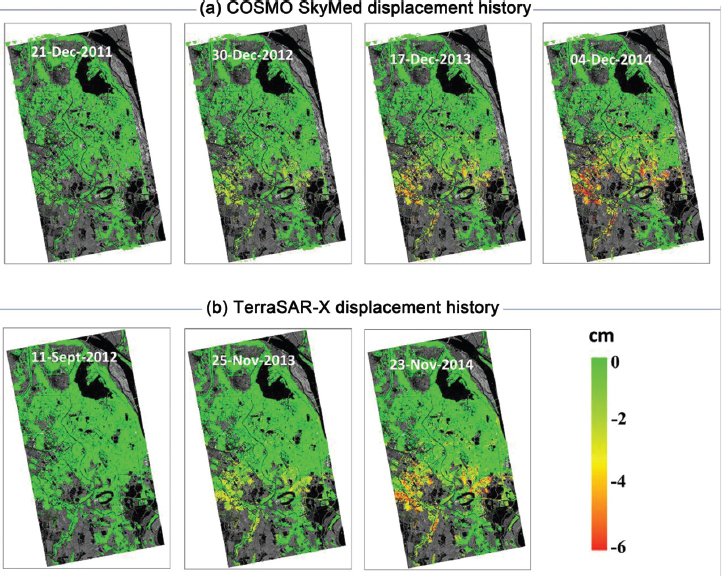
Figure 9.9. The vertical displacement history (cm) in Hanoi city. The background is the average backscatter TerraSAR-X data. (a) Displacement derived from COSMO SkyMed data. (b) Displacement derived from TerraSAR-X data (Ho Tong Minh et al. 2019). For a color version of this figure, see www.iste.co.uk/cavalie/images.zip
In the Hanoi area, the InSAR approach has demonstrated its ability for mapping ground deformation using L-band (Dang et al. 2014) and X-band (Tran et al. 2015; Le et al. 2016; Ho Tong Minh et al. 2019). Studies so far have estimated ground subsidence using both classical and multi-temporal InSAR methods. Ho Tong Minh et al. (2019) showed that the InSAR technique can be effective in detecting and estimating subsidence phenomena, even in X-band and under conditions typical of tropical regions.
Two SAR stacks were exploited for the period 2011–2014: a TerraSAR-X dataset composed of 19 ascending acquisitions from April 10, 2012, to November 23, 2014, and a second one with 27 ascending COSMO SkyMed images acquired between May 27, 2011, and December 4, 2014. All images were processed using the PSDS method. More than 810,000 PSDS measuring points in the TerraSAR-X (LOS angle 34.4 degrees) and 420,000 PSDS measuring points in the COSMO SkyMed (LOS angle 25.2 degrees) datasets were identified within an area of about 200 km2. In Figure 9.9, the displacement results obtained from TerraSAR-X and COSMO SkyMed datasets appear consistent, with a correlation coefficient (R2) of 0.91 for the period of observation. A comparison with leveling data showed root mean square errors (RMSEs) of 3.4 mm/year for TerraSAR-X results and 2.9 mm/year for COSMO SkyMed ones.
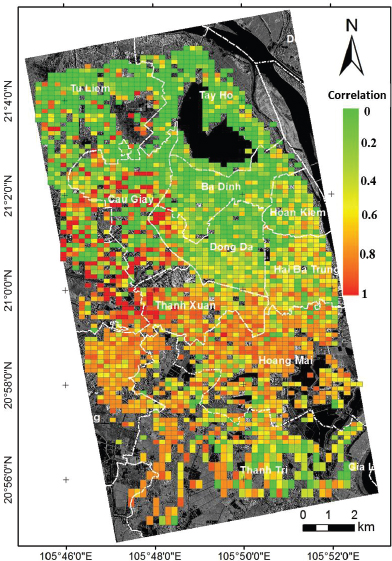
Figure 9.10. The correlation between ground subsidence value as estimated by InSAR and groundwater fluctuation in the Pleistocene aquifer (qp) (Ho Tong Minh et al. 2019). For a color version of this figure, see www.iste.co.uk/cavalie/images.zip
To correlate the subsidence with the groundwater level, all well fields in Hanoi were used to compute the Pleistocene aquifer (qp) water level with a groundwater flow model. Figure 9.10 illustrates the correlation between the ground subsidence value as estimated by InSAR and groundwater fluctuation in the Pleistocene aquifer (qp). High correlation coefficients of greater than 0.6 were found in four areas: Ha Dong, Phap Van, Linh Dam and Hoang Mai. All of them are in the southern part of Hanoi and high subsidence values were found in the cone of depression (the area influenced by exploited groundwater). In contrast, in the Hoan Kiem district in central Hanoi, including sites such as the Ngo Si Lien and Yen Phu well fields, strong subsidence was not confined in the cone of depression and the correlation coefficient was quite low. This again indicates that the cone of depression from groundwater exploitation is not the single significant cause of ground subsidence in central Hanoi, where subsoil characteristics can be another factor. We observed that the risk of ground subsidence in Hanoi was found in the south of city areas where thick soft-soil layers are present.
9.4. Applications in mineral resources extractive activities
9.4.1. Brine, oil and gas extraction/injection
9.4.1.1. Brine extraction
Among the techniques applied for extracting mineral salt, solution mining is the most commonly used for industrial salt production (Klingman 1975). It is based on the circulation of water between boreholes: freshwater is injected to dissolve salt mineral and brine is pumped from another borehole several meters away. As with other types of industrial pumping of underground fluid resources, brine extraction results in ground motion. The resulting subsidence depends on the local properties of the site (such as the salt layer depth and cap-rock characteristics) and on the production (pumping rates and positions of the boreholes). In addition, this mining method produces caverns (located at the injection and pumping points) filled with brine that can evolve in the long term, including after the closure of the mine (Berest et al. 2005). Monitoring is therefore required to forecast potential surface consequences.
An example of the application of interferometric techniques is the site of the salt mine in Vauvert, France, which has been used for assessments of the relevance of InSAR techniques (Raucoules et al. 2003). Subsidence of about 2 cm/year with a 7 km diameter was observed (Figure 9.11). In this example, the exploited salt layer was located at depths of 1,800–3,000 m.
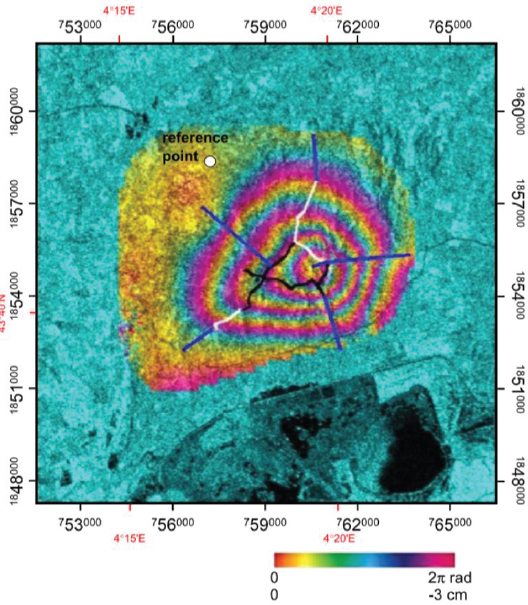
Figure 9.11. Stack of interferograms showing the total deformation observed between 1993 and 1999 at the salt mine in Vauvert, France. Ground-based leveling networks are shown with black lines for the monitoring network and white lines for the stability network. Blue lines show the proposed increase in coverage of the leveling network based on InSAR analysis (Raucoules et al. 2003; Furst et al. 2021). For a color version of this figure, see www.iste.co.uk/cavalie/images.zip
9.4.1.2. GAS injection/extraction
As with all exploitation of underground fluids, natural gas production and storage can result in small (mm to several cm) vertical motions. Monitoring the associated ground deformation allows the detection of any unexpected motions (e.g. different from the motion modeled on the basis on the production values and underground characteristics) due to integrity issues in the reservoir (leakages being the more concerning issues). InSAR techniques have been used for such monitoring of gas production and storage sites. If different techniques can produce useful information for natural gas production (resulting generally only in subsidence), monitoring of the seasonal evolution of gas storage with InSAR requires use of time series with sufficient SAR acquisitions per year. From this perspective, missions with short repeat cycles (such as Sentinel-1, with a six-day repeat cycle) offer an interesting tool.
The example of the CO2 injection demonstrator at Krechba/In Salah (Algeria) is particularly significant. A series of CO2 injection tests were performed at this natural gas production site between 2004 and 2011 (http://www.insalahco2.com). In addition to ground-based observations, spaceborne InSAR (PSI and conventional interferometry) made it possible to map the resulting deformation (Vasco et al. 2008; Onuma and Ohkawa 2009). Over the period monitored, uplift of about 5–7 mm/year over an area of 4–5 km was observed. The asymmetry (Figure 9.12) of the surface deformation geometry has been interpreted as related to faults.
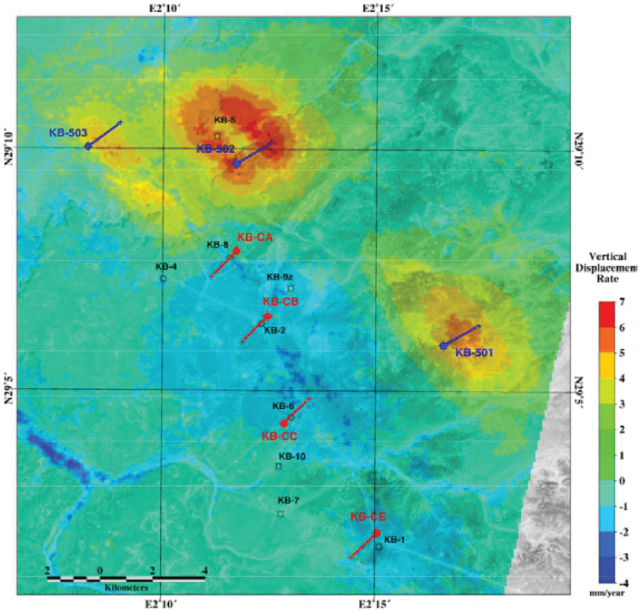
Figure 9.12. Vertical displacement (adapted from Onuma and Ohkawa (2009)) in the In Salah gas production site between July 31, 2004, and May 31, 2008, resulting from CO2 injection. Positions of the injection wells are indicated. For a color version of this figure, see www.iste.co.uk/cavalie/images.zip
Another example of gas storage ground-surface-motion characterization is given by Burnol et al. (2019). In this case, annual vertical displacements of a few millimeters were detected at the storage site of Izaute-Lussagnet (Southwestern France). Acquisitions from the Sentinel-1 satellite were processed by persistent scatterer interferometry in order to observe and quantify the ground displacement during a three-year period above the gas storage site. In this study, the cyclic (annual) motion was characterized by the amplitude and phase of the annual component of the obtained time series. The amplitude quantifies (in millimeters) the annual displacement, the phase (radians that can be converted in days) when – over the year – the displacement is maximal. Such information can be derived from the time series by fitting it by a sine function or with Fourier or wavelet analysis. The resulting amplitudes of the vertical periodic displacements range between 4 and 8 mm (values representative of a gas storage in European), which are close to the noise level but sufficient to show the seasonal variations due to storage activity during summer and winter periods. The ground deformation was simulated with a simple mechanical model (taking into account production data and reservoir characteristics). An interesting aspect of the study was the use of soil moisture data to investigate the possibility of separating motion related to the storage from shallow phenomena (clay shrinking/swelling) based on the phase. Indeed, both phenomena have annual cyclicity with similar amplitudes but are shifted in time in related to the production (for the gas storage) or the surface soil moisture (for the clay shrinking). This asynchronicity can be detected in the phase information, making it possible to distinguish persistent scatterers affected by superficial phenomena from those related to the storage activity.
9.4.1.3. Oil extraction
Extraction of oil, like other forms of extraction of fluids from buried reservoirs, may cause ground subsidence. Fielding et al. (1998) were the first to use InSAR to map the subsidence over two oilfields (Lost Hills and Belridge) in central California. Rapid subsidence rates of up to 40 mm in 35 days (i.e. an annual rate of about 400 mm/year) were measured thanks to ERS data. Initial elastic strain modeling, giving information on volume change in the rock units at depth, confirmed the relevance of InSAR for such applications.
In recent decades, oil production activities have started to use novel recovery methods (enhanced oil recovery (EOR)) based on hydraulic fracturation, horizontal drilling and deep injection of fluid or steam to drive the oil out of the reservoir. Oil production activities are then characterized by both subsidence and uplift. In particular, monitoring surface uplift can deliver information about injection distribution and impact. It can indicate a potential steam/fluid excess and thus an increasing risk. Ground measurement can be seen as a tool to maximize injection efficiency, while limiting the risks to the extraction area. In northern Alberta (Canada), the oil sands contain one of the world’s largest deposits of crude oil in the form of viscous bitumen embedded within uncemented sand. For reserves deeper than about 65 m (more than 80% of the recoverable bitumen in Alberta), a steam-assisted gravity drainage technique is used to extract bitumen, with horizontal wells that are drilled into the reservoir side by side, maximizing contact between the injected steam and the reservoir. An InSAR deformation survey has shown surface uplift at rates of 1–4 cm/year, associated with active steam injection at all sampled sites (Pearse et al. 2014). Rates of uplift are well correlated with rates of steam injection despite a net loss of total reservoir fluids with time.
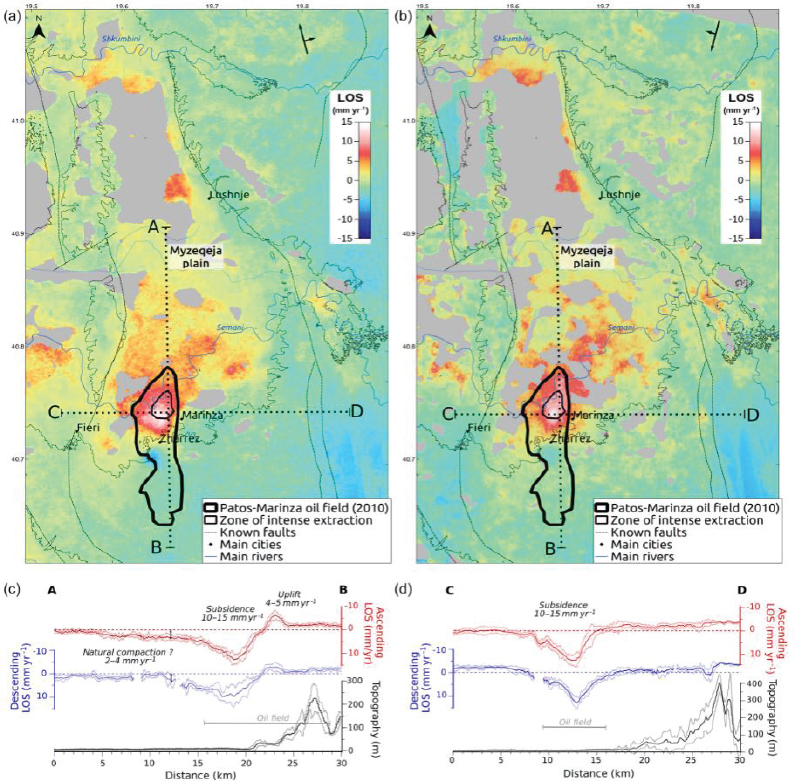
Figure 9.13. LOS average-velocity maps for the ascending (a) and descending (b) tracks over the Patos-Marinza oil field. Positive values correspond to motion away from the satellite, i.e. mostly subsidence. Dotted lines indicate the locations of the profiles in (c) and (d). North–south (c) and west–east (d) velocity profiles across the oil field’s most intense deformation zone together with topography profiles (c and d) (Métois et al. (2020)). For a color version of this figure, see www.iste.co.uk/cavalie/images.zip
Another hazard induced by oil production is related to the significant and rapid changes in the stress field at depth caused by enhanced oil recovery: extensive extraction and injection of fluid may also induce earthquakes. It has been observed that EOR techniques may trigger non-tectonic seismic activity. Grandin et al. (2017) has shown that the 2016 Oklahoma Mw 5.7 Pawnee earthquake that broke a previously unknown basement fault was probably induced by wastewater disposal under the Oklahoma oil and gas field. In the year preceding the mainshock, it was reported that at least two wells were injecting saltwater at rates exceeding 500 m3/day within 7 km of the epicenter, and there were also increases in the injection rates at two wells located near the epicenter. At the Karamay oilfield (China), Yang et al. (2019) monitored deformation related to oil production by exploiting Sentinel-1 images from March 2017 to August 2018. On this site, where a previous study conducted before 2010 with Envisat and ALOS images showed a maximum accumulated uplift of 200 mm between 2006 and 2011, the maximum uplift rate was > 160 mm/year, while subsidence was about 32 mm/year. However, no evidence could be given that low-magnitude earthquakes within and around the oilfield were related to oil production activities.
Patos-Marinza oil field (Albania), one of the largest onshore oil fields in Europe with more than 7 million oil barrels extracted every year, is another example where an InSAR time-series analysis was conducted during the 2014–2018 period. Based on Sentinel-1 data, slow regional subsidence of the entire basin of about 2.5 mm/year was measured. It was interpreted as a natural compaction phenomenon of this alluvial-to-deltaic plain, most probably amplified by human activities (Métois et al. 2020). However, another deformation pattern, roughly circular and superimposed on the overall subsidence of the plain, is centered over the oil field, and exhibits large subsidence rates of up to 15 mm/year, resulting from EOR techniques (Figure 9.13). One concern was to investigate if the apparent recent increase of local seismicity could be a consequence of the use of EOR techniques in this area. However, local seismological arrays were too sparse to answer this question and suggest that stress changes associated with the oil extraction were sufficient to trigger earthquakes.
9.4.2. Mining activities
Mining activities have a significant impact on the surrounding areas (environment, infrastructures, etc.), requiring monitoring from the beginning of the extraction work to decades after the end of the extraction (the period of mitigation of post-mining consequences). Ground-based monitoring techniques are generally required by local regulations. Spaceborne SAR interferometry can contribute to such monitoring by complementing and partially replacing ground-based measurements. During the active phase of the work, monitoring of ground surface deformation allows the mining company to anticipate potential surface damages and adapt the on-going operations in order to reduce their impact. In addition, information on ground motion can be valuable for assessing damages and identify a possible link with underground work from the perspective of financial compensations for the damaged building owners. However, as pointed out by Raucoules and Foumelis (2020), the deformation (about 0.8% slope in the cited example, i.e. about 10 cm of cumulated differential subsidence at the scale of a house) required for justifying legal financial compensations is generally higher than displacements observable by spaceborne InSAR – due to the limitations of InSAR techniques with high deformations values. For this reason, InSAR provides useful information but needs to be complemented by other – ground-based – measurements/observations to be used in a risk management perspective.
After the closure of the mine, the liability on the site can be transferred to the authorities, which have to manage the long-term (up to centuries) consequences and rehabilitate the mining area. Residual ground motion is one of the consequences of past mining works. They are generally related to water table variations (after the end of mining works, pumping operations are stopped, resulting in an underground water level increase) that change the characteristics of the underground materials. The resulting motion may be subsidence, but uplift can also occur due to expansion of materials related to filling by water from the abandoned galleries (Figure 9.14 shows an example of post-mining uplift).
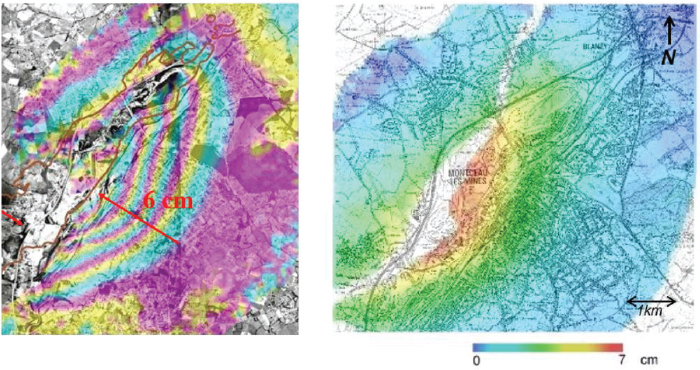
Figure 9.14. Example of post-mining uplift in Montceau-les-Mines, France, between 1996 and 1998 (adapted from Carnec et al. (2004)). Left: sum of two interferograms of ERS-1–2 data. Right: unwrapped interferogram stack converted into cumulative vertical motion (about 2.5 cm/year). The deformation stopped after 1998. Severe damage to buildings occurred on this area. For a color version of this figure, see www.iste.co.uk/cavalie/images.zip
In both cases, the resulting ground motion is related to the extraction techniques used during the mine’s activity.
In the case of exploitation with chambers and pillars, the ore layer is partially excavated, creating pillars that support the roof. Except in cases of accidental collapse, the resulting surface displacement is limited to the active phase. However, during the post-mining phase, due to the inundation of the mine, pillars can decay and filling materials’ characteristics can be modified, resulting in motions of significant amplitude (centimeters to meters). Plattner et al. (2010) presented an example of subsidence due to pillar collapse in 2007 in an active coal mine in Utah, which resulted in fatalities. ALOS-1 InSAR data enabled the mapping of 20 cm of ground deformation in an area of 1 km2.
When the mine is worked using longwall mining techniques, the panel is fully exploited. The roof of the panel is collapsed in a controlled way with the progression of the work. The resulting ground surface motion is therefore extensive during the active phase (about 75–85% of the total motion occurs during the several months after the excavation). The residual phase due to the compaction of the fillings lasts several years. In contrast to chamber and pillar techniques, most of the impact on the surface occurs within a few years. Perski (1999), Carnec and Delacourt (2000), Guéguen et al. (2009) and Engelbrecht et al. (2011) were among the firsts to use the InSAR method to monitor this type of ground motion (Figure 9.15).
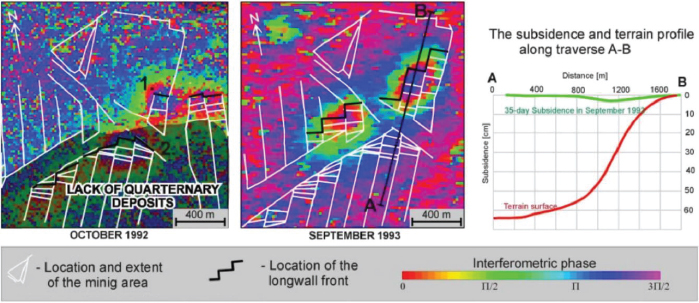
Figure 9.15. Example of InSAR monitoring applied to longwall mining activities in the Katowice area, Poland (adapted from Perski (1999)). For a color version of this figure, see www.iste.co.uk/cavalie/images.zip
9.5. Conclusion
In this chapter, we presented the application of spaceborne SAR interferometric techniques to ground surface (subsidence or uplift) deformation resulting from human activity. Such motions involve various scales in space and time – sizes ranging from a few meters to kilometers and motion rates from mm/year to sudden collapses – related to a diversity of phenomena. Fluid extraction (water pumping for human usage, agriculture or industry and oil/gas production) and cavity excavation (underground construction, mining and quarries) are the main anthropogenic sources of subsidence. Intensive groundwater withdrawal is becoming one of the major concerns for societies in all countries of the world, with growing water demand and increasing pressure on groundwater resources. Precise monitoring techniques of these ground surface motions are needed. This is essential to evaluate their consequences in terms of risk. It is also needed to characterize the involved processes and to help in providing exploitation/production management tools for resources, in particular for sustainable policies. From this perspective, spaceborne SAR interferometry can be a major source of information and is in use in an operational way in the concerned industrial activities. The increasing resolution and temporal sampling in the recent space missions (e.g. TerraSAR-X with high spatial resolution and Sentinel-1 with a high repeat cycle) and improvements expected in the future will make it possible to access more local and faster motions, offering a wider range of applications related to anthropogenic ground surface motion.
9.6. Acknowledgments
We thank Pierre Briole for his comments and edits to improve the quality of this chapter.
9.7. References
Amelung, F., Galloway, D.L., Bell, J.W., Zebker, H.A., Laczniak, R.J. (1999). Sensing the ups and downs of Las Vegas: InSAR reveals structural control of land subsidence and aquifer-system deformation. Geology, 27(6), 483–486.
Aobpaet, A., Caro Cuenca, M., Hooper, A., Trisirisatayawong, I. (2013). InSAR time-series analysis of land subsidence in Bangkok, Thailand. International Journal of Remote Sensing, 34, 2969–2982.
Barla, G., Tamburini, A., Del Conte, S., Giannico, C. (2016). InSAR monitoring of tunnel-induced ground movements. Geomechanics and Tunnelling, 9(1), 15–22.
Bell, J.W., Amelung, F., Ferretti, A., Bianchi, M., Novali, F. (2008). Permanent scatterer InSAR reveals seasonal and long-term aquifer-system response to groundwater pumping and artificial recharge. Water Resources Research, 44(2).
Berest, P., Brouard, B., Karimi-Jafari, M. (2005). Deep salt caverns abandonment. Post-Mining Symposium, Nancy, France.
Bock, Y., Wdowinski, S., Ferretti, A., Novali, F., Fumagalli, A. (2012). Recent subsidence of the Venice Lagoon from continuous GPS and interferometric synthetic aperture radar. Geochemistry, Geophysics, Geosystems, 13(3).
Burnol, A., Aochi, H., Raucoules, D., Veloso, F.M.L., Koudogbo, F.N., Fumagalli, A., Chiquet, P., Maisons, C. (2019). Wavelet-based analysis of ground deformation coupling satellite acquisitions (Sentinel-1, SMOS) and data from shallow and deep wells in Southwestern France. Scientific Reports, 9, 8812.
Carnec, C. and Delacourt, C. (2000). Three years of mining subsidence monitored by SAR interferometry, near Gardanne, France. Journal of Applied Geophysics, 43(1), 43–54.
Carnec, C., Le Mouelic, S., Raucoules, D., Colesanti, C., King, C. (2004). Avancées des technologies spatiales radar appliquées à la détection des déformations de surface d’origine minière. Revue française de géotechnique, 106–107, 15–22.
Castellazzi, P., Arroyo-Domínguez, N., Martel, R., Calderhead, A.I., Normand, J.C., Gárfias, J., Rivera, A. (2016). Land subsidence in major cities of Central Mexico: Interpreting InSAR-derived land subsidence mapping with hydrogeological data. International Journal of Applied Earth Observation and Geoinformation, 47, 102–111.
Chaussard, E. and Farr, T.G. (2019). A new method for isolating elastic from inelastic deformation in aquifer systems: Application to the San Joaquin Valley, CA. Geophysical Research Letters, 46(19), 10800–10809.
Chaussard, E., Amelung, F., Abidin, H., Hong, S.-H. (2013). Sinking cities in Indonesia: ALOS PALSAR detects rapid subsidence due to groundwater and gas extraction. Remote Sensing of Environment, 128, 150–161.
Chaussard, E., Bürgmann, R., Shirzaei, M., Fielding, E.J., Baker, B. (2014a). Predictability of hydraulic head changes and characterization of aquifer-system and fault properties from InSAR-derived ground deformation. Journal of Geophysical Research: Solid Earth, 119(8), 6572–6590.
Chaussard, E., Wdowinski, S., Cabral-Cano, E., Amelung, F. (2014b). Land subsidence in Central Mexico detected by ALOS InSAR time-series. Remote Sensing of Environment, 140, 94–106.
Chaussard, E., Milillo, P., Bargmann, R., Perissin, D., Fielding, E.J., Baker, B. (2017). Remote sensing of ground deformation for monitoring groundwater management practices: Application to the Santa Clara Valley during the 2012–2015 California drought. Journal of Geophysical Research: Solid Earth, 122(10), 8566–8582.
Dang, V.K., Doubre, C., Weber, C., Gourmelen, N., Masson, F. (2014). Recent land subsidence caused by the rapid urban development in the Hanoi region (Vietnam) using ALOS InSAR data. Natural Hazards and Earth System Sciences, 14(3), 657–674.
Engelbrecht, J., Inggs, M., Makusha, G. (2011). Detection and monitoring of surface subsidence associated with mining activities in the Witbank coalfields, South Africa, using differential radar interferometry. South African Journal of Geology, 114(1), 77–94.
Falorni, G. and Iannacone, J. (2014). Signature of tunneling-induced ground deformation in urban areas revealed by time series analysis. TAC 2014: Tunneling in a Resource Driven World, Vancouver, Canada.
Fielding, E.J., Blom, R.G., Goldstein, R.M. (1998). Rapid subsidence over oil fields measured by SAR interferometry. Geophysical Research Letters, 25(17), 3215–3218.
Fruneau, B. and Sarti, F. (2000). Detection of ground subsidence in the city of Paris using radar interferometry: Isolation of deformation from atmospheric artifacts using correlation. Geophysical Research Letters, 27(24), 3981–3984.
Fruneau, B., Deffontaines, B., Rudant, J.-P., Le Parmentier, A.-M. (2005). Monitoring vertical deformation due to water pumping in the city of Paris (France) with differential interferometry. Comptes Rendus Geoscience, 337(13), 1173–1183.
Furst, S.L., Doucet, S., Vernant, P., Champollion, C., Carme, J.-L. (2021). Monitoring surface deformation of deep salt mining in Vauvert (France), combining InSAR and leveling data for multi-source inversion. Solid Earth, 12(1), 15–34.
Galloway, D.L. and Hoffmann, J. (2007). The application of satellite differential SAR interferometry-derived ground displacements in hydrogeology. Hydrogeology Journal, 15(1), 133–154.
Galloway, D.L., Hudnut, K.W., Ingebritsen, S.E., Phillips, S.P., Peltzer, G., Rogez, F., Rosen, P.A. (1998). Detection of aquifer system compaction and land subsidence using interferometric synthetic aperture radar, Antelope Valley, Mojave Desert, California. Water Resources Research, 34(10), 2573–2585.
Garcia, A., Marchamalo, M., Martinez, R., Gonzalez-Rodrigo, B., Gonzalez, C. (2019). Integrating geotechnical and SAR data for the monitoring of underground works in the Madrid urban area: Application of the persistent scatterer interferometry technique. International Journal of Applied Earth Observation and Geoinformation, 74, 27–36.
Ge, D., Zhang, L., Li, M., Liu, B., Wang, Y. (2016). Beijing subway tunnelings and high-speed railway subsidence monitoring with PSInSAR and TerraSAR-X data. 2016 IEEE International Geoscience and Remote Sensing Symposium (IGARSS), 6883–6886.
Grandin, R., Vallée, M., Lacassin, R. (2017). Rupture process of the Mw 5.8 Pawnee, Oklahoma, earthquake from Sentinel-1 InSAR and seismological data. Seismological Research Letters, 88(4), 994–1004.
Guéguen, Y., Deffontaines, B., Fruneau, B., Al Heib, M., de Michele, M., Raucoules, D., Guise, Y., Planchenault, J. (2009). Monitoring residual mining subsidence of Nord/Pas-de-Calais coal basin from differential and persistent scatterer interferometry (Northern France). Journal of Applied Geophysics, 69(1), 24–34.
Ho Tong Minh, D., Van Trung, L., Toan, T.L. (2015). Mapping ground subsidence phenomena in Ho Chi Minh city through the radar interferometry technique using ALOS PALSAR data. Remote Sensing, 7(7), 8543–8562.
Ho Tong Minh, D., Tran, Q.C., Pham, Q.N., Dang, T.T., Nguyen, D.A., El-Moussawi, I., Le Toan, T. (2019). Measuring ground subsidence in Ha Noi through the radar interferometry technique using TerraSAR-X and Cosmos SkyMed data. IEEE Journal of Selected Topics in Applied Earth Observations and Remote Sensing, 12(10), 3874–3884.
Ho Tong Minh, D., Hanssen, R., Rocca, F. (2020). Radar interferometry: 20 years of development in time series techniques and future perspectives. Remote Sensing, 12(9).
Hoffmann, J., Zebker, H.A., Galloway, D.L., Amelung, F. (2001). Seasonal subsidence and rebound in Las Vegas Valley, Nevada, observed by synthetic aperture radar interferometry. Water Resources Research, 37(6), 1551–1566.
Klingman, C. (1975). Mineral Facts and Problems. U.S. Department of the Interior, Bureau of Mines, Washington, DC, USA.
Koudogbo, F., Urdiroz, A., Robles, J., Chapron, G., Lebon, G., Fluteaux, V., Priol, G. (2018). Radar interferometry as an innovative solution for monitoring the construction of the Grand Paris Express metro network – First results. World Tunnel Conference, 2–25 April, Dubai, United Arab Emirates.
Lazecky, M., Hlavacova, I., Bakon, M., Sousa, J.J., Perissin, D., Patricio, G. (2017). Bridge displacements monitoring using space-borne X-band SAR interferometry. IEEE Journal of Selected Topics in Applied Earth Observations and Remote Sensing, 10(1), 205–210.
Le, T., Chang, C., Nguyen, X., Yhokha, A. (2016). TerraSAR-X data for high-precision land subsidence monitoring: A case study in the historical Centre of Hanoi, Vietnam. Remote Sensing, 8(4), 338.
Le Mouélic, S., Raucoules, D., Carnec, C., King, C., Adragna, F. (2002). A ground uplift in the city of Paris (France) detected by satellite radar interferometry. Geophysical Research Letters, 29(17), 1–34.
MacDonald, B., Iannacone, J., Falorni, G., Gianniaco, C. (2015). InSAR-derived time series analysis of tunnel construction-induced ground deformation in urban landscapes. In Proceedings of the Ninth Symposium on Field Measurements in Geomechanics, Dight, P. (ed.). Australian Centre for Geomechanics, Crawley, Australia.
Métois, M., Benjelloun, M., Lasserre, C., Grandin, R., Barrier, L., Dushi, E., Koçi, R. (2020). Subsidence associated with oil extraction, measured from time series analysis of Sentinel-1 data: Case study of the Patos-Marinza oil field, Albania. Solid Earth, 11(2), 363–378.
Motagh, M., Walter, T.R., Sharifi, M.A., Fielding, E., Schenk, A., Anderssohn, J., Zschau, J. (2008). Land subsidence in Iran caused by widespread water-reservoir overexploitation. Geophysical Research Letters, 35, L16403.
Motagh, M., Shamshiri, R., Haghshenas Haghighi, M., Wetzel, H.-U., Akbari, B., Nahavandchi, H., Roessner, S., Arabi, S. (2017). Quantifying groundwater exploitation induced subsidence in the Rafsanjan Plain, southeastern Iran, using InSAR time-series and in situ measurements. Engineering Geology, 218, 134–151.
Nahli, A., Simonetto, E., Merrien-Soukatchoff, V., Durand, F., Rangeard, D. (2018). Sentinel-1 for monitoring tunnel excavations in Rennes, France. Procedia Computer Science, 138, 393–400.
Onuma, T. and Ohkawa, S. (2009). Detection of surface deformation related with CO2 injection by DInSAR at In Salah, Algeria. Energy Procedia, 1(1), 2177–2184.
Osmanoğlu, B., Dixon, T.H., Wdowinski, S., Cabral-Cano, E., Jiang, Y. (2011). Mexico city subsidence observed with persistent scatterer InSAR. International Journal of Applied Earth Observation and Geoinformation, 13(1), 1–12.
Pearse, J., Singhroy, V., Samsonov, S., Li, J. (2014). Anomalous surface heave induced by enhanced oil recovery in northern Alberta: InSAR observations and numerical modeling. Journal of Geophysical Research: Solid Earth, 119(8), 6630–6649.
Perissin, D., Wang, Z., Lin, H. (2012). Shanghai subway tunnels and highways monitoring through Cosmo-SkyMed persistent scatterers. ISPRS Journal of Photogrammetry and Remote Sensing, 73, 58–67.
Perski, Z. (1999). ERS InSAR data for geological interpretation of mining subsidence in Upper Silesian Coal Basin in Poland. FRINGE’99: Advancing ERS SAR Interferometry from Applications towards Operations, 10–12 November, Liège, Belgium.
Plattner, C., Wdowinski, S., Dixon, T.H., Biggs, J. (2010). Surface subsidence induced by the Crandall Canyon Mine (Utah) collapse: InSAR observations and elasto-plastic modelling. Geophysical Journal International, 183(3), 1089–1096.
Raucoules, D. and Foumelis, M. (2020). Monitoring mining/post-mining ground surface motion. Remote Sensing Applications to Geohazards and Natural Resources. Springer, New York, USA.
Raucoules, D., Maisons, C., Carnec, C., Le Mouelic, S., King, C., Hosford, S. (2003). Monitoring of slow ground deformation by ERS radar interferometry on the Vauvert salt mine (France): Comparison with ground-based measurement. Remote Sensing of Environment, 88(4), 468–478.
Raucoules, D., Colesanti, C., Carnec, C. (2007). Use of SAR interferometry for detecting and assessing ground subsidence. Comptes Rendus Geoscience, 339(5), 289–302.
Raucoules, D., Le Cozannet, G., Woppelmann, G., de Michele, M., Gravelle, M., Daag, A., Marcos, M. (2013). High nonlinear urban ground motion in Manila (Philippines) from 1993 to 2010 observed by DInSAR: Implications for sea-level measurement. Remote Sensing of Environment, 139, 386–397.
Scoular, J., Ghail, R., Mason, P., Lawrence, J., Bellhouse, M., Holley, R., Morgan, T. (2020). Retrospective InSAR analysis of East London during the construction of the Lee Tunnel. Remote Sensing, 12(5).
Strozzi, T. and Wegmuller, U. (1999). Land subsidence in Mexico City mapped by ERS differential SAR interferometry. IEEE International Geoscience and Remote Sensing Symposium, 1940–1942.
Tesauro, M., Berardino, P., Lanari, R., Sansosti, E., Fornaro, G., Franceschetti, G. (2000). Urban subsidence inside the city of Napoli (Italy) observed by satellite radar interferometry. Geophysical Research Letters, 27(13), 1961–1964.
Thierry, P., Deverly, F., Reppelin, M., Simonetto, E., Lembezat, C., Arandu, A., Raucoules, D., Closset, L., King, C. (2005). Survey of linear subsidence in an urban area using a 3D geological model and satellite differential InSAR. International Symposium Geoline, 23–25 May, Lyon, France.
Tomás, R., Herrera, G., Cooksley, G., Mulas, J. (2011). Persistent scatterer interferometry subsidence data exploitation using spatial tools: The Vega Media of the Segura River Basin case study. Journal of Hydrology, 400, 411–428.
Tran, Q.C., Ho Tong Minh, D., Le, V.T., Le Toan, T. (2015). Ground subsidence monitoring in Vietnam by multi-temporal InSAR technique. IEEE International Geoscience and Remote Sensing Symposium, 3540–3543.
Tung, H. and Hu, J.-C. (2012). Assessments of serious anthropogenic land subsidence in Yunlin county of central Taiwan from 1996 to 1999 by persistent scatterers InSAR. Tectonophysics, 578, 126–135.
Tung, H., Horng-Yue, C., Hu, J.-C., Ching, K.-E., Chen, H., Yang, K.-H. (2016). Transient deformation induced by groundwater change in Taipei metropolitan area revealed by high resolution X-band SAR interferometry. Tectonophysics, 692, 265–277.
Vasco, D.W., Ferretti, A., Novali, F. (2008). Reservoir monitoring and characterization using satellite geodetic data: Interferometric synthetic aperture radar observations from the Krechba field, Algeria. Geophysics, 73(6), WA113.
Weissgerber, F., Colin-Koeniguer, E., Nicolas, J.-M., Trouvé, N. (2017). 3D monitoring of buildings using TerraSAR-X InSAR, DInSAR and PolSAR capacities. Remote Sensing, 9(10), 1010.
Yan, Y., Doin, M., Lopez-Quiroz, P., Tupin, F., Fruneau, B., Pinel, V., Trouve, E. (2012). Mexico City subsidence measured by InSAR time series: Joint analysis using PS and SBAS approaches. IEEE Journal of Selected Topics in Applied Earth Observations and Remote Sensing, 5(4), 1312–1326.
Yang, C., Zhang, D., Zhao, C., Han, B., Sun, R., Du, J., Chen, L. (2019). Ground deformation revealed by Sentinel-1 MSBAS-InSAR time-series over Karamay oilfield, China. Remote Sensing, 11(17), 2027.
- 1. Note that InSAR measurements give access only to the LOS component of the displacement, whereas land subsidence or uplift, mainly vertical displacement, may include a horizontal component.