
In the previous recipe, we looked at String manipulations. In this section, let us focus on manipulations on numbers. However, before we move to arithmetic calculations, we must first understand the difference between aggregated and disaggregated measures. To elaborate on this, let us see an example. The two formulae are SUM(Profit) / SUM(Sales) and SUM(Profit / Sales).
The question is, whether these two formulae will give the same result or will they give different results?
From what we have learnt in school, we know that the Bracket operations or Parentheses will be computed first. We know this methodology as PEMDAS (Parentheses, Exponents, Multiply, Divide, Add, Subtract). Since many people tend to say brackets instead of parentheses and orders instead of exponents, it is also referred to as BODMAS (Brackets, Orders, Divide, Multiply, Add, Subtract) or BEDMAS (Brackets, Exponents, Divide, Multiply, Add, Subtract).
Based on this knowledge, we can clearly say that the output of the previously listed formulae will be different.
In the first formula, which is SUM(Profit) / SUM(Sales), the way the formula will be executed is as follows:
- Compute SUM(Profit).
- Compute SUM(Sales).
- Divide SUM(Profit) by SUM(Sales).
However, in the second formula, which is SUM(Profit / Sales), the execution will be as follows:
- Divide Profit by Sales (that is, divide transactional Profit by transactional Sales).
- SUM(Profit divided by Sales) (that is, sum up all the transactional output values from the previous step).
To put this in a more simplistic way, in the first calculation, the individual measures are first aggregated by doing a summation of all the rows of Profit and all the rows for Sales and the aggregated Profit is then divided by the aggregated Sales. However, in the second calculation, each and every single transactional Profit value is first divided by the respective transactional Sales and then added up.
Let us actually try this example out in Tableau to gain more perspective.
As usual, let us continue with our existing workbook by creating a new worksheet. We will use the Profit field and Sales field from the Orders sheet from Sample - Superstore.xlsx data. As stated in the preceding example, we will divide Profit by Sales in two ways using the formulae listed previously. Let us get started.
- Let us create a new sheet by pressing Ctrl + M and rename it Arithmetic Calculation. We will then drag the Sub-Category field from the Dimensions pane and drop it into the Rows shelf.
- Next, let us double-click on Profit from the Measures pane. Followed by double clicking on Sales from the Measures pane. Once we have done that, we should get the following view:
- We will now create a new calculated field by right clicking on the Profit field and selecting the option of Create Calculated Field….
- Let us name this Calculation as Profit Margin-disaggregated. The formula that we will type is as follows: SUM([Profit] / [Sales]).
- Making sure that we aren't missing any brackets or parentheses, we will check for any error messages. If it says The calculation is valid, we will click OK.
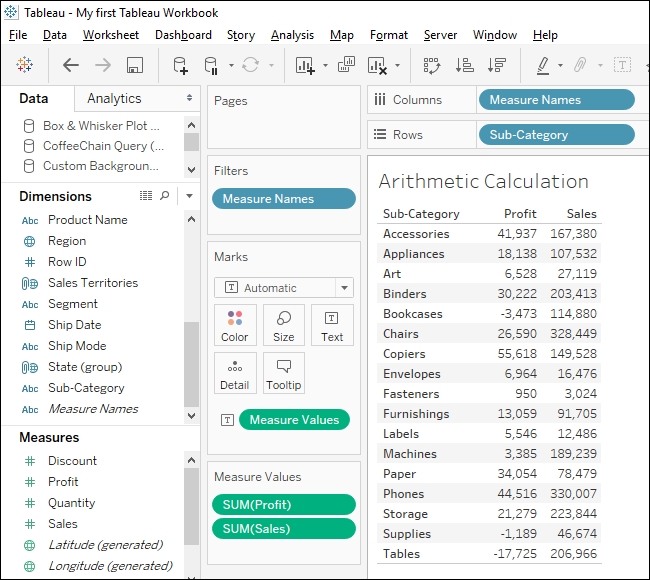
- We will now look for this new field in the Measures pane and double click on it. Our view will update, as shown in the following screenshot:

- We will rearrange the display of Measures in the view by dragging AGG(Profit Margin-disaggregated) and placing it after the SUM(Sales) field in the Measure Value shelf just below the Marks card. Refer to the following updated screenshot:

- If you look closely, the second row, that is, Appliances, has Profit of 18,138 and Sales of 107,532. When we divide this Profit value by the Sales value, the output should be 0.17. However, we are getting an output as -73. This is strange from two perspectives. Firstly, how can division of two positive numbers return a negative value? Secondly, we are dividing a smaller number by a larger number and hence should get a decimal value.
- If we look carefully in the Measure Values shelf, the original fields are called SUM(Profit) and SUM(Sales). Whereas in our calculation, which is SUM([Profit] / [Sales]), we are asking Tableau to compute a Profit divide by Sales for each transaction and then add it up at each Sub-Category level. Whereas, what we actually wanted to do was to divide SUM(Profit) for each Sub-Category and divide it by SUM(Sales) for that Sub-Category. Thus, we will create another calculated field and name it Profit Margin-aggregated.
- The formula will be: SUM([Profit]) / SUM([Sales]). We will click OK and then call this new field in the view by double clicking on it. The view will be as shown in the following screenshot:

- Once we do that, we will notice that all the displayed values are zero. This is because even though the output is a decimal number, Tableau by default rounds it off to the closest integer. Thus, in order to change the format, we will click on the dropdown of the Profit Margin-aggregated field in the Measure Values shelf and select the Format option. Once we do that, we will get a Format section on the left-hand side, just where we earlier had our Dimensions and Measures pane. Refer to the following screenshot:
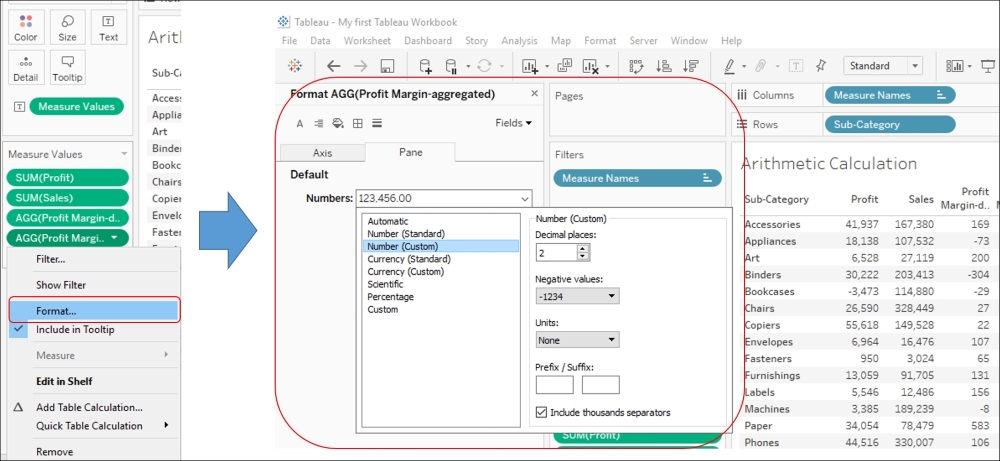
- In the Format section from the Numbers dropdown, we will select the Number (Custom) option. Our view will then update, as shown in the following screenshot:

In the Profit Margin-aggregated calculation, we are asking Tableau to first compute a SUM([Profit]) for each Sub-Category and compute SUM([Sales]) for the same Sub-Category and then divide the two, whereas, as explained earlier in the Profit Margin-disaggregated calculation, we are dividing transactional Profit by transactional Sales for every record that is contributing to a particular Sub-Category. These transactional values are then added up at the Sub-Category level.
Also, notice both the calculations in the Measure Values shelf. We will see AGG as a prefix and it stands for Aggregated. Since we are using SUM in both the calculations, it is Aggregated. By default, all the fields will be aggregated in Tableau.
The point of this whole exercise was to clarify the difference between a field, say Profit, and an aggregated field, say SUM(Profit), and how this can make or break our calculations. We need to remember that when we say just Profit, we are referring to the transactional Profit and when we say SUM(Profit), we are referring to the Aggregated Profit.
In case we wish to turn off the default aggregation properties of Tableau for a particular sheet, then we can do so by unchecking the Aggregate Measures option from Analysis in the toolbar. For more information on aggregating and disaggregating data.