
In the earlier recipes, we saw how to join data from multiple data tables that are either within a single database or across multiple databases. The cross-database join functionality was introduced by Tableau in version 10.0 and, in versions prior to this, one could rely on the Data Blending functionality to get data from multiple data sources.
Even though the cross-database Join has made joining the data from disparate data sources fairly easy, the Data Blending functionality still exists and can be used where cross-database Joins won't work. For example, cross-database functionality can't be used with Salesforce or Google Analytics or even multi-dimensional cubes. One can also use Data Blending over cross-database Joins when the data is at a different granularity.
Let us explore this functionality in more details in the following recipe.
For this recipe, we will download the sample data that has been uploaded on the following link:
https://1drv.ms/f/s!Av5QCoyLTBpnhkx2T7tGFlMQ32MR
In this recipe, we will use the two datasets called Deadliest earthquakes.xlsx and Deadliest earthquakes details.xlsx. Let's continue working in the same Tableau file.
- Click on the link to download these Excel files and let us save it in our
DocumentsMy Tableau RepositoryDatasourcesTableau Cookbook datafolder. - We will then create a new sheet in our existing Tableau workbook and rename it Data Blending.
- Click Ctrl+D to connect to data, select the Excel option, select the
Deadliest earthquakes.xlsxfile and click on the Data Blending sheet tab. - Next we will again click Ctrl+D to make a new data connection and this time, we will connect to the
Deadliest earthquakes details.xlsxfile. We will see the two new data connections in our Data window. Refer to the following screenshot:
- Next, let us click on the Deadliest earthquakes data source in the Data window to view its Dimensions and Measures. Drag the field called Date from the Deadliest earthquakes data source and drop it into the Row shelf. Next, drag the field called Location from the same data source and drop it right after the Date field in the Rows shelf. Refer to the following screenshot:

- The preceding screenshot, shows a highlighted section. If you look carefully, we will see a small blue tick mark for the Deadliest earthquakes data source. This indicates, that the current worksheet, is referring to Deadliest earthquakes as the data source.
- The Deadliest earthquakes data source, contains only the information in terms of Coordinates, Location, and Date of earthquakes. The magnitude of these earthquakes is captured in the Deadliest earthquakes details data source. Now, in order to use the Magnitude field, we will have to select the Deadliest earthquakes details data source in the Data window. When we do that, we will see two link icons, which are basically the common linking fields, highlighted in the following screenshot:

- Next, we will select the Magnitude field from the Measures pane of the Deadliest earthquakes details data source and drop it into the Columns shelf of the Data Blending worksheet that we are currently working on. Refer to the following screenshot:

- This is how we enable Data Blending in Tableau. However, as a final finishing touch, let's quickly put a magnitude filter by right-clicking on the Magnitude field and selecting the Show Filter option and only look at the earthquakes having a magnitude of 8 and above. Refer to the following screenshot:

As we saw in all the preceding three recipes, whether it is a Join or Data Blending, we will be required to use one or more common linking fields. When doing Data Blending, if the field names and the data types are exactly the same, then Tableau automatically selects these fields as the linking fields and marks them with an orange link.
Further, if we think the linking is not correct and that Tableau has just done the mapping only on the basis of the same name, then we can disable the link by clicking on it. When we disable the link, it will appear broken as shown in the following screenshot:

This disabled link can be enabled again by clicking on the gray broken link. At times, by default some fields are marked with the gray broken link icon indicating that they are potential linking fields. Further, in the Data window, the data sources that we are using will either have a blue tick mark or an orange tick mark. Refer to the following screenshot:

The blue tick mark indicates that the data source is being used as a primary data source and the orange tick mark indicates that the data source is being used as a secondary data source. Similarly, all the fields coming from the secondary data source will also have the orange tick mark to indicate that these fields are being fetched from the secondary data source. Refer to the following screenshot:

As mentioned earlier, Tableau will automatically recognize when a field from the primary data source also exists in a secondary data source and will use these fields for linking. However, this is only the case when the field names and their data types are exactly the same.
Imagine a situation where the field names aren't the same. For example, in one data source the field is referred to as Order ID and in the second data source, the same field is referred to as Transaction ID. In this case, Tableau will not define the linking fields automatically and we will have to define them ourselves. To do this, we'll have to click on the Data | Edit Relationships… in the toolbar. Refer to the following screenshot:

Once we do that, we will get the view as shown in the following screenshot:

In the preceding option box, we can define our Primary data source (ref. annotation 1). The Secondary data source can be defined in the following section (ref. annotation 2). To define the linking fields manually, we will have to enable the Custom selection (ref. annotation 3). Once we click on the Custom option and then select the Add button, we will get the view as shown in the following screenshot:
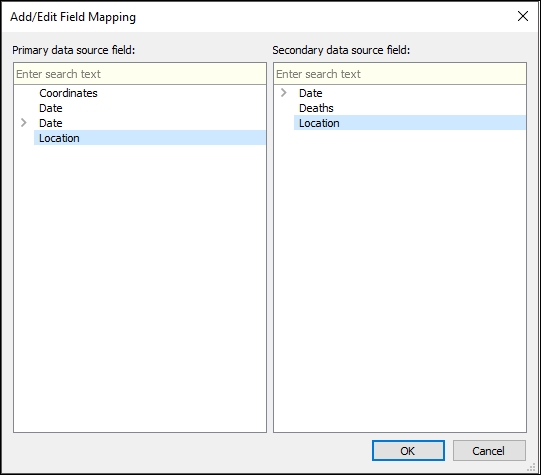
This is where we will select the linking fields manually for our Data Blending.
To know more about Data Blending, refer to the following link:
http://onlinehelp.tableau.com/current/pro/desktop/en-us/multiple_connections.html
Tip
Data Blending in Tableau supports a Left Join and thus we need to select our primary data source carefully. Further, if we are working with multidimensional data sources (cubes), then we need to remember not to use them as the secondary data source. Multidimensional data sources can only be used as the primary data source when doing a Data Blending.