
CHAPTER 17
Consumer Transactions
17.1. INTRODUCTION
A large number of companies cater directly to consumers. These companies are present in many industries, including the retail, technology, and leisure sectors. If we can understand consumer spending at these firms through alternative data, this can provide insights into the financial health of these companies on a relatively high-frequency basis. This contrasts to existing ways that rely on quarterly earnings releases published by publicly traded firms. It might also be the case that digging deeper into consumer transaction data can give us more granularity about their spending behavior than a company's earnings release, and hence it can offer more insights.
An investor might wish to compare consumer spending patterns at different firms in a particular sector. Alternatively, economists could look at consumer spending as a whole to get a better understanding of the economy at a macro level. It is extremely unlikely that any consumer transaction dataset will include every single consumer. This is also true of other datasets that are seeking to measure the consumer activity such as footfall data. Instead, they are simply a sample of the population we are examining. Hence, it is key to ensure that the panel of consumers used in such a dataset is representative of the broader population. For example, if we are seeking to measure consumer spending in the United States and our panel is largely made up of coastal cities, such as New York and Los Angeles, our dataset is unlikely to be truly representative of the United States as a whole. The panel should also be suitably balanced around demographics, such as age, gender, income, and the like. Furthermore, it is likely that a considerable amount of time needs to be spent to ensure that the panel is maintained properly over time. If the panel is not balanced, and contains particular biases, it will be difficult to extrapolate observations to the broader population.
As with many other alternative datasets, entity matching is also a key issue in the context we are discussing. In particular, it is necessary to map the company names mentioned in consumer transaction data to tradeable assets. This can be particularly challenging for many different sectors, given that several brands often come together under the same parent company that is the traded entity. In practice, these mappings can change significantly over time and hence, any mapping needs to be continually maintained. Obviously for those firms whose customers are largely other businesses, consumer transaction datasets might be less relevant.
In this chapter, we will give examples of how to use credit card data to proxy official retail sales data. Later, we will go into some detail about consumer receipts data, showing how it can be used to understand Amazon earnings and also compare the relative performance of similar firms (in this instance for headphone manufacturers Sennheiser and Shure).
17.2. CREDIT AND DEBIT CARD TRANSACTION DATA
Gerdes, Greene, and Liu (2019) discuss patterns in noncash payments in the United States. They note that in recent years card payments have increased both in number and also value, by 10.1% and 8.4% respectively. Debit card payments made up 66.9% of total card payments in 2017. However, in value terms, credit cards actually made up just over half. Generally, credit card payments were higher on average at 88 USD versus 35 USD for debit cards in 2017 in the United States.
In 2017, the number of in-person payments by card was 75.3%. When broken down by value it was only just over half, 53.7%, indicating that remote payments were typical of higher value. Remote payments include those over the phone, online, and those involving a mobile device (such as via Apple Pay).
Kumar, Maktabi, and O'Brien (2018) look at consumer transactions in the United States from a different perspective, also comprising cash. They also include electronic payments that are typically for items like mortgages. The number of payments was higher for cash in 2017, as it has always been historically. They note how cash is generally used for lower-value items. For items up to 9.99 USD, cash was used in 55% of consumer purchases in 2017. However, this proportion quickly drops for larger-value items. For purchases greater than 100 USD, cash only makes up 7% of all consumer transactions. When looking at the total value of transactions in 2017, the value of cash transactions was less than half those of credit cards and debit cards.
Both these reports suggest that card payments form a large proportion of consumer transactions. Given the increasing prevalence of card payments, it seems reasonable to use data on payments made by consumers on credit and debit cards to understand the economy. Card transactions have the benefit of being easier to track than cash transactions. We should note that, given the different nature of the way cash is used, looking at card transactions alone might neglect some lower-value items. If we are most interested in high-value transactions, this might not matter. However, if we are tracking lower-value items, say to understand sales of a confectionary company, we might not necessarily capture a representative set of transactions.
There are a number of different sources for credit and debit card transaction data. Several data products are available directly from credit card companies.1 These have usually been aggregated from transactions by their own customers. There are also firms that aggregate credit card data from many different third parties. One example of credit card transaction data is MasterCard's SpendingPulse index, which creates retail sales statistics using consumer-level credit card transaction data at a national level. The advantage of this dataset is that it is typically available with a relatively short lag compared to official data.
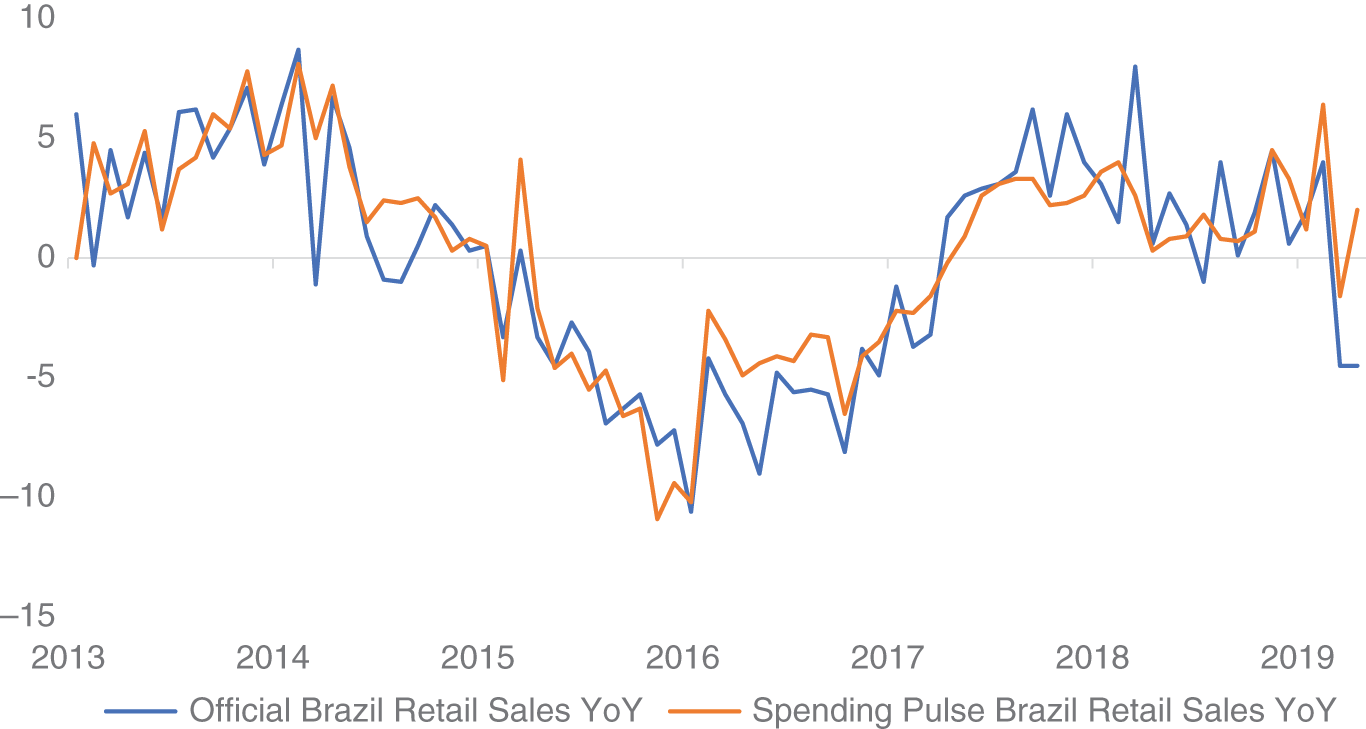
FIGURE 17.1 Brazil YoY retail sales versus SpendingPulse Brazil retail sales YoY.
Source: Based on data from Bloomberg, MasterCard.
On top of the United States, SpendingPulse also includes data on Australia, Brazil, Canada, Hong Kong, Japan, South Africa, and the United Kingdom. The dataset is also available at a more granular level, with availability for specific sectors like grocery or apparel. In Figure 17.1, we present official retail sales YoY data in Brazil, against data aggregated by SpendingPulse of credit card transactions. We can see that the SpendingPulse data is a relatively good fit for the official data, at least in the long term. We note that the official data is generally more volatile.
17.3. CONSUMER RECEIPTS
There are several different sources for e-receipts/consumer data. E-receipt data might give us a lot of granularity about purchases since these receipts often contain details of items bought. This contrasts to credit card transaction data, which will likely have only the name of the store where the purchase took place and the amount, as opposed to what was bought. Sometimes, if we want more granular information from credit card transaction data, we can try building models to infer missing fields, such as the location of the store.
In some cases, e-mail providers will have an ability to read the e-mails as part of their user service agreement. Users can opt to give third-party add-ins permission to “read” their e-mail to provide additional functionality. For example, there are accounting tools that can read through e-mail receipts of purchases to help give a summary of your expenditure. Typically, after we make an online purchase, we are sent an e-mail receipt as a confirmation.
Obviously, e-mail receipts will not necessarily capture many in-person transactions, because in most of these instances consumers are given paper receipts (although occasionally these can also be e-mail based, such as for Apple Stores). It is possible to use aggregated anonymized e-receipts to understand sales at a very low level, such as specific items, and also at a higher level for entire companies. Point-of-sale (POS) devices at cash registers can be used to record items purchased in shops. Datasets such as Nikkei POS aggregate this data. Datasets derived from POS will also be able to track cash payments.
Quandl has data on their data platform gathered from partnerships with a number of firms that have visibility of consumer e-mails to collect together a large corpus of millions of anonymized e-receipts. Thomas (2016) discusses Quandl's consumer transaction dataset with an example on how it can be used to forecast Amazon revenue. While quarterly revenue is available in 10Q filings, the idea is, of course, to see if it can be forecasted beforehand. The approach examines selecting a group of consumers who have spent at Amazon in the current quarter and the previous quarter, and then calculating the changes in spending over that period. The dataset uses data from Q2 2014–Q2 2016.
One caveat mentioned is that clearly this approach of using transaction data is only relevant for those firms whose business is largely directly to consumers, as opposed to businesses whose clients are also businesses. Hence, it is ideal for a firm like Amazon, whose revenue is heavily linked to consumer-driven purchases. In Figure 17.2, we plot the implied revenue changes according to Quandl's model. There appears to be a fit between the data points, although we should, of course, note that there is a relatively small number of points. This is an issue we often have with quarterly data, which by its nature is relatively sparse.
Clearly, consumer spending patterns are likely to be different, if we compare the period up into Christmas, versus, say, January. Hence, the Quandl model also includes other variables to help account for calendar effects and seasonality.
Admittedly, such an approach might not necessarily capture the revenue from Amazon Web Services (AWS). This is because AWS is likely to show up under business expenses, as opposed to a consumer transaction. Thomas (2016) suggests that this might explain why the line of best fit is not through the origin and suggests that incorporating other variables into the model might be helpful, such as guidance figures. Indeed, in Chapter 13, we adopted a similar approach augmenting an alternative dataset (on Chinese PMI manufacturing) with consensus estimates to increase accuracy.
The granular nature data of consumer receipts also means that the dataset can be used to understand metrics such as the cost of the average item, not purely the average amount spent by consumers. Thomas (2016) gives an example of how consumer receipt data can be used to understand the relative consumer spend on different brands. In Figure 17.3, we quote a result from the paper, comparing the month-on-month changes of different headphone brands, Sennheiser and Shure, on Amazon's marketplace. Both companies are privately traded in this instance, illustrating that this type of analysis need not be limited to public companies. In Chapter 20, we discuss how private equity investors might use alternative data to help identify company targets for investment and to assess their performance.
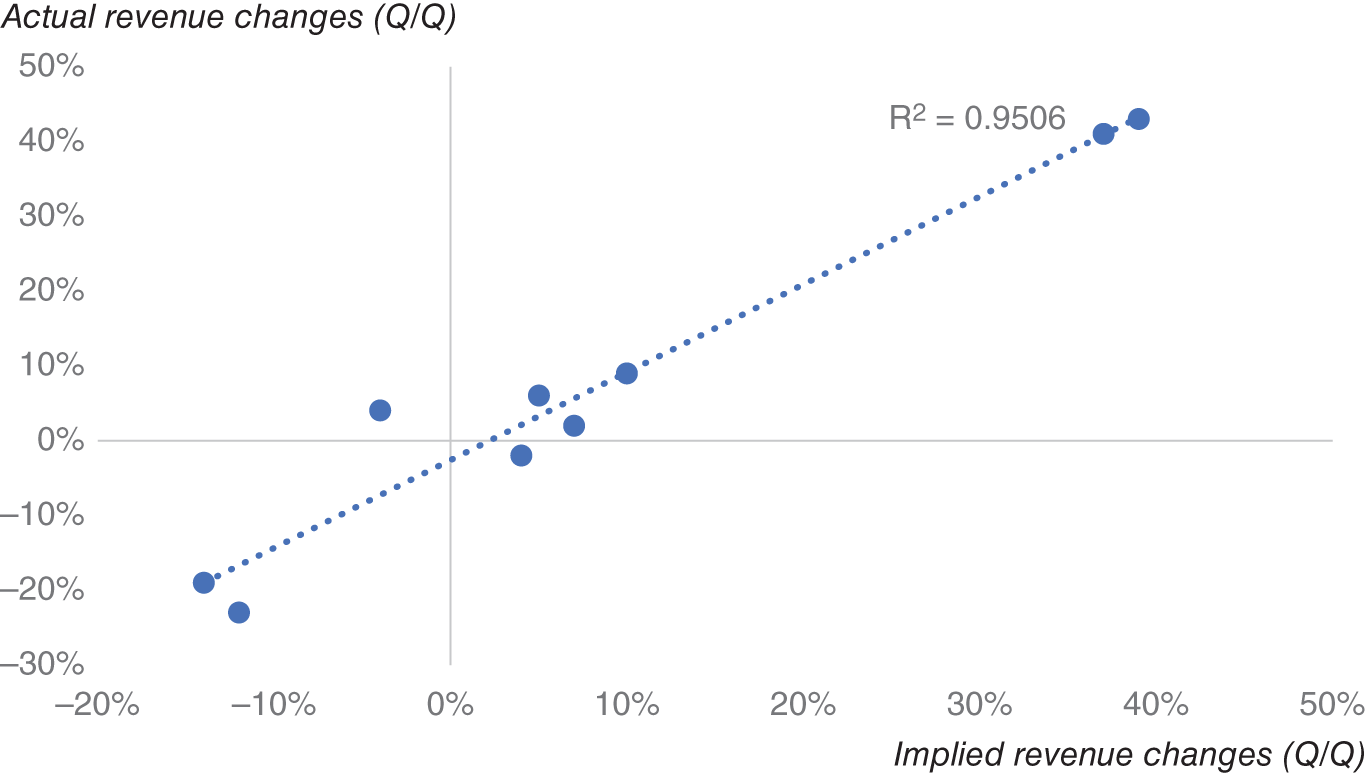
FIGURE 17.2 Alternative data forecasts for Amazon revenue versus actual revenue changes. (Q/Q)
Source: Based on data from Quandl.
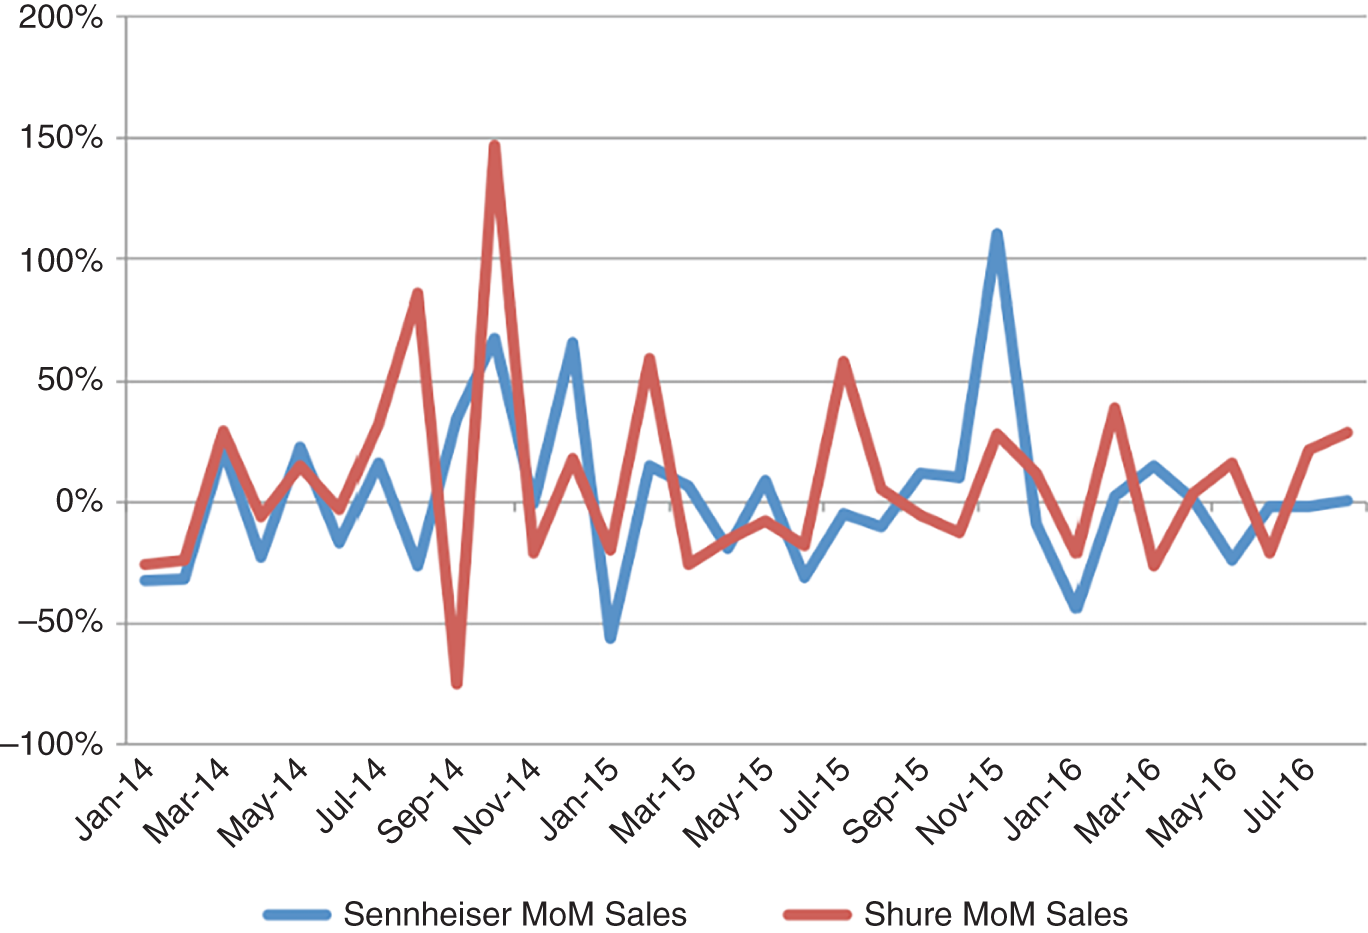
FIGURE 17.3 Comparing Shure versus Sennheiser (MoM) spend at Amazon.
Source: Based on data from Quandl.
17.4. SUMMARY
Consumer transaction data can help us understand broader retail data and also spending in individual companies on a timelier basis than official data releases. Typically, this data is available from credit and debit card transactions, which can give us a broad insight into spending patterns. We showed how data derived from MasterCard can track official Brazilian retail sales data, which tends to be released much later.
For more granular information on precisely what consumers are buying, for example, on a product level, consumer receipts are useful. These can be derived from sources such as e-mail, which will help us to track online transactions. Meanwhile, point-of-sale devices at retailers' premises can track in-person transactions. This chapter gave examples of how investors can use consumer receipt data. We showed an example using consumer receipts to estimate quarter-on-quarter revenue changes for Amazon. We also gave an example of how a dataset of consumer receipts can be used to understand consumer spending patterns on headphones for different brands.