

4
Aurora Borealis / Australis
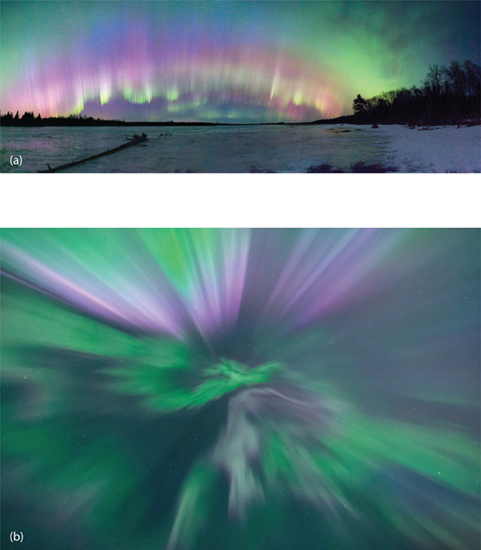
The shimmering, dancing lights of the Aurora Borealis and the Aurora Australis are certainly one of the most mystical and unforgettable phenomena of the night sky, Figure 4.1(a) and (b), respectively. The experience of witnessing cascading sheets of auroral light pouring over the dome of the sky has left many a night sky observer, including myself, speechless and in awe. Including an auroral display in a nightscape image is surely on the bucket list of most landscape astrophotographers.
Fortunately, aurorae are technically quite straightforward to photograph owing to their relative brightness compared to most of the other subjects described in this book. In many cases, even a smartphone will suffice! It can be challenging to view the aurora, however, since they are restricted to specific regions of the earth, often necessitate significant travel and occur only sporadically. It can also be tempting to over-process aurora nightscape images with results that are unnaturally over-saturated and over-contrasted. Popular locations for viewing the aurora with international air access include Fairbanks, Alaska; Yellowknife, Canada; Reykjavík, Iceland; Tromsø, Norway; and Kiruna, Sweden. Here, we will review the origins of the aurorae and the role of the earth’s magnetic field so that we may predict when and where they are likely to occur. Tips for predicting the appearance of the aurorae are given later in this chapter, and recommended settings for photographing the aurora are given in Chapter 15.
Origins of the Aurora
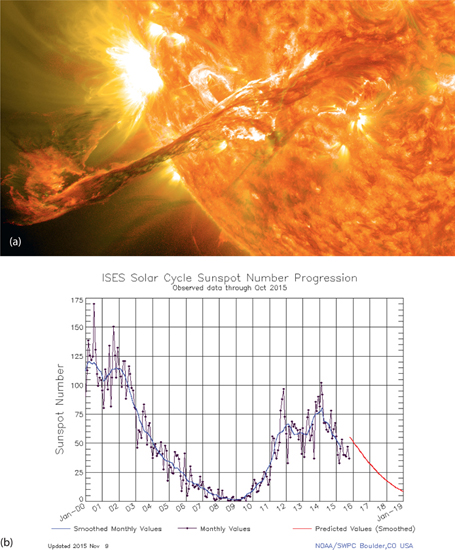
The sun is constantly hurling incomprehensible quantities of electrons, protons, and a host of other subatomic particles into space at immense speeds, Figure 4.2(a). While most of these emissions occur more or less uniformly over its surface, local disturbances, such as sunspots and flares, can cause locally concentrated outbursts of particles and energy, and a temporary increase in auroral activity on Earth.
The prevalence of notable auroral displays in a given year is thus strongly correlated with the manifestation of sunspots. In turn, the number of sunspots fluctuates in a cycle with a period of approximately eleven years, Figure 4.2(b). The most recent maximum occurred around 2013; the next maximum is expected approximately in 2024. Of course, aurorae occur even without sunspots; there is simply a higher chance of a strong display when sunspots appear.
Occasionally, the sun will “burp” and discharge a relatively large quantity of matter during an event called a coronal mass ejection (CME), Figure 4.2(a). CMEs can be responsible for spectacular displays of the aurora. This is because of their particularly high density of high-energy particles. When the massive quantities of high-energy particles ejected from a CME reach the earth, their interactions with the gases in the earth’s atmosphere are so extensive the result is called a geomagnetic storm. Another source of energy into the earth’s atmosphere are solar wind streams from open coronal holes in the sun, although they tend to be less strong than CMEs. In either case, communications and electrical power distribution systems can be adversely affected and even disrupted during a geomagnetic storm.

4.1
(a) The extraordinary Aurora Borealis display of June 22, 2015, dwarfs the setting crescent moon (lower left). This geomagnetic storm was so intense that the northern lights were visible as far south as northern Georgia in the United States. (b) The Aurora Australis near Hobart, Tasmania. The Large and Small Magellanic clouds are also visible in (b), along with the Milky Way.
Source: (b) Yuichi Takasaka/ www.blue-moon.ca /The World At Night
4.2
(a) The sun emits a wide range of subatomic particles from its surface, and especially from local disturbances such as sunspots, seen here as the bright patch in the upper left and an erupting solar filament or flare, seen across the diagonal of the photograph. This solar filament produced a coronal mass ejection on July 20, 2012, that impacted the earth and resulted in aurorae. (b) The number of sunspots that appear each year tends to follow a cycle that lasts approximately eleven years. A high number of sunspots favors higher levels of active auroral displays. The most recent maximum occurred around 2013; the next maximum should thus likely appear around 2024.
Source: NASA/NOAA/SWPC

4.3
This schematic diagram shows the relationship between the colors of the aurora and the chemical makeup of the atmospheric gases from which they originate. The heights of the atmospheric gases are also shown. Oxygen atoms in the very upper levels of the earth’s atmosphere emit a reddish light, whereas those closer to the earth’s surface, where the gas is relatively dense, produce the familiar greenish-yellow colors. Nitrogen atoms at moderately high altitudes emit a magenta color; nitrogen molecules at lower altitudes emit a more pinkish color.
Colors of the Aurora
When the particles emitted from the sun collide with the gas molecules in the earth’s upper atmosphere, they interact and cause the gas molecules to emit light. The color of the light depends on which specific gas atoms or molecules are involved: monatomic oxygen atoms, (O), monatomic nitrogen atoms, (N), diatomic nitrogen molecules, (N2), or something else, Figure 4.3.
The relationship between the colors of the aurora, the chemical makeup of the gases in the atmosphere, and their atmospheric heights is shown in Figure 4.3. Oxygen atoms in the very upper levels of the earth’s atmosphere emit a reddish light, whereas those closer to the earth’s surface, where the gas is relatively dense, produce the familiar greenish-yellow colors. Nitrogen atoms at moderately high altitudes emit a magenta color; nitrogen molecules at lower altitudes emit a more pinkish color.
Role of the Earth’s Magnetic Field
One of the signature characteristics of auroral displays is their curtain, or sheet-like appearance; auroral “pillars” are often observed, Figure 4.4(a). Although not yet completely understood, the current theories for why the incoming particles localize into such clearly defined ribbons, pillars, and bands, instead of simply bathing the sky with a uniform glow, are all based on how the particles interact with the earth’s magnetic field.
Why does the earth’s magnetic field have anything to do with auroral displays? After all, the particles arriving from the sun aren’t magnetic, or are they? In one of the most profound discoveries in physics,1 moving, electrically charged particles, such as those responsible for the aurora, have been shown to create their own magnetic field as they travel through space! Their magnetic field accompanies them as long as they are moving, but vanishes once their motion stops. Since the majority of aurora-causing particles emitted by the sun are fast moving, electrically charged electrons and protons, each one creates its own magnetic field as it travels to Earth.
When the magnetic field surrounding each moving, charged particle encounters the enormous magnetic field of the earth, the two magnetic fields interact. The result of these interactions is a channeling and shaping of the flood of incoming particles into ribbons and sheets in an as-yet incompletely understood process. The particles within the newly formed streams and sheets then interact with the gas molecules of the earth’s atmosphere to produce the familiar, flowing streams and ribbons of the auroral displays. The dimensions of these ribbons can be remarkable; they might be only a football field in width, yet hundreds of miles tall and thousands of miles in length! When viewed from directly below, their internal structure can be visualized, Figure 4.4(b).
Predicting the Aurora
The near-term likelihood of an auroral display can be predicted by monitoring the surface activity of the sun, along with measurements of the magnetic fields of the earth and the sun. Vigilant aurora watchers monitor sunspot and other solar activity closely for any signs of an impending CME or other significant solar event. If an eruption occurs, scientists and amateurs alike carefully calculate the trajectory of the outgoing stream of particles to assess whether or not it is likely to significantly interact with the earth’s magnetic field. Since aurora-causing particles have mass, they travel towards the earth at a fraction of the speed of light, and can take up to several days to arrive. In contrast, the light and heat emitted from the sun only takes a little over 8 minutes to travel from the sun to the earth. Consequently, aurora-causing geomagnetic storms can often be predicted up to several days in advance owing to the time required for CME particles to travel from the sun to the earth compared to the much shorter time required to visually detect the onset of a CME.
There are several space weather measurements constantly being made and analyzed to determine the likelihood of a near-term aurora display. Both the raw data and the results of the analyses are continuously generated from the U.S. Space Weather Center as well as the National Oceanic and Atmospheric Agency (NOAA), and are made freely available to the public in a variety of useful formats. You may wish to become familiar with how to access and interpret these rich sources of information. While none by themselves may be enough to predict a visible display with certainty, simultaneously favorable levels of two or more of the key indices can nearly guarantee a visible display.
4.4
Examples of different appearances of the aurora: (a) side view of curtains, or pillars, (b) “Bottoms-up” view of a corona.
One set of data originates from the Advanced Composition Explorer (ACE), a satellite used to help forecast the imminence of solar storms, Figure 4.5. The ACE satellite sits at one of the earth’s libation points, or a point in space where the gravitational field of the earth and the sun are approximately balanced. This balancing of the opposing gravitational fields allows the satellite to remain more or less stationary relative to the earth, which in turn allows it to continuously monitor space weather from a relatively fixed position. The ACE satellite will soon be replaced by the Deep Space Climate Observatory (DSCOVR) satellite, launched in early 2015.
The ACE satellite monitors several sun-related parameters relating to the potential for an auroral display: the intensity and shape of its magnetic field, the density of incoming low and high-energy electrons and protons, and many others, Figure 4.5(a). Clicking on any of the titles in Figure 4.5(a) brings up a set of graphs of these data, updated constantly. Data can be plotted for the preceding 2, 6, 12, or 24 hours.
Two of the most significant parameters for aurora watchers and measured by the ACE satellite are the magnitude and direction of the interplanetary magnetic field, B. This is the magnetic field largely caused by the sun that surrounds the earth but that is distinct from the earth’s own magnetic field. The most important component of the interplanetary B-field is its Bz component, also called the Bz index. The Bz index is the component parallel to the earth’s own magnetic field, which is oriented northward. When the Bz index is oriented southward, it effectively cancels the earth’s magnetic field. When this occurs, favorable conditions are created for ejected particles from the sun to be channeled into the near-Earth regions, thus increasing the likelihood of an auroral display. A southward dip in the Bz index is shown as a negative trend in the ACE Bz graph, Figure 4.5(a). Whenever a significant dip is spotted, e.g. more than −10 for observers at latitudes of approximately 45° N, be sure to be on the alert for possible aurorae! The third parameter of interest is the high-energy proton stream—when it jumps, the CME has arrived!
A second key parameter is the Kp index, or the planetary K-index, which indicates the average strength of geomagnetic activity, Figure 4.5(b). In contrast to B measurements, which are made in space, the planetary K-index is determined from magnetometers located on the earth’s surface. The K indices range from zero to nine with a higher number indicating a higher level of geomagnetic activity. The typical thresholds of the Kp index for visible overhead displays of aurorae are shown in Figure 4.5(c) for different locations around the world. Note that while Kp levels of three to five are not unusual, Kp levels of seven and higher are rare.
These measurements of the Bz, Kp, and other key parameters are continuously analyzed by NOAA and summarized in the form of a simple, color-coded, prediction for the likelihood of an auroral display in the next 24 to 36 hours, Figure 4.6(a). The University of Alaska provides another overall forecast of likely auroral visibility, Figure 4.6(b), for several Northern and Southern Hemisphere locations.
The aurora occurs within an oval shaped ring encircling the north and south poles. Depending upon the local conditions, the oval may be relatively large and wide, or small and thin. At its largest, the auroral oval may extend as far south as 35° N in the Northern Hemisphere. In the Southern Hemisphere, the oval may extend north as far as Southern Australia and Tasmania, Figure 4.1(b).
Viewing Tips and Alerts
Displays of the aurora occur every day of the year, day or night. However, most displays are insignificant and only visible at extremely high latitudes. Spectacular displays can also occur any day of the year and any time of night, although they are most commonly viewed after midnight owing to the dark skies, and around the spring and fall equinoxes. Dates around the new moon each month also result in the darkest possible skies and allow the most vivid colors to be seen at a given location. A crescent or quarter moon may cast enough light to illuminate the foreground without overexposing the sky, as discussed in the next chapter. Nights of the

4.5
A variety of continuously updated data are freely available for aurora forecasting. (a) Data from the Advanced Composition Explorer (ACE) satellite from the U.S. Space Weather Center. The various components to the magnetic field are shown, including the closely monitored Bz parameter in red. When the Bz dips, auroras are likely! (b) The latest and most recent planetary K-index, or Kp index, from the U.S. Space Weather Center. While Kp levels of three to five are not unusual, Kp levels of seven and higher are rare. (c) This diagram shows the Kp threshold needed to observe the aurora for different locations in high latitude regions of the Northern and Southern Hemispheres.
Source: NASA/NOAA/SWPC

4.6
Predictions for the intensity, size, and geographical extent of the auroral oval from (a) the U.S. Space Weather Prediction Center and (b) the University of Alaska. These predictions are available for up to several days in the future.
Source: NASA/NOAA/SWPC, www.gi.alaska.edu/auroraforecas
full or nearly full moon tend to wash out the aurora owing to the relatively bright skies. Stunning images are often captured of the aurora over a large, calm body of water that produces gorgeous reflections.
There are several free and subscription services that allow you to automatically receive alerts of impending auroral displays. These alerts can be very helpful when a display unexpectedly develops in the middle of the night and you happen to be asleep. Several online communities also exist to help alert their members to ongoing displays. For example, one very active and popular Facebook group is the Great Lakes Aurora Hunters (GLAH) group, whose over thirteen thousand members actively report and generously share up-to-the-minute information and viewing tips. These are related to ongoing and imminent auroral displays across continental North America and Alaska, Canada, and Scandinavia. Finally, there is the time honored “telephone tree” in which friends simply call one another to drag them out of bed during an active display!
Airglow/Skyglow
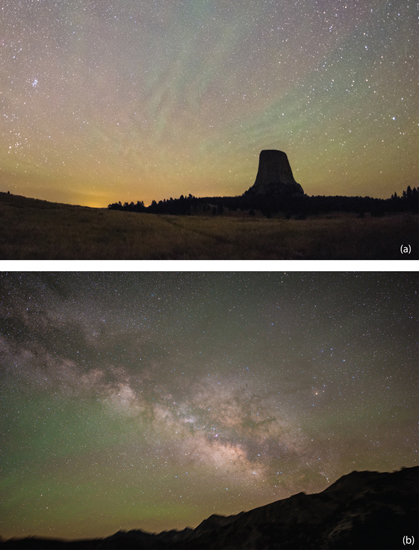
After you’ve been taking photos of the night sky long enough, you will undoubtedly notice faint patches, ripples, or even just a dim glow of greenish/reddish light in the atmosphere that in many ways appear similar to the aurora, Figure 4.7. In fact, these occasionally prominent and often-puzzling phenomena, termed airglow or skyglow, can provide enough illumination, along with the stars, to allow us to see at night, even without the moon. While airglow can be the bane of deep-sky astronomical imaging, since it can obscure the dimmest stars, it can be a colorful addition to modern nightscapes made in dark locations with cameras containing sufficiently sensitive sensors.
So what is it and where does airglow come from?
Airglow originates from the same atomic process that produces the aurora, namely, the emission of light from electronic transitions within individual oxygen atoms and compound molecules. However, the excitation mechanism is different. While aurorae are caused by impacts between atmospheric oxygen and nitrogen atoms and molecules with electrons and protons from the sun, airglow is caused primarily by the gradual recovery from the ionization of atmospheric atoms by the sun that regularly occurs during each day. Airglow can thus be seen anywhere on Earth and is completely independent of the fluctuations within the earth’s magnetic field.
Airglow is most frequently observed to exhibit either a reddish or greenish color. These colors originate from the same atomic excitation mechanism described earlier for the formation of the colors of the aurora. The reddish colors originate from both oxygen and OH (Hydroxide) molecules, while the green colors are from excited oxygen atoms. The colors can change noticeably during a single night, with reddish colors generally observed more frequently in the evening, while the greenish hues are more prevalent during the middle of the night.
Airglow originates within the very high-altitude thermosphere layer of the earth’s atmosphere. The oxygen atoms and OH molecules within this layer comprise invisible “clouds” that can be disturbed by the movement of gases within underlying layers, such as the stratosphere and troposphere, where most weather occurs. Like most fluids, the difference in densities results in the disturbances manifesting themselves as ripples and waves, akin to the formation of ripples on the surface of a calm pond after a stone is thrown in. These ripples produce the beautiful
4.7
The ghostly greenish and reddish bands and ripples of airglow, or skyglow, can be seen over Devils Tower in Wyoming (top) and the Sierra Nevada backcountry (bottom).
flowing waves that gracefully flow across the sky as seen from the earth’s surface. They can be marvelous to observe during accelerated time-lapse video sequences made over the course of several hours.
Bibliography
Dickinson, Terence & Alan Dyer, The Backyard Astronomer’s Guide, 2010, Third Edition, Firefly Books, Limited, Buffalo, New York
Knight, Randall D., Physics for Scientists and Engineers, 2013, Third Edition, Pearson, Glenview, Illinois
Schneider, Stephen E. & Thomas T. Arny, Pathways to Astronomy, 2015, Fourth Edition, McGraw Hill Education, New York
www.gi.alaska.edu/auroraforecast
www.swpc.noaa.gov/products/aurora-30-minute-forecast
www.swpc.noaa.gov/products/planetary-k-index
Note
1 Hans Christian Oersted discovered that a magnetic field is produced by an electric current by accident, during a classroom science demonstration in 1819.