CHAPTER 3
Taxation Without Representation
In 2018, NBC launched the medical drama New Amsterdam as part of its fall lineup. Its provocative tagline—“Break the Rules. Heal the System.”—captures the anger and determination of passionate clinicians working against the Healthcare Industrial Complex (the System) to meet patients’ needs.
The show originates from the book Twelve Patients: Life and Death at Bellevue Hospital by Eric Manheimer, who served as chief medical officer at the nation’s oldest public hospital. When Manheimer started as Bellevue’s CMO in 1997, he carried a notebook to record patient stories. Many of them, including his own battle with cancer, are remarkable, frustrating, inspiring, and depressing.
Manheimer’s inquiries went beyond diagnosis and treatment because he believes the larger circumstances of a patient’s life provided helpful context for what brings them to hospitals and the kinds of support they need. As Manheimer puts it,
To understand patients and where they’re coming from, you need a broader lens than just seeing them in a clinical office. You need to know more about where they’re from and what’s going on [in their lives].1
In the made-for-TV version, the hospital’s new medical director is aptly named Dr. Max Goodwin. Dr. Goodwin invests time with his patients, particularly those on life’s margins, and engages them in their care. His constant question is, “What can I do to help?” The hospital through which he maneuvers, however, obstructs him at every turn.
In true Hollywood fashion, Goodwin refuses to moderate his approach. He fights the good fight and wins more often than he loses. He eliminates waiting rooms, serves healthy food, creates a peace garden, and invests in mental health services. He implores physicians to “Be doctors again” and includes custodians in weekly staff meetings for their insights. Goodwin believes everyone who touches patients can make a difference.
At his first all-staff meeting, Goodwin fires everyone in the very profitable cardiac surgery department for (we find out later) overtreatment, poor quality scores, shifting excessive work to interns, and prioritizing billing over patient care. The cardiologist he appoints to rebuild the unit (“the right way”) warns Max that “the whole system is rigged, so you can’t just expect to come in here and help people.”
New Amsterdam is great television, but it also provides a window into the American mindset. Its storylines reflect the widely shared public belief, born of actual experiences, that US healthcare is badly broken. While the System offers medical hope, it also delivers frustration, fragmentation, and financial harm. New Amsterdam is a cannon shot announcing a customer revolution against the System.
Network TV is often guilty of presenting glib versions of real life. Sometimes, though, it gets the cultural zeitgeist just right. This chapter explores how the System interacts with consumers at the market level; how it thwarts the needs and desires of patients, caregivers, families, employers, and communities. It will catalog the economic havoc the System causes the nation as it devours ever more of the American dream. The System taxes American resources, spirit, and sense of fair play.
As doctors Manheimer and Goodwin exemplify, it takes courage, commitment, collective effort, and a customer-first mentality to deliver great healthcare to consumers consistently. Who cares who shot JR? The stakes are far higher in this real-life revolution.
Woven into the fabric of American identity is opposition to tyranny and insistence on individual liberties. Resentment is growing as the System plunders the people’s wealth, controls their care, and weakens their communities.
MARKET SIGNALS GONE HAYWIRE
For Americans, making independent purchasing decisions based on value comes as easily as breathing. Buyers and sellers execute transactions with clear prices and clear rules of exchange. Markets work best with informed customers. Consumers select from competing options while instinctively asking themselves value-specific questions: What’s the price? How good is the service or product? Who else is selling it? How much do I need it? How soon do I want it?
Countless transactions occur every second of every day. Some regulatory rules and oversight (just enough) keep the guardrails in place to ensure those transactions are fair, transparent, and fulfilled.
The beauty of markets is that they accommodate a continuous and virtuous information flow that guides and improves the terms of exchange. Through their buying decisions, consumers “signal” what they value and how much they’re willing to pay. Producers adjust to these signals and provide their goods and/or services as efficiently as possible so they can offer competitive prices and value to customers. They innovate to produce better products with features customers want. Over time, costs and prices tend to fall while quality and variety increase.
For example, my father purchased his first Hewlett-Packard calculator in 1973. It had four functions (addition, subtraction, multiplication, and division), one memory, and a $400 price tag ($2,320 in 2019 dollars). Today a solar-powered calculator has immensely more functionality at a fraction of the original $400 price.
Healthcare is different, many argue, from other businesses. Life, after all, is priceless, and healthcare consumers cannot always make optimal buying decisions. No one refuses expensive emergency care in a life-threatening situation. This argument, however, exaggerates healthcare’s uniqueness and fails to recognize that most healthcare services (even emergency care) are routine with predictable outcomes. The result is that healthcare offers commodity services at premium prices.
The business of healthcare is not immune to the universal laws governing economics and human behavior. Overemphasizing healthcare’s unique attributes leads providers to charge prices based on their production costs and negotiating leverage, not independent and transparent assessments of market value. This translates into differentiated prices for identical services. Lower-back MRIs can cost $300 or $3,000. Without market signals to guide producer behaviors, prices go haywire and consumers get burned.
PRICING DYNAMICS
In normal competitive markets, prices contain the basic information that buyers and sellers need to guide and optimize their economic decisions. Nobel Prize–winning economist Friedrich Hayek used the price of tin to illustrate the dynamic. Hayek maintained that markets and competition were the best mechanisms for calculating and coordinating economic choice. He believed that prices contain sufficient information to guide and adjust economic decisions. He stressed that decentralized planning by individuals and companies is the most effective system for allocating resources and generating wealth. To illustrate, Hayek contrasted how free-market enterprise and market socialism respond to increasing tin prices in Figure 3.1.
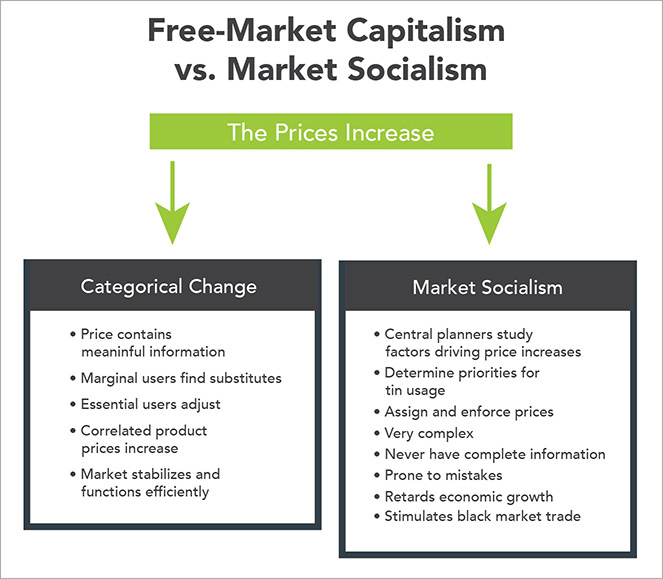
FIGURE 3.1 Centralized price setting leads to too many tin cups and not enough tin pans.
Under free-market capitalism with decentralized planning, primary and marginal users of tin “read “ the pricing information and adjust consumption accordingly. In response, manufacturers substitute materials, improve production mechanics, and/or adjust prices. The cycle repeats until the market stabilizes.
In contrast, market socialism with centralized planning requires complex protocols to determine why the price of tin increased, establishes priorities for its use, assigns prices, and enforces market acceptance. Before long, complexity overwhelms managerial capabilities and it’s easy to make mistakes, such as producing too many tin cups and not enough tin pans. Managed economies create imbalances in supply and demand, impede economic growth, and stimulate black-market trading of goods and services.
American healthcare is a mix of centralized (top-down) and decentralized (bottom-up) payment mechanics. As discussed in Chapter 2, centralized fee-for-service payment dominates. However, there also is a bottom-up payment component supplied by consumers through co-pays and deductibles.
While only a small (but increasing) percentage of total health expenditure, consumer payment obligations disproportionately influence healthcare utilization. Once plan subscribers fulfill their deductible obligation, for example, they have little incentive to restrain their consumption and often pursue unnecessary care with the active support of financially incentivized providers.
Alternatively, many consumers with high-deductible health plans (HDHPs) forgo necessary care because they cannot afford to make the up-front deductible payments. Deductible limits in HDHPs usually exceed $5,000. Forgoing necessary care accelerates disease progression and often leads to preventable and very expensive acute treatments.
Could there be a less effective way to guide consumers to the appropriate care at the right time? It gets worse. The System’s payment dysfunction leads to absurd pricing for healthcare products and services.
ABSURD PRICES
Two customers buying identical vacuum cleaners at Best Buy and Target will pay the same approximate prices. However, two people lined up at the same pharmacy or visiting the same surgical center often pay very different amounts for the identical drug, treatment, procedure, or test depending on their health insurance and where they’re receiving or picking up the prescribed treatment.
There are a million stories of unexpectedly high healthcare prices. Most confound reason. Vox Media spent a year collecting true accounts of emergency department bills that bore no relation to reality.2
Let’s revisit and dig deeper into Janet Winston’s “Allergy Test Is a Lot of Scratch” story from the introduction to Chapter 2. In 2018, Janet Winston, a 56-year old professor living in northern California, sought treatment for a rash. She assumed her symptoms were allergy related, so she tried to make an appointment with her local dermatologist. The earliest availability, however, was months away. So Winston turned to Stanford Healthcare instead. Though a six-hour drive away, Stanford was in-network for Janet’s insurer. Even so, Janet’s bill for her allergy testing and doctor consultation was a mind-blowing $48,329. She owed 20 percent of that cost, almost $10,000.
What could Winston have done differently to avoid this unexpected bill? Very little, other than forgoing care. She knew the testing would be “expensive” but was unaware of its actual cost and had no reason to anticipate such an astronomical amount. A single skin-patch test typically costs as little as $35. In Winston’s itemized bill from Stanford, each test cost $399. Her consult, in which a doctor explained her test results, cost a whopping $848. While appreciating the quality of her care and clarity of her diagnosis, Winston found the exorbitant treatment costs prohibitive and unjustifiable. She couldn’t believe the System had squeezed her so ruthlessly.
Recall that Stanford was in-network for Winston. Her reasonable expectation was that this special relationship would protect her from extravagant billing. It did not. Winston’s insurer, Anthem Blue Cross, likely included Stanford in network because of its market presence and strong brand. Indeed, studies have shown that Stanford, like most well-positioned health systems, negotiates higher payment rates than competing institutions. This is monopoly pricing power in action. It drives up health insurance premiums and hits consumers in their pocketbooks.
That $48,329 charged to Winston’s insurer was not the end of the story. Anthem Blue Cross pushed back and negotiated a lower payment with Stanford for Winston’s treatment. Stanford agreed to a substantially lower payment of $11,376.47. Although this was a relief to Winston, it still put her on the hook for $3,103.73. After even more negotiations, Winston agreed to pay Stanford $1,561.86 for her portion of the bill.3
Though frustrating and bewildering, Winston’s billing experience inside the System is common. “Buyer beware” is the operating mentality when revenue optimization is the end goal. Hospitals catalog their list prices for all services, procedures, drugs, and diagnostic tests—which often have no correlation to underlying costs—on a centralized “chargemaster.” Winston undoubtedly received Stanford’s full chargemaster rates for her treatments. Clearly, Stanford had a lot of wiggle room to reduce its charges for Winston’s treatment.
Hospitals rarely receive their chargemaster rates because they negotiate procedure-specific payments directly with commercial health insurance companies. These commercial rates vary dramatically by insurer and usually exceed Medicare payment rates by a wide margin. In this way, commercial insurance premiums subsidize provider operations. As we shall see later, the level of that subsidy has increased substantially in the last 20 years. Differential pricing enables hospitals to shift costs, offsetting lower governmental payments by charging insurance companies and individuals more for identical treatments.
The chargemaster rate is somewhat similar to a car’s list price, except the markups are multiples higher. Buying a car from a dealer can require skillful negotiation. With some wheeling and dealing, the list price can go down. Once that new deal is struck, however, it’s not the end of the haggling. Instead, a new set of negotiations begins. The dealer offers a variety of options (features, financing rates, etc.) that put the price back into flux. By the time the dealership’s finance department calculates monthly payments, even savvy car buyers may not know whether they are getting a good deal or not.
At least car buyers and dealers start with a transparent list price. Health systems don’t. They believe their chargemaster prices offer competitive advantage, so they keep them secret. A 2018 regulatory pronouncement by the Centers for Medicare and Medicaid Services (CMS) may change this behavior. Beyond negotiated payments, payers inflate treatment bills by performing additional procedures, employing out-of-network professions, and doing unnecessary diagnostic tests.4 The bottom line is that consumers have little or no clue how much healthcare treatments cost and what their share of the payment will be.
As Janet Winston experienced, this mind-numbing game of revenue cycle roulette is time consuming, emotionally draining, and devoid of logic. When disputes occur, each side on the payer-provider divide marshals armies of technocrats to settle medical claims. Consumers too often end up in the middle even as their bills are sent to collection agencies. If you have spent hours on the phone going back and forth between a collections agency, a hospital claims department, and an insurance bureaucrat to sort a disputed claim, then you are part of an unpaid involuntary army of frustrated consumers sucked into the System’s vortex.
HEALTHCARE’S UNAFFORDABILITY
In November 2017, Dr. Ezekiel Emanuel, Aaron Glickman, and I published an article in the Journal of the American Medical Association (JAMA) that introduced the Healthcare Affordability Index (the Index). JAMA included editorial critiques from respected economists Ewe Reinhardt of Princeton and Joseph Antos of the American Enterprise Institute. Our article was widely read and heavily commented upon.
For decades, when Americans thought about healthcare, they worried primarily about access to necessary care services. According to a 2018 Gallup survey, 23 percent of Americans now cite care affordability as their biggest fear. More than 25 percent of people put off getting care because of financial concerns. More than 60 percent of people think that rising prescription drug prices should be a top national priority.5
The Healthcare Affordability Index is a simple and powerful metric for assessing the impact of rising healthcare costs on American living standards (Figure 3.2). The Index measures the relationship between the total cost (employer and employee portions) of a commercial family health insurance policy relative to median household income (MHI).

FIGURE 3.2 The Healthcare Affordability Index provides a straightforward metric for tracking the relative healthcare costs for average families over time.
Since 1999, the Kaiser Family Foundation has published an annual survey of employer health benefits.6 Employer-sponsored health insurance covers approximately 152 million nonelderly Americans, largely through private commercial health insurance plans. The average cost of a family health insurance policy in 2018 was $19,616.
The Census Bureau has tracked nominal and real median household incomes since 1984. It is a widely used measure of middle-class incomes. On an inflation-adjusted basis, median US household incomes peaked in 1999 and have stagnated since. Median US household income in 2017, the latest year reported, was $61,372. A Sentier Research report found US median household income to be a record $62,175 in June 2018.7
Measuring the numerical relationship between these credible, widely available metrics creates a framework for assessing the financial burden imposed by health insurance on middle-income families. Figure 3.3 measures healthcare affordability between 1999 and 2018 through the Healthcare Affordability Index.
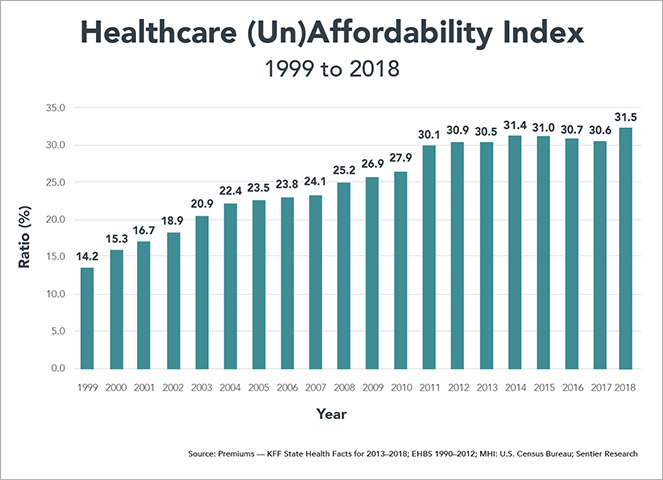
FIGURE 3.3 The cost of employer-sponsored healthcare as a percent of household income has more than doubled since 1999.
The Index more than doubled between 1999 and 2018, from 14.2 percent to 31.5 percent. Our belief is that increasing health insurance costs have contributed to stagnant income growth for workers as employer-paid health insurance premiums have become a greater percentage of employees’ total compensation.
Interestingly, the Index plateaued at roughly 30 percent from 2011 to 2017. This may indicate that health insurance costs are approaching a natural ceiling relative to family incomes. Consistent with this conclusion, the calls for restraining healthcare cost growth have magnified during this period. This is a disturbing trend.
The academic reaction to the Index largely focused on defining affordability and income. Some suggested our formula was misleading because it did not include employer health insurance contributions as a component of family income. Adding employer-paid health insurance premiums to income lowers the Index score modestly but does not change its upward trajectory during the 1999–2018 measurement period.
While these criticisms have validity, they miss the more important trend relationship over time between health insurance costs and middle-class incomes. Defining affordability and income creates a smokescreen. It distracts from the unassailable conclusion that health insurance has consumed an ever-greater percentage of family resources during the last 20 years.
Importantly, the Index reveals this obvious but hidden truth: the very high cost of private health insurance contributes significantly to middle-class wage stagnation. More than half of Americans depend on employer-sponsored health insurance for their healthcare.
An Unbearable Burden
As healthcare costs rise, health insurance premiums also rise. This requires both employers and employees to pay more for healthcare coverage. Between 1999 and 2018, the cost of a family health insurance policy has more than tripled from $5,791 to $19,616. These are alarming figures.
The United States boasts the world’s most productive workforce. High worker productivity creates wealth and sustains high living standards. The United States outspends all countries on healthcare services. Logic suggests that generous health spending enhances national productivity, competitiveness, and wealth creation. The opposite is true. American’s health status is lower than that in other developed economies. While all Americans bear the burden of increasing health insurance premiums, that burden falls disproportionately on lower-income communities and families who suffer stagnant wages and increasing health disparity.
Historically, there has been a tight correlation between improving productivity and median household income. This is wealth creation in action. The benefits of higher productivity flowed directly to American workers in the form of higher wages. This historic pattern changed for the worse as America entered the new millennium.
Despite increasing productivity, wages for American workers have stagnated since 2000 on an inflation-adjusted basis (see Figure 3.4). There are multiple reasons for this depressing reality. These include two major recessions and increasing competition from a lower-cost globalizing workforce. Healthcare’s rising costs, however, are an underappreciated component of the wage stagnation afflicting US workers. Increasing health insurance premiums reduce monies available for wage increases.
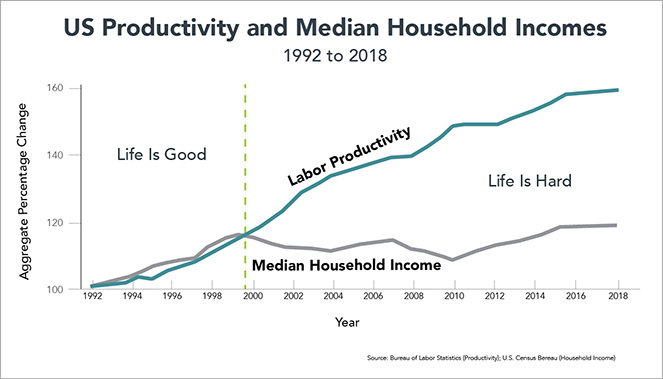
FIGURE 3.4 While US productivity has continued to rise, median household income has been stagnant. Workers aren’t seeing the benefits of their increased productivity.
Rising health insurance premiums act like a tax on worker incomes. Unfortunately, the System has become more dependent on this “tax” to fund its profligacy. Employer-sponsored health insurance subsidizes America’s inefficient and exceptionally high-cost healthcare delivery system. As Figure 3.5 illustrates, commercial health insurance premiums have risen more than three times the rate of inflation (as measured by the Consumer Price Index) and almost double the rate of medical inflation.
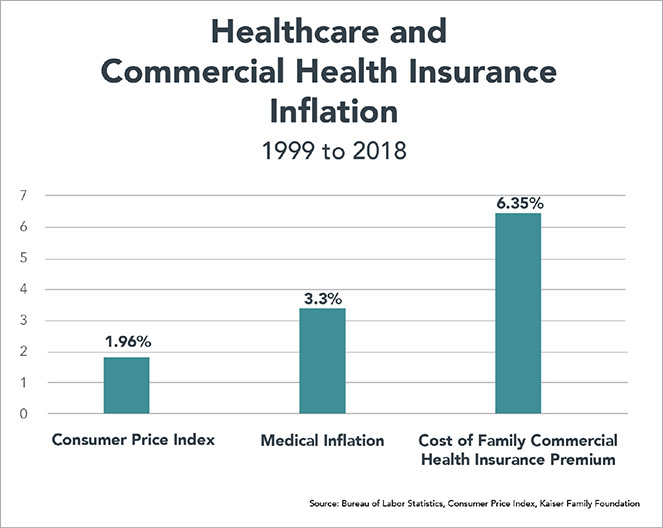
FIGURE 3.5 The System is more dependent than ever on subsidies from commercial insurers.
High-cost healthcare could not exist in America without very high-cost private health insurance. Importantly, the US healthcare system has become increasingly dependent upon high-cost commercial premiums to fund increasing healthcare expenditures. My biggest disappointment with US healthcare is that employers haven’t demanded more value for their healthcare purchases.
Educating Americans on the direct connection between healthcare expenditures and the all-in costs of health insurance is a national priority.
The Index is an effective tool for making this connection understandable. Here are several salient observations regarding the Healthcare Affordability Index:
• Increasing health insurance costs exert a substantial and depressing influence on wage growth. Health insurance premiums increased 4.5 times faster (239 percent vs. 53 percent) than workers’ earnings between 1999 and 2018.
• All other things being equal, a constant 14.2 percent Index would translate into a 2018 median household income of $72,943, which is a meaningful $10,768 (17.3 percent) increase over the current level of $62,175.
• Adding deductibles and co-pays increases the cost of health care coverage for Americans beyond the Index. This is particularly true for the increasing numbers of Americans with high-deductible health plans.
Consumers Disconnected from Rising Healthcare Costs
Americans understand that healthcare is expensive, but they generally do not recognize the direct connection between health insurance premiums, healthcare costs, and incomes. The following factors contribute to this perception failure that discourages optimal consumer purchasing behaviors:
• Employers and governments cover the lion’s share of health insurance costs. This benefit insulates consumers from actual healthcare expenditures.
• Consumers experience the healthcare marketplace through the purchase and use of health insurance products. Their relevant measures are not healthcare costs, but rather the costs of insuring against adverse health expenditure (employee health insurance premiums, deductibles, and co-pays).
• Employees focus on income, while employers focus on total compensation. Consequently, workers underappreciate the negative impact rising healthcare and health insurance costs exert on their take-home pay.
Increasing healthcare and related employer-sponsored health insurance costs exert a double whammy on wages. Workers pay more for health insurance, decreasing out-of-pocket spending. Meanwhile, escalating health insurance costs limit employers’ ability to increase wages. The net result: workers pay more for health insurance and receive lower pay.
It gets worse. While total employer health insurance is heavily subsidized, combined spending for average employee premiums and potential spending for deductibles has increased dramatically—from 7.8 percent in 2007 to 11.7 percent in 2017.8 Heathcare’s burden on middle-class families grows ever larger.
STATE-SPECIFIC HEALTHCARE AFFORDABILITY
The state-specific Healthcare Affordability Index scores vary dramatically, from a low of 22.9 in Utah to a high of 44.6 in West Virginia. The heat map in Figure 3.6 displays the Index in thirds: high, average, and low. The darker the color, the higher the Index and the greater the ratio of health insurance costs to family incomes.

FIGURE 3.6 The variance in healthcare affordability does not just follow the median household income.
As described above, the Index measures the percentage relationship between total family health insurance premiums and median household income (MHI). Of the two components, there is far greater variation in MHI than in health insurance premiums. Washington, D.C.’s MHI of $83,382 is almost double Mississippi’s MHI of $43,441. The high variation among states in median household income gives MHI greater weight in explaining state-specific Index scores. MHI explains roughly 80 percent of an individual state’s ranking.
By contrast, the differential between the highest and lowest health insurance policies is only 37 percent. At $16,350, Utah’s premiums are the lowest. At $22,417, Alaska’s premiums are the highest. With significantly lower variation, total insurance premiums have less influence than MHI in calculating state-specific Index scores.
Here’s the rub. The lower a state’s median household income, the higher the burden of paying for commercial health insurance. Figure 3.7 depicts the tight correlation between a state’s MHI and its Affordability Index.

FIGURE 3.7 The poor get poorer: the lower a state’s median household income, the higher the burden of paying for commercial health insurance.
As depicted above, the Affordability Index correlates inversely with median household income. States with higher Index scores have lower MHI and vice versa. Figures 3.8 and 3.9 identify the 10 states with the most and least affordable Index scores.
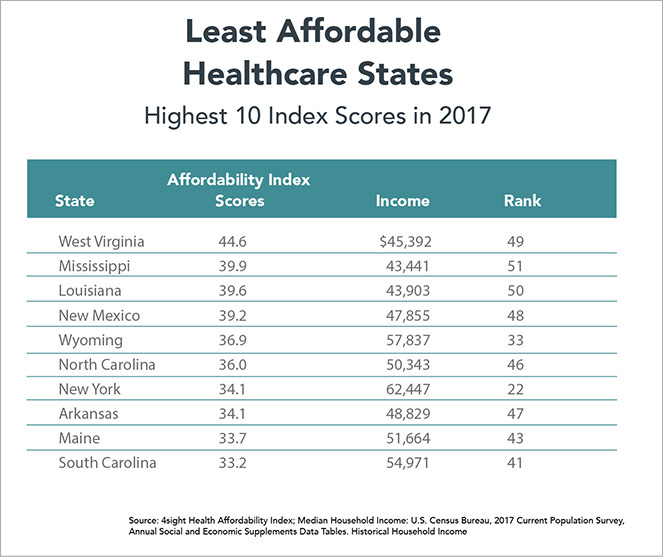
FIGURE 3.8 Health insurance is least affordable in low-income states.
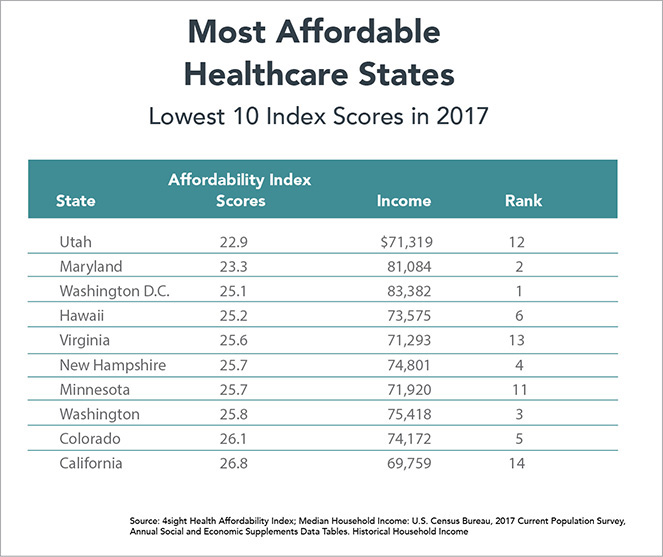
FIGURE 3.9 Higher-income states have more affordable health insurance.
The two outlier states are New York and Wyoming. Ranked twenty-second with $62,447 in MHI, New York achieves the seventh least affordable Index score (34.1) because its residents pay very high health insurance premiums, $21,317 for an average family policy. This premium level ranks third nationally. At $21,355, Wyoming residents pay even more for health insurance than New Yorkers. This propels Wyoming to the fifth least affordable Index score.
The 10 states with the most affordable Index scores come from the group of 14 states with the highest median household incomes. Relative rankings within this group result from the cost of health insurance policies within each state. States ranked 11–14 in MHI (Minnesota, Utah, Virginia, and California) generated more affordable Index scores because family health insurance in these states costs less than $18,750.
States that ranked 7–10 in median household income (Massachusetts, New Jersey, Connecticut, and Alaska) did not qualify among the 10 best because health insurance in these states is expensive. Family health insurance policies in these states cost more than $20,000.
Interestingly, the size of a state’s population and economy (as measured by state gross domestic product) had no correlation with Index scores. Scale doesn’t matter. Health insurance is less affordable in the states with the second, third, and fourth largest populations and economies (Florida, New York, and Texas). By contrast, health insurance is more affordable in several small states (Hawaii, Idaho, New Hampshire, Rhode Island) and Washington, DC. With the exception of the Southeast, geography does not seem to predict the Index scores. A high percentage of low-income states with below-average Index scores concentrate in the Southeast.
Crueler Still: “Premium” Employee Premiums in Some Low-Income States
There also is remarkable state-specific variation in the percentage of the total health insurance premium paid by employees. Wisconsin is the lowest at 15.1 percent. Louisiana is the highest at 34.4 percent, more than twice the Wisconsin level.
Many low-income states with below-average Index scores, notably Florida, Louisiana, North Carolina, and Oklahoma, also require their workers to pay higher employee health insurance premiums. This is a form of double jeopardy:
1. Lower-income workers have less affordable healthcare as measured by the Affordability Index; and
2. These workers also must cover a higher percentage of their total health insurance costs from wages.
It’s no wonder that high costs now represent Americans’ greatest healthcare concern. It used to be access to high-quality healthcare services.
The West Virginia Anomaly
The most intriguing state is West Virginia. At $45,392, West Virginia has the nation’s third-lowest median household income. Only Mississippi and Louisiana are lower. Somewhat surprisingly, West Virginia has the nation’s seventh-highest cost, $20,252, for family health insurance. The result is a staggering Healthcare Affordability Index score of 44.6, almost five points higher than the next highest score (Mississippi at 39.6).
Here’s where it gets really interesting. Despite operating in a low-income state, West Virginia’s employers pay more for health insurance ($16,494) than employers in any other state. As a result, West Virginia employees contribute the second-lowest percentage (18.6 percent). Only Wisconsin is lower at 15.1 percent.
It’s a good thing that West Virginia’s employers pay generously for health insurance benefits. The state has the highest percentage of people with preexisting medical conditions.9 At the same time, West Virginia’s high healthcare costs relative to other low-income states inhibit its ability to attract new employers to the state.
There is a powerful understory to these West Virginia figures. A multiyear investigation by National Public Radio and Frontline released in December 2018 reveals that coal mining companies and government regulators did not act upon well-established evidence linking silica dust with black lung disease.10 As a result, thousands of coal miners contracted the preventable deadly disease. Scott Laney, an epidemiologist at the National Institute for Occupational Safety and Health, describes the human dimensions of the tragedy:
It’s an epidemic and clearly one of the worst industrial medicine disasters that’s ever been described. We’re counting thousands and thousands of black lung cases. Thousands of cases of the most severe form of black lung. And we’re not done counting yet.
Former mine safety regulator Celeste Monforton reviewed the investigation’s findings and offered these sobering comments:
We failed. Had we taken action at that time [in the 1990s], I really believe that we would not be seeing the disease we’re seeing now. Having miners die at such young ages from exposures that happened 20 years ago . . . I mean this is such a gross and frank example of regulatory failure.
Inadequate safety practices by mining companies combined with pro-business (as opposed to pro-market) regulatory policies and lax enforcement have caused unnecessary disease and death in Appalachian communities. These communities also bear the high treatment and social service costs related to the disease. As with the American-made opioid crisis, “iron triangle” behaviors have fostered needless despair, diminished human potential, and increased economic hardship.
Healthcare emerged as the top issue in West Virginia’s hotly contested 2018 Senate race between incumbent Democrat Joe Manchin and Republican Attorney General Patrick Morrisey. President Trump was very popular in West Virginia, carrying the state by 42 percent in the 2016 election. The president campaigned vigorously for Morrisey, but his magic didn’t work. Voters concerned about healthcare voted overwhelmingly for Manchin and carried him to victory.11
OUTLIERS AND CONSEQUENCES
The Healthcare Affordability Index illuminates the relationship between commercial health insurance costs and median household incomes. In the United States, high-cost health insurance funds a very high-cost healthcare delivery system. Despite the high healthcare expenditure, the United States ranks only twenty-sixth in life expectancy at birth among higher-income countries.12 Healthcare spending doesn’t buy longevity.
As with Index scores, there is remarkable variation between individual states in life expectancy. Hawaiians live the longest lives at 81.3 years, while people in Mississippi live the shortest lives at 75.0 years. This creates a sizable life-expectancy gap of 6.3 years.13 Interestingly, there is correlation among individual states between life expectancy and Index scores. People in states where the Index scores are more affordable live longer and vice versa. People in Hawaii and Minnesota live the longest and have among the most affordable Index scores. People in Mississippi, Alabama, and West Virginia experience the opposite.
Correlation is not causation. Poverty is the primary cause of life expectancy differences, and very poor people do not purchase commercial health insurance policies. Still, higher state-specific “burden” in funding commercial health insurance corresponds with shorter lifespans. Here is the dismal reality. America makes it harder for workers in low-income states to fund health insurance, and therefore lowers health status results. The poor get poorer, and the sick get sicker.
In good and bad ways, the United States is an “exceptional” nation. Overpaying for healthcare while tolerating subpar health outcomes and health status exacts an enormous tax on the nation and its people. This unbearable burden grows heavier each year.
Healthcare costs are strangling middle-class incomes. “We the People” fund America’s bloated healthcare system, and its costs fall disproportionately on low- and middle-income Americans through wage stagnation and declining health status. This negative cost shift deprives American workers of vitally needed income.
Funding America’s highly expensive, inefficient, and often ineffective healthcare delivery system through high-cost private health insurance plans has consequences. It weakens the American economy. It reduces the global competitiveness of US companies. It robs workers of higher wages and lowers living standards. It also siphons investment from more productive industries. Remarkably, the overall US economy achieves high productivity despite the System’s underperformance and exceptionally high costs. That cannot last forever.
IT’S A DRAG
Healthcare is not only an economic concern for individuals and families, it’s consuming an ever-larger share of the federal budget as well as exerting a negative drag on the overall economy.
In his insightful book After the Music Stopped, about the financial crisis and its aftermath, noted Princeton economist Alan S. Blinder examines the 2012 Congressional Budget Office’s (CBO) long-term forecast and concludes controlling healthcare spending is the US government’s central fiscal challenge. The forecast projects 75 years into the future, through 2087. This isn’t really a forecast but an extrapolation of current spending patterns.
During this time period, interest payments to service the national debt soar. Revenues at current tax rates are woefully insufficient to cover government spending on defense, healthcare, social security, and all other noninterest expenditures. The government terms this primary spending. As a result, the increasing primary-spending deficit, in combination with increasing interest payments, pushes the overall national debt ever upward to almost 80 percent of GNP from 20 percent today. Even more terrifying, increasing healthcare expenditure fundamentally redistributes primary spending in the following two ways:
1. Primary spending rises to greater than 30 percent of GNP, fueled by increasing healthcare expenditure.
2. All non-healthcare primary spending (defense, social security, and everything else) declines to just over 10 percent of GNP. By the end of the forecast period, healthcare is double the cost of all other government activities combined.
Blinder concludes his analysis with this providential warning:
The implication for budgeteers is clear: If we can somehow solve the health care cost problem, we will also solve the long-run deficit problem. But if we can’t control health care costs, the long-run deficit problem is insoluble. Simple, right? Impossible? We’d better hope not.14
Blinder’s analysis focuses only on the federal government’s healthcare expenditures. Private employers, individuals, and state governments confront the same runaway healthcare costs. Published in February 2018, CMS’s 2017–2026 national health-expenditure forecast projects that overall health spending will be $5.7 trillion and consume almost 20 percent of national GNP (versus $3 trillion and almost 18 percent of GNP today).15 How bad can it get? If you believe these forecasts, it could get really, really, really bad.
The global economy is experiencing unprecedented redistribution between developed and developing nations. As chronicled by the World Bank, global GNP more than doubled from $32.2 trillion in 2001 to $80.7 trillion in 2017. US GNP grew 83 percent during this same period, but the American share of global GNP shrank from 32 to 24 percent (Figure 3.10).
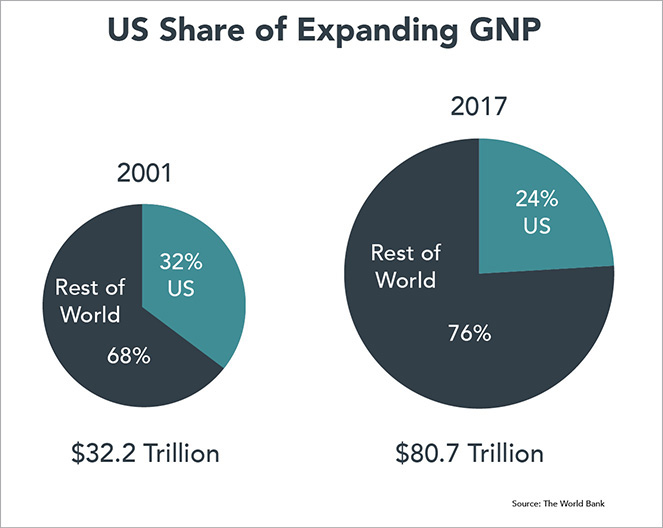
FIGURE 3.10 The United States is becoming a smaller percentage of a much larger, interconnected global economy.
This economic repositioning occurred within a short 16-year period. With roughly 4.5 percent of the world’s population, it’s logical that the US percentage of the global economy will shrink as developing economies, particularly China and India, advance. An expanding global economy is good news. New markets for American products create new jobs in export-oriented industries, but achieving competitive advantage in a “flat world” is hard. The United States no longer has the luxury of being so wealthy that it can absorb the cost of underperforming industries and inefficient government programs.
To maintain our living standard, the United States must excel within a much larger, more efficient global economy. Coming to terms with this new economic reality will force Americans to rethink tax policy, infrastructure investment, defense spending, social welfare benefits, education, and, of course, healthcare.
A more efficient, globalizing economy presents two profound challenges for the US healthcare system. First, healthcare must become more competitive. It needs to cost less while delivering comparable or superior treatment outcomes. To the extent the US healthcare system is less productive than healthcare systems in other countries, it exerts a negative drag on the overall US economy. Secondly, America’s obesity and chronic-disease epidemics diminish labor force productivity. In a globalizing economy, the United States requires a healthier, fitter workforce to advance national living standards.
Our ability to gain control over healthcare spending and direct it to achieve better health outcomes will shape the nation’s future prosperity. The nation’s future economic health depends upon slower healthcare expenditure growth and improving health status. That’s not happening now.
FOR PETE’S SAKE
It’s not just about the money. In healthcare, it never is. Healthcare’s purpose should be to deliver kinder, smarter, affordable care for all Americans.
In mid-October 2017, I toured a pediatric transitional care facility. For almost 20 years, this facility has provided transitional care services in homelike settings for children and their families as patients move from ICU/hospital care to home-based care.
Suffering from complex medical conditions, the facility’s patients require ongoing care to live their best lives possible. Stays often extend for several months as children stabilize and family members learn how to provide home-based care. The facility also provides respite services for families needing a break from 24/7 caregiving responsibilities.
During the tour, I met a feisty, big-cheeked one-year-old with a magnetic personality named Pete (not his real name) who was wearing what looked like an old-fashioned leather football helmet. Pete suffered from multiple chronic conditions and was on a ventilator. I asked why Pete was wearing the helmet. The answer was devastating.
A low birth weight baby, Pete spent his early months in a neonatal intensive care unit (NICU) to gain weight before going home. Unfortunately, Pete experienced limited human interaction during his time in the NICU. As a result, he lay on his back those several months before being transferred into transitional care. All that time on his back deformed Pete’s head. The helmet was working to reshape his head to normal proportions. Unfortunately, Pete’s limited human contact in infancy will likely cause severe developmental challenges.
Joseph Stalin, the Soviet Union’s brutal dictator, understood the calculus of sympathy. He said, “When one man dies, it’s a tragedy. When thousands die, it’s a statistic.” At the height of the Syrian refugee crisis, the photo of Aylan Kurdi, a young boy washed up dead on a beach, had a greater impact on fund-raising for Syrian refugees than hundreds of thousands of deaths.16 Likewise, the story of someone like Pete can touch the heartstrings in the way that statistics fail to do. Nevertheless, the aggregated statistics regarding children with complex medical conditions portray immense tragedy.
There are hundreds of thousands of children nationwide who could benefit from transitional care services. Why don’t they get access to such care? It’s not the cost. A patient day costs less than $1,000, including all services and therapies. NICUs can cost $10,000 per day and even more for infants on ventilators.
The horrific truth is that many NICU children receive inferior but high-cost care because neonatal and pediatric intensive care services are lucrative for hospitals. They have no financial incentive to explore better, lower-cost treatment alternatives. Once again, the System prioritizes revenues over outcomes. Kids like Pete suffer unnecessary physical and emotional harm from high-cost institutionalized care.
Like Pete, there are countless others who suffer under the System’s care. Impoverished diabetics become amputees because it’s more profitable to cut off a foot than manage their diabetes. Stressed-out mothers struggle to arrange care for their children in the face of an indifferent bureaucracy. Families have less money for college or vacations or monthly bills because healthcare consumes an increasing percentage of their disposable income. Millions could live healthier, longer, more productive lives if only they received better primary care before life-changing health problems arise.
The System has acted against the interests of the American people for decades. Reasonable attempts at reform have failed. The System’s powerful incumbents maintain their privileged positions through regulatory manipulation, legislative fiat, and anti-competitive market behaviors.
The System taxes the American public without delivering commensurate value. It threatens national productivity, prosperity, and quality of life. The status quo cannot stand. Descendants of revolutionaries, Americans are not afraid to confront the System’s tyranny. Stakes are high. Solutions are complex. Once unleashed, the customer revolution in healthcare will not cease until it delivers the healthcare the American people want, need, and deserve.