The need to process big data real-time streams is becoming an increasing need for many businesses. Customers in numerous industries are seeking to harness the power of real-time big data to unlock valuable insights. They are seeking an easy-to-use, flexible, reliable, and scalable solution to process and transform streams of real-time data for their IoT projects. Additionally, along with these big real-time data streams come anomalies in the data. Customers in a variety of industries are interested in the concept of real-time anomaly detection using machine learning algorithms and operators.
Azure Stream Analytics is an event-processing engine that allows examining high volumes of data streaming from devices, sensors, websites, social media feeds, applications, etc. It is easy to use and based on simple SQL. Additionally, it is a fully managed (PaaS) offering on Azure that can run large-scale analytics jobs that are optimized for cost since users only pay for streaming units that are consumed.
Azure Stream Analytics now offers built-in machine learning–based anomaly detection capabilities to monitor temporary and persistent anomalies. This anomaly detection capability coupled with Power BI’s real-time streaming service makes for a powerful real-time anomaly detection service. In this chapter, I will demonstrate a practical example of how to create real-time anomaly detection using Azure Stream Analytics for processing the stream and Power BI for visualizing the data.
Prerequisites
To begin implementing the example solution for this chapter, you will need to create and run a few Azure resources. These are
Stream Analytics job: Azure Stream Analytics is a real-time analytics and complex event-processing engine that is designed to analyze and process high volumes of fast-streaming data from multiple sources simultaneously.
IoT Hub: IoT Hub is a managed service, hosted in the cloud, that acts as a central message hub for bidirectional communication between your IoT application and the devices it manages.
Power BI service: For small and medium businesses, Power BI Pro is optimal to deliver full business intelligence capabilities to all users. Power BI Premium is best for large enterprise organizations who need a large number of people across the business to be able use Power BI to view dashboards and reports. Please revisit Chapter 1, where I discuss the pros and cons of Power BI Pro vs. Premium at the end of the chapter. For the purposes of this exercise, Power BI Premium will be used.
Device Simulator: The Device Simulator app, which is a Visual Studio project that can be downloaded from the following GitHub location ( https://github.com/Azure/azure-stream-analytics/tree/master/Samples/DeviceSimulator), is used to simulate anomalies being sent from a device to IoT Hub. Once you download and open this Device Simulator Visual Studio project, you will be able to run it to see the Device Simulator UI, which can be configured to pass events from the simulator to the IoT Hub that you’ll create in Azure. The schema of the simulator’s data uses temperature and a sensor ID. These events can then be consumed by an Azure Stream Analytics job that is configured to read from this IoT Hub.
The following sections walk you through creating these prerequisites.
Create an Azure Stream Analytics Job
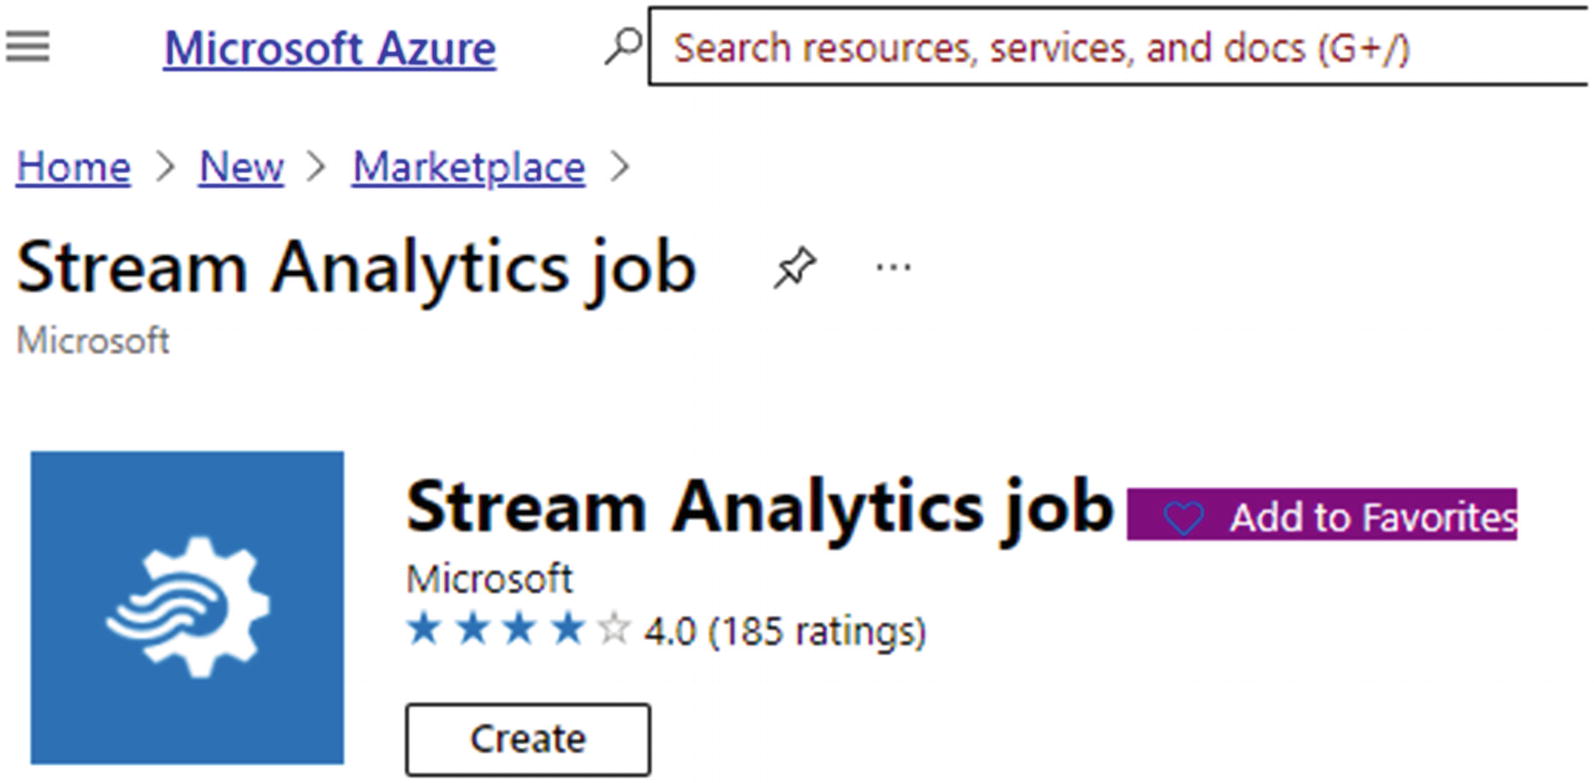
Let’s begin by creating a new Stream Analytics job in Azure Portal by simply searching for Stream Analytics, as shown in Figure 16-1.
Figure 16-1
New Stream Analytics job in Azure Portal
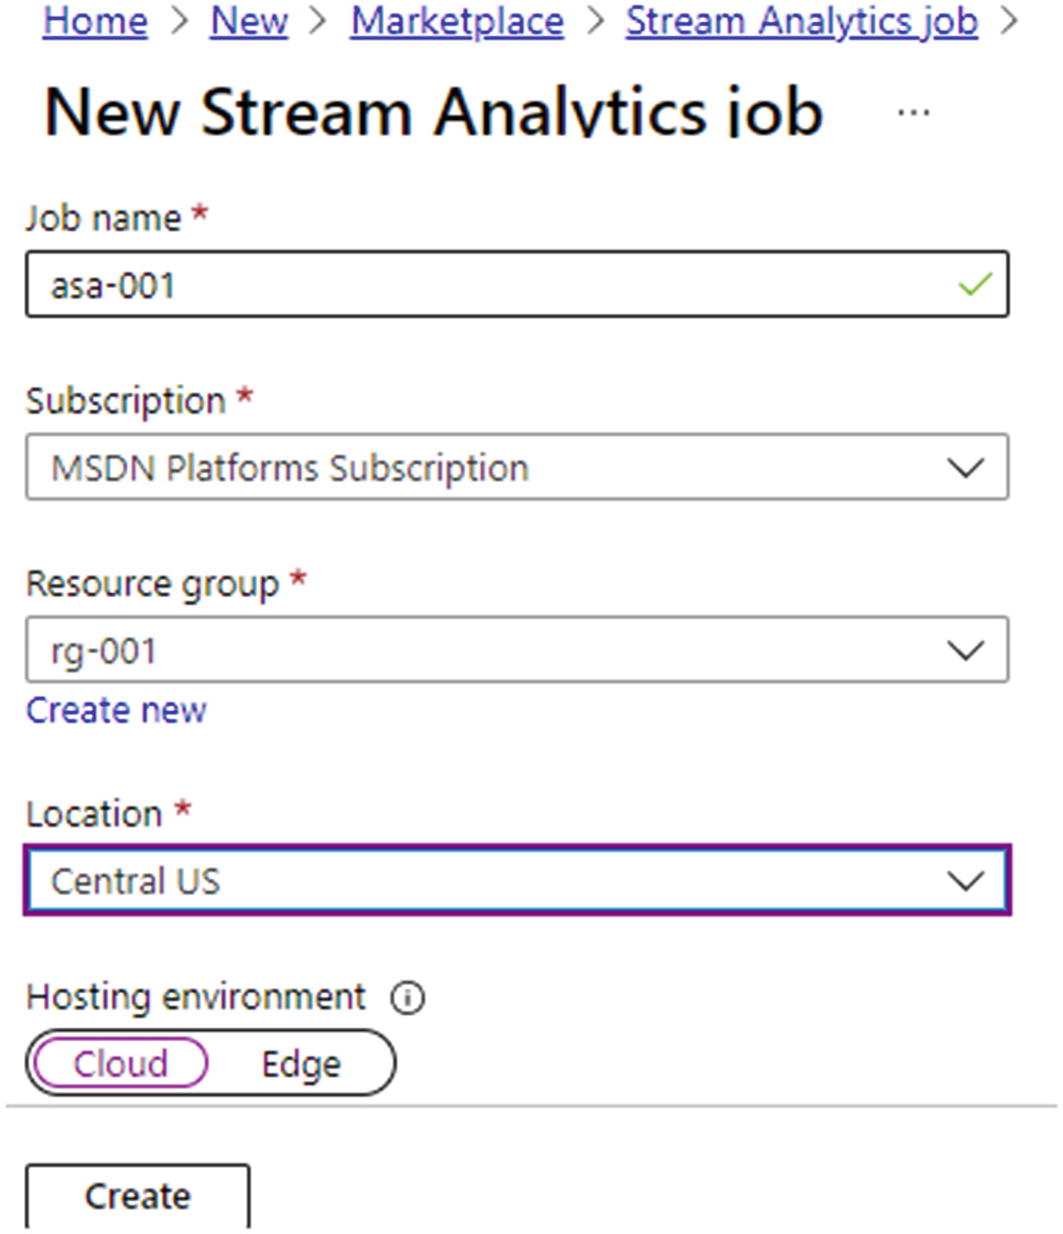
Figure 16-2 illustrates that you will need to name the job as asa-001. Also, select the respective subscription, resource group, and location. I would recommend creating all of your resources for this project in a single resource group. That said, you could create a new resource group for this Stream Analytics job. Additionally, try to create all of your resources within the same location as much as possible to reduce data and network latency, especially since this is a real-time streaming solution. For this exercise, select “Cloud” for deploying the job to the Azure cloud and since this is the typical selection. Select “Edge” to deploy the job to an on-premises IoT Gateway Edge device. After the selections have been made, click Create.
Figure 16-2
New Stream Analytics job details
You have now created a Stream Analytics job. You will also need to create an IoT Hub, which will be used to bridge the gap between the Device Simulator and the Stream Analytics job.
Create an IoT Hub
IoT Hub is a managed service that is hosted in the cloud and acts as a central message hub for bidirectional communication between IoT applications and the devices they manage. An IoT Hub is essentially an Event Hub with additional features including per-device identity, cloud to device messaging, and several additional features. In Chapter 1, I have discussed the similarities and differences between IoT and Event Hubs in greater detail. Figure 16-3 shows how to create the IoT Hub from Azure Portal.
Figure 16-3
Create an Azure Portal IoT Hub
In the Basics tab shown in Figure 16-4, give your IoT Hub a name and ensure that the subscription, resource group, and region are configured correctly. Recall from the previous section that it would be best to have the IoT Hub reside in the same resource group and region as the Stream Analytics job.
Figure 16-4
IoT Hub Basics tab
There is also an option to size and scale the IoT Hub, as shown in Figure 16-5. For this exercise, use the free tier since this is best suited for testing scenarios. The standard tier of IoT Hub enables all features and is required for any IoT solutions that want to make use of the bidirectional communication capabilities. The basic tier enables a subset of the features and is intended for IoT solutions that only need unidirectional communication from devices to the cloud. Both tiers offer the same security and authentication features. Read Microsoft’s documentation on when and how to choose the right tier based on capability needs (https://docs.microsoft.com/en-us/azure/iot-hub/iot-hub-scaling).
Figure 16-5
IoT Hub Management tab
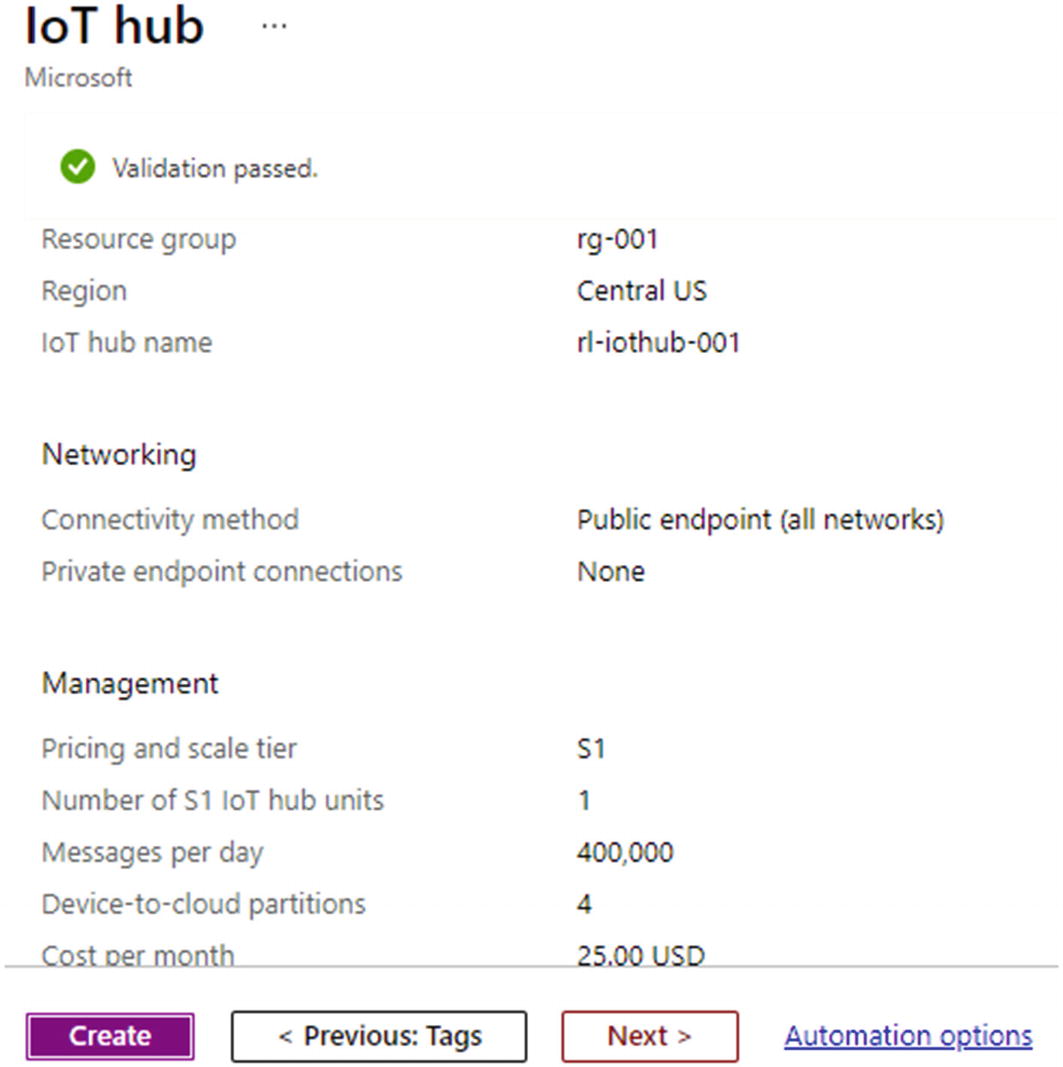
After selecting the desired tier, review the selections shown in Figure 16-6 and then click Create to deploy the IoT resource.
Figure 16-6
IoT Hub Review + create
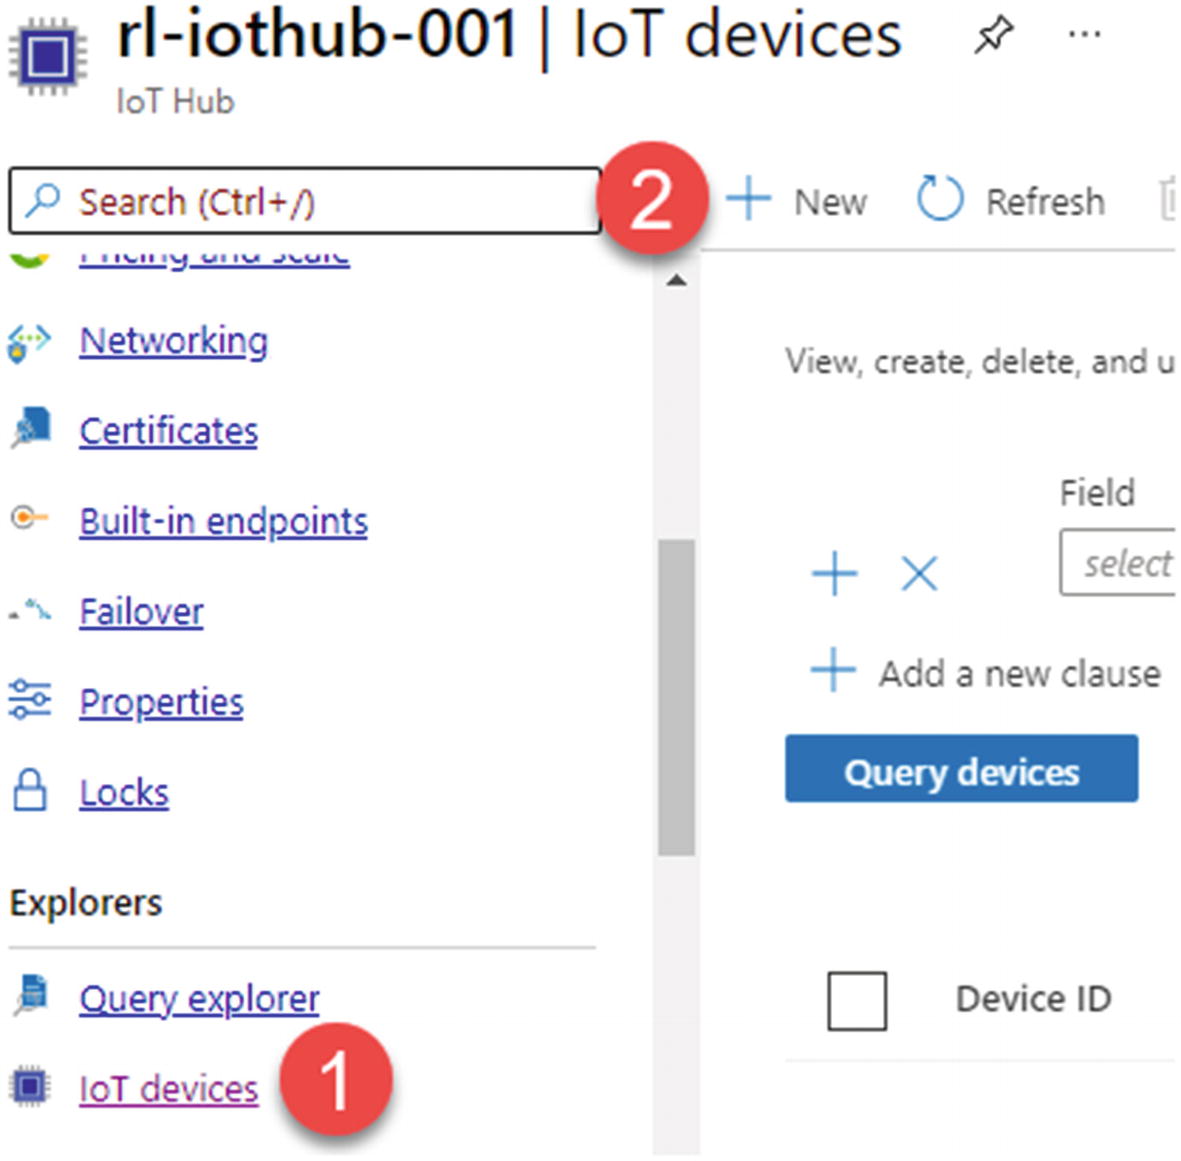
Once the IoT Hub resource is deployed, navigate to IoT devices under Explorers shown in Figure 16-7, and then click New from under the IoT Hub navigation menu to add a new device that we can then use to configure the Device Simulator, which will send simulated events to this IoT device.
Figure 16-7
IoT Hub IoT devices
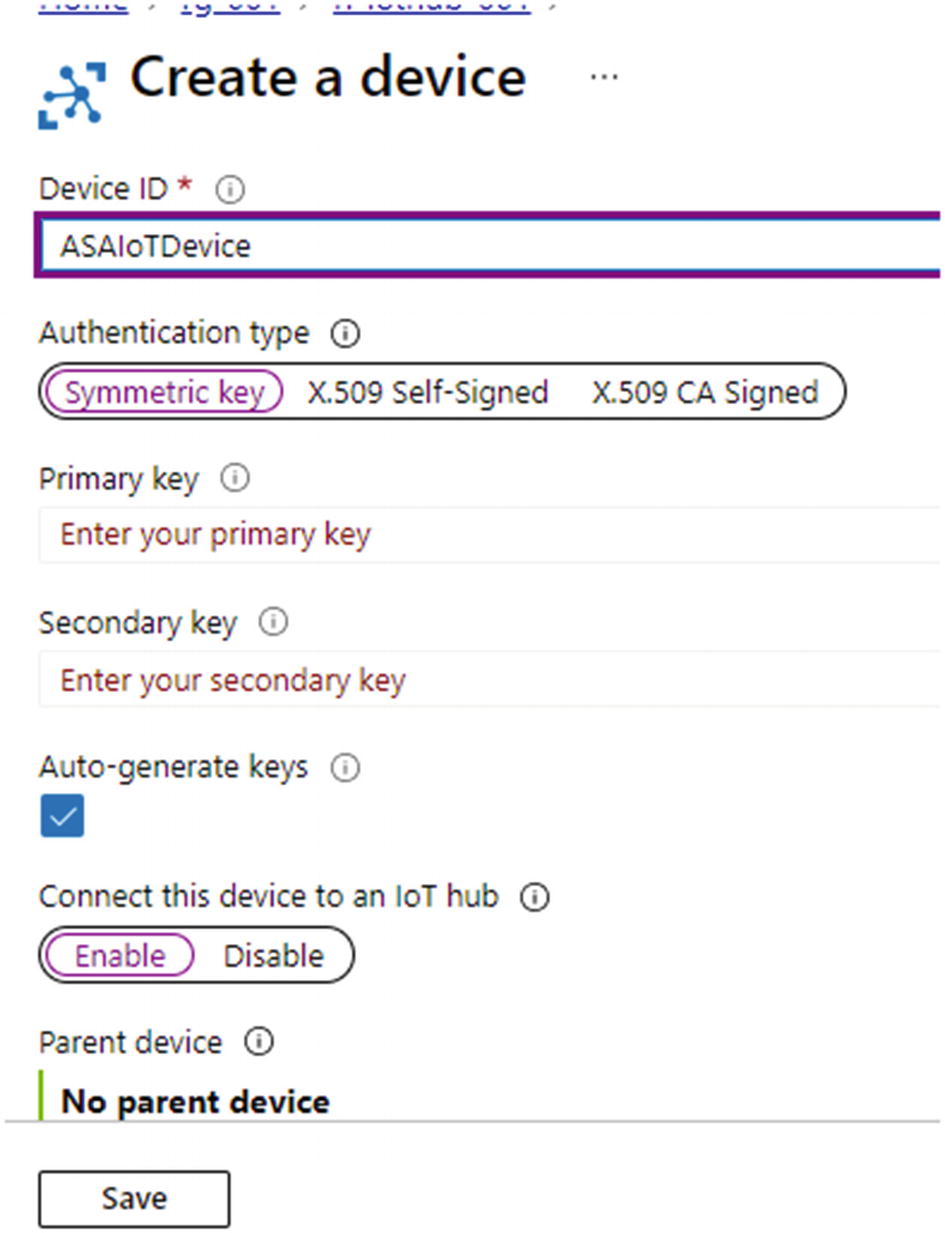
Then add a Device ID and click Save, as shown in Figure 16-8. The Device ID is simply an identity for the device, which is used for device authentication and access control. Symmetric keys must be in valid base-64 format with a key length between 16 and 64 bytes. You can use any X.509 certificate to authenticate a device with IoT Hub by uploading either a certificate thumbprint or a certificate authority (CA) to Azure IoT Hub. Authentication using certificate thumbprints verifies that the presented thumbprint matches the configured thumbprint. Select “Auto-generate keys” to auto-generate symmetric keys for this device. Finally, enable the device interaction with the IoT Hub.
Figure 16-8
Create an IoT Hub device
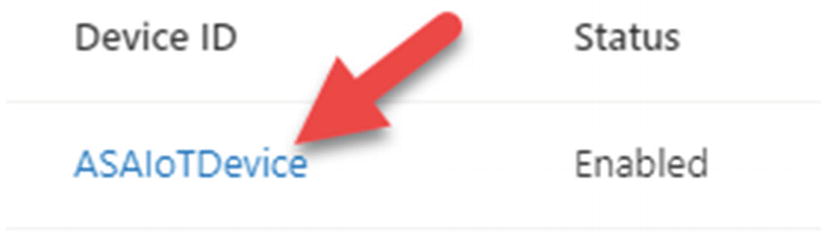
Once the device is added, it will show a status of “Enabled,” as shown in Figure 16-9. Click the device to open the device details including keys, identities, and additional configurations.
Figure 16-9
ASA device status and ID
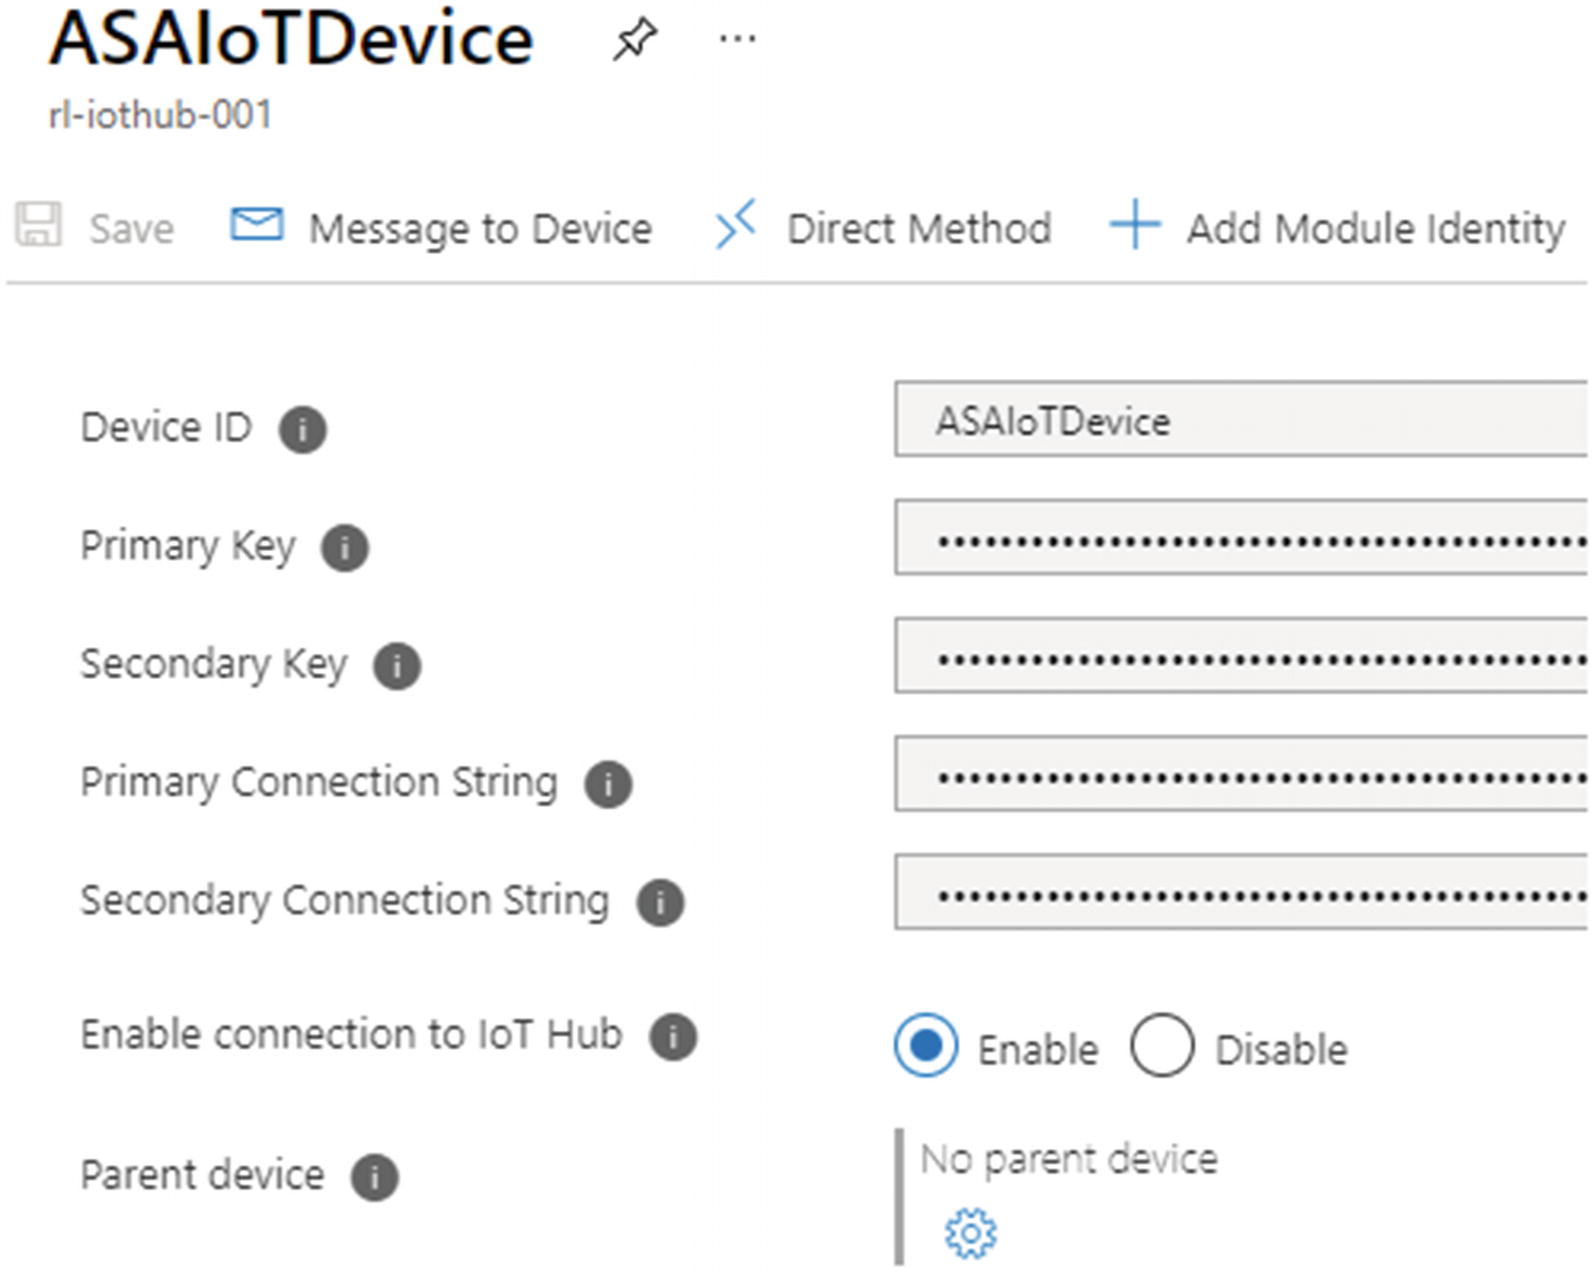
Next, copy the connection string for the primary key shown in Figure 16-10, which will be used as the connection for the IoT device.
Figure 16-10
Connection details for the ASA IoT device
Create a Power BI Service
To get started with Power BI, download the free desktop version from the following URL: https://powerbi.microsoft.com/en-us/downloads/. When considering a production-ready Power BI service, explore the Pro and Premium options. In Chapter 1, I have briefly compared both Pro and Premium. Pro has a $9.99/user license, and Premium has a $20/user license. For the purposes of this exercise, Power BI Premium has been used. Please review the various options and choose what is best for you and your organization.
Download the Device Simulator
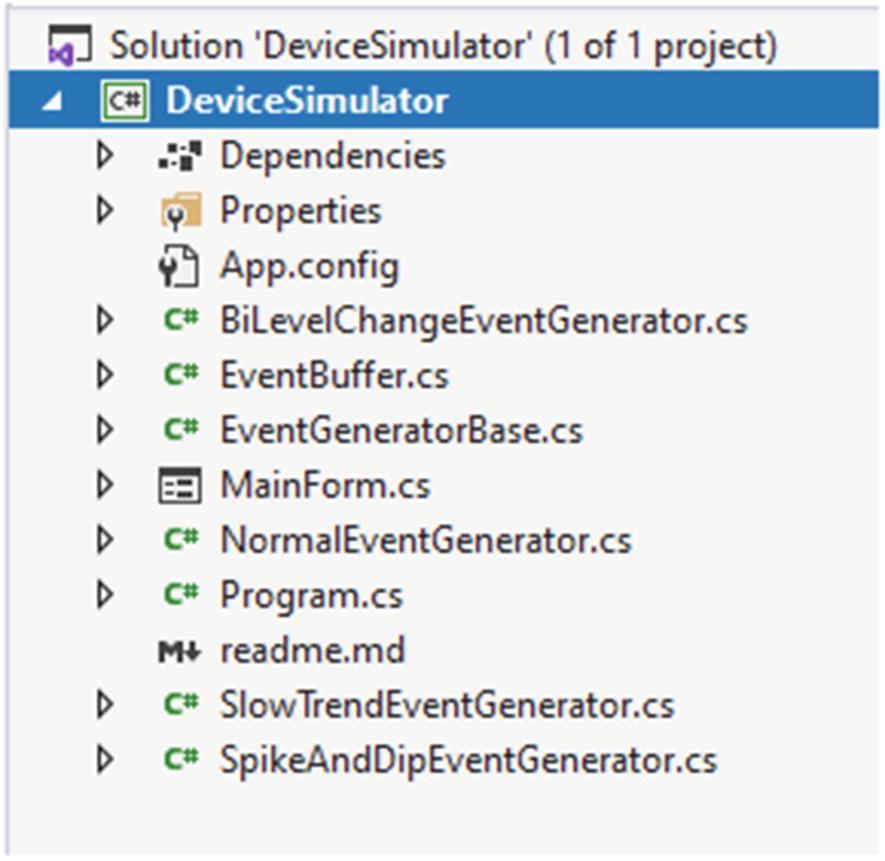
The Device Simulator is used to simulate anomalies being sent from a device to IoT Hub. The schema uses temperature and a sensor ID. These events can then be consumed by an Azure Stream Analytics job configured to read from this IoT Hub. Download the Device Simulator from the following URL (https://github.com/Azure/azure-stream-analytics/tree/master/Samples/DeviceSimulator) and then open the corresponding Visual Studio solution file and run the simulator. The Device Simulator solution file should look similar to Figure 16-11 when it is opened.
Figure 16-11
VS view of the Device Simulator project
When the Device Simulator begins running, notice the various settings available. Be sure to review the readme.md GitHub file to understand the various configurations and settings that are available. For example, Mock Mode is a method of experimenting with the simulator and various anomaly patterns without sending data to a live IoT Hub.
Once you have the available IoT Hub Namespace (e.g., rl-iothub-001), Device ID (ASAIoTDevice), and Device Key (Primary Key), enter it in the IoT Hub config section, as shown in Figure 16-12, prior to running the simulator to ensure messages and data are sent to the IoT device.
Figure 16-12
Device SimulatorDevice Simulator
Create a Stream Analytics Input and Output
A Stream Analytics job consists of an input, a query, and an output. It will need to be defined and run in order to take the IoT Hub device input, process it using the query, and output it to a Power BI real-time streaming dashboard.
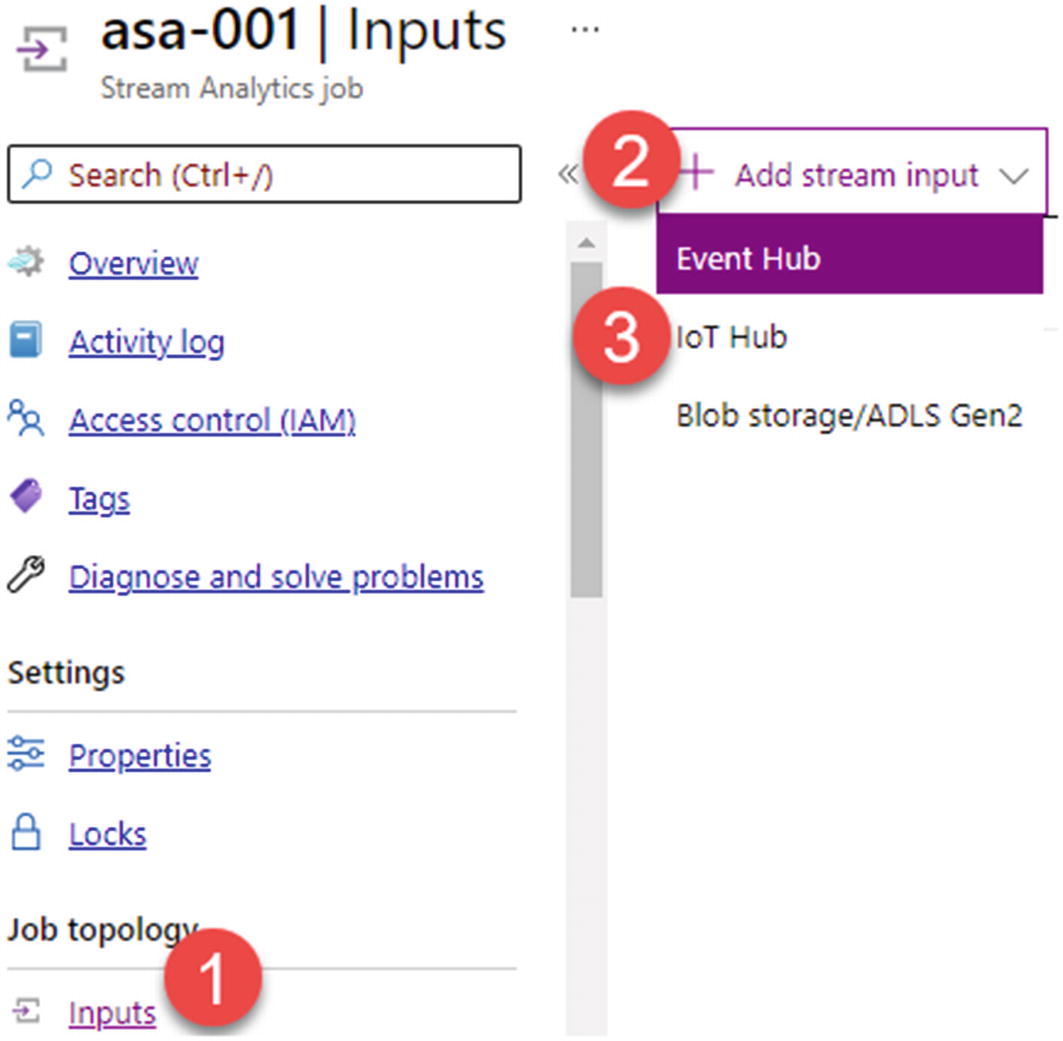
Add Stream Input
Your first step is to capture the input. Begin by adding an IoT Hub stream input as shown in Figure 16-13. Notice that there are additional options to use Event Hub, Blob Storage, and ADLS Gen2 – they are stream inputs as well.
Figure 16-13
Adding an IoT Hub stream input
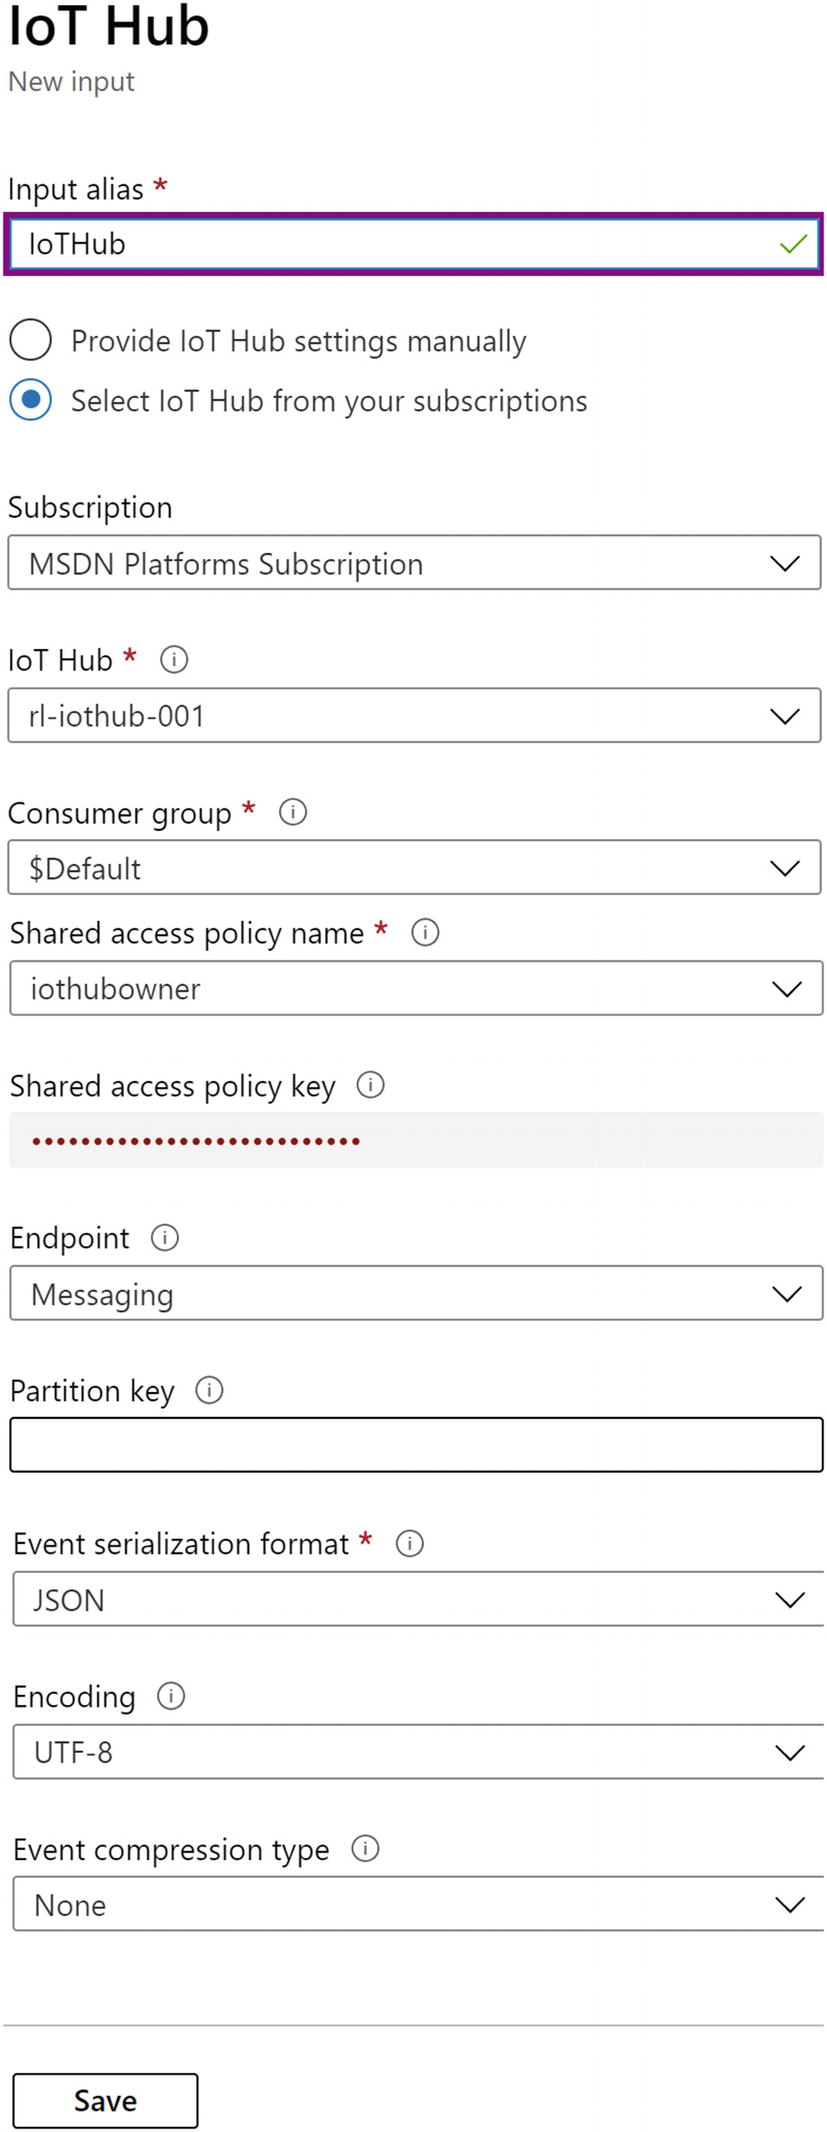
Next, Figure 16-14 shows you how to configure the input stream details. Here are some additional details for the advanced configuration options:
Consumer group: IoT Hubs limit the number of readers within one consumer group to five. Microsoft recommends using a separate group for each job. Leaving this field empty will use the ‘$Default’ consumer group.
Shared access policy name: When you create an IoT Hub, you can also create shared access policies in the IoT Hub settings. Each shared access policy will have a name, permissions that you set, and access keys.
Shared access policy key: When you create an IoT Hub, you can also create shared access policies in the IoT Hub settings. Each shared access policy will have a name, permissions that you set, and access keys.
Endpoint: Use “Messaging” endpoint for messages from devices to the cloud. Use “Operations Monitoring” endpoint for device telemetry and metadata.
Partition key: If your input is partitioned by a property, you can add the name of this property here. This is optional and is used for improving the performance of your query if it includes a PARTITION BY or GROUP BY clause on this property. If this job uses compatibility level 1.2 or higher, “PartitionId” is added by default, so you do not need to explicitly add it here.
Event serialization format: To make sure your queries work the way you expect, Stream Analytics needs to know which serialization format you’re using for incoming data streams.
Encoding: UTF-8 is the only supported encoding format at this time.
Event compression type: The compression option enables you to specify a compression type of Gzip, Deflate, or no compression.
Figure 16-14
Configure the input stream details
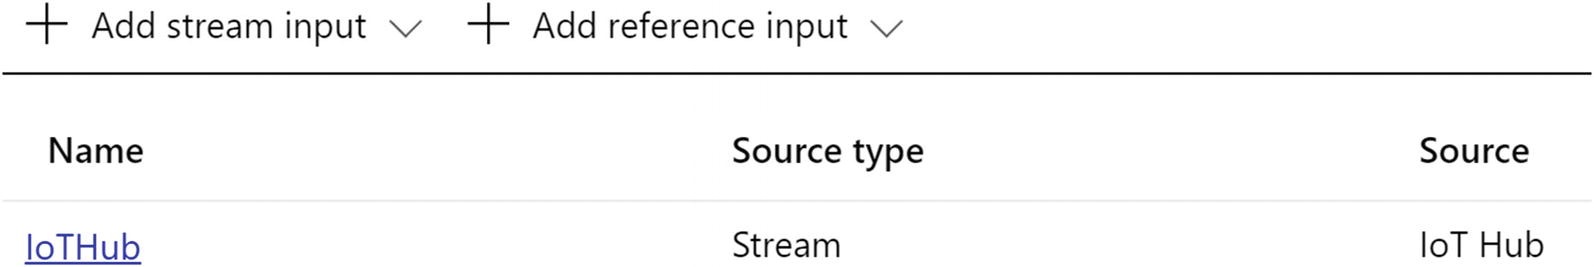
Click the Save button once you have specified the input stream details and have them how you want them. You’ll be taken to a screen like in Figure 16-15 where you’ll be able to see that the IoT Hub source stream has been created for you.
Figure 16-15
IoT Hub source stream
Add Stream Output
Similarly, also add an output stream, as shown in Figure 16-16. This will define the sink where the events will need to flow. Notice the various available sink options including ADLS Gen2, SQL Database, Cosmos DB, Power BI, and more. For this exercise, choose Power BI.
Figure 16-16
IoT output stream to PBI
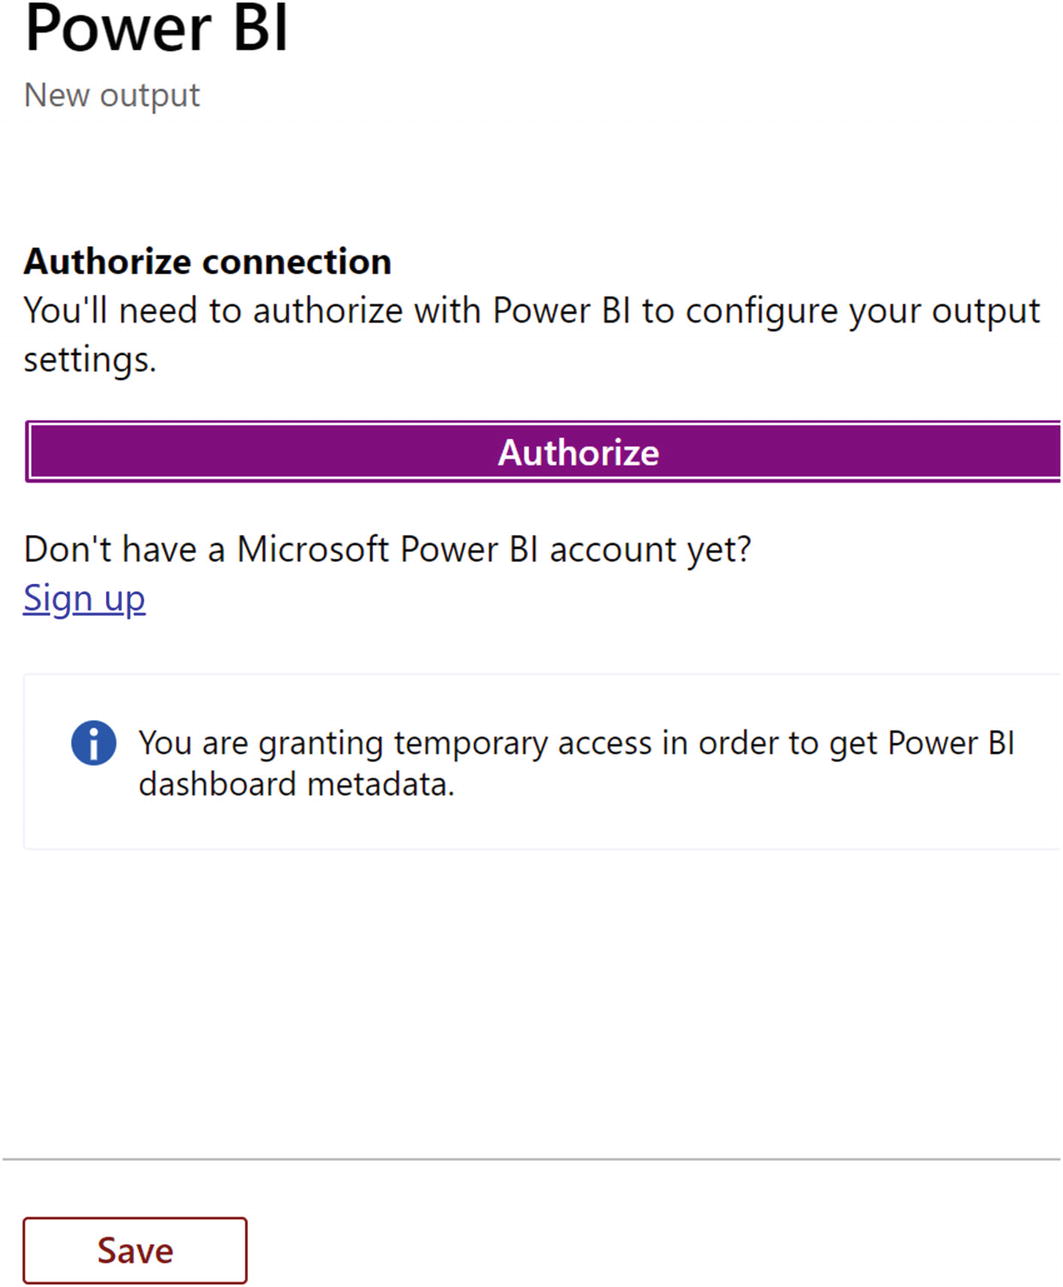
Next, authorize Power BI to access the Stream Analytics job, as shown in Figure 16-17.
Figure 16-17
Authorize Power BI to access ASA
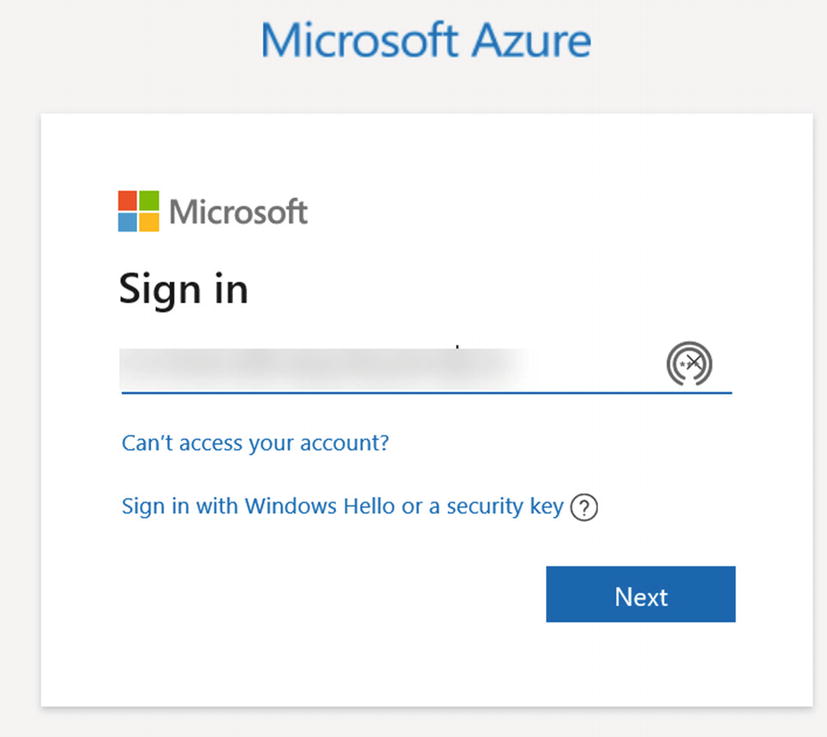
This will display a prompt to enter your Azure Portal credential and then click next, shown in Figure 16-18. Consider using a service account for production authorization and authentication rather than simply using a personal account for this purpose.
Figure 16-18
Log in to Azure Portal
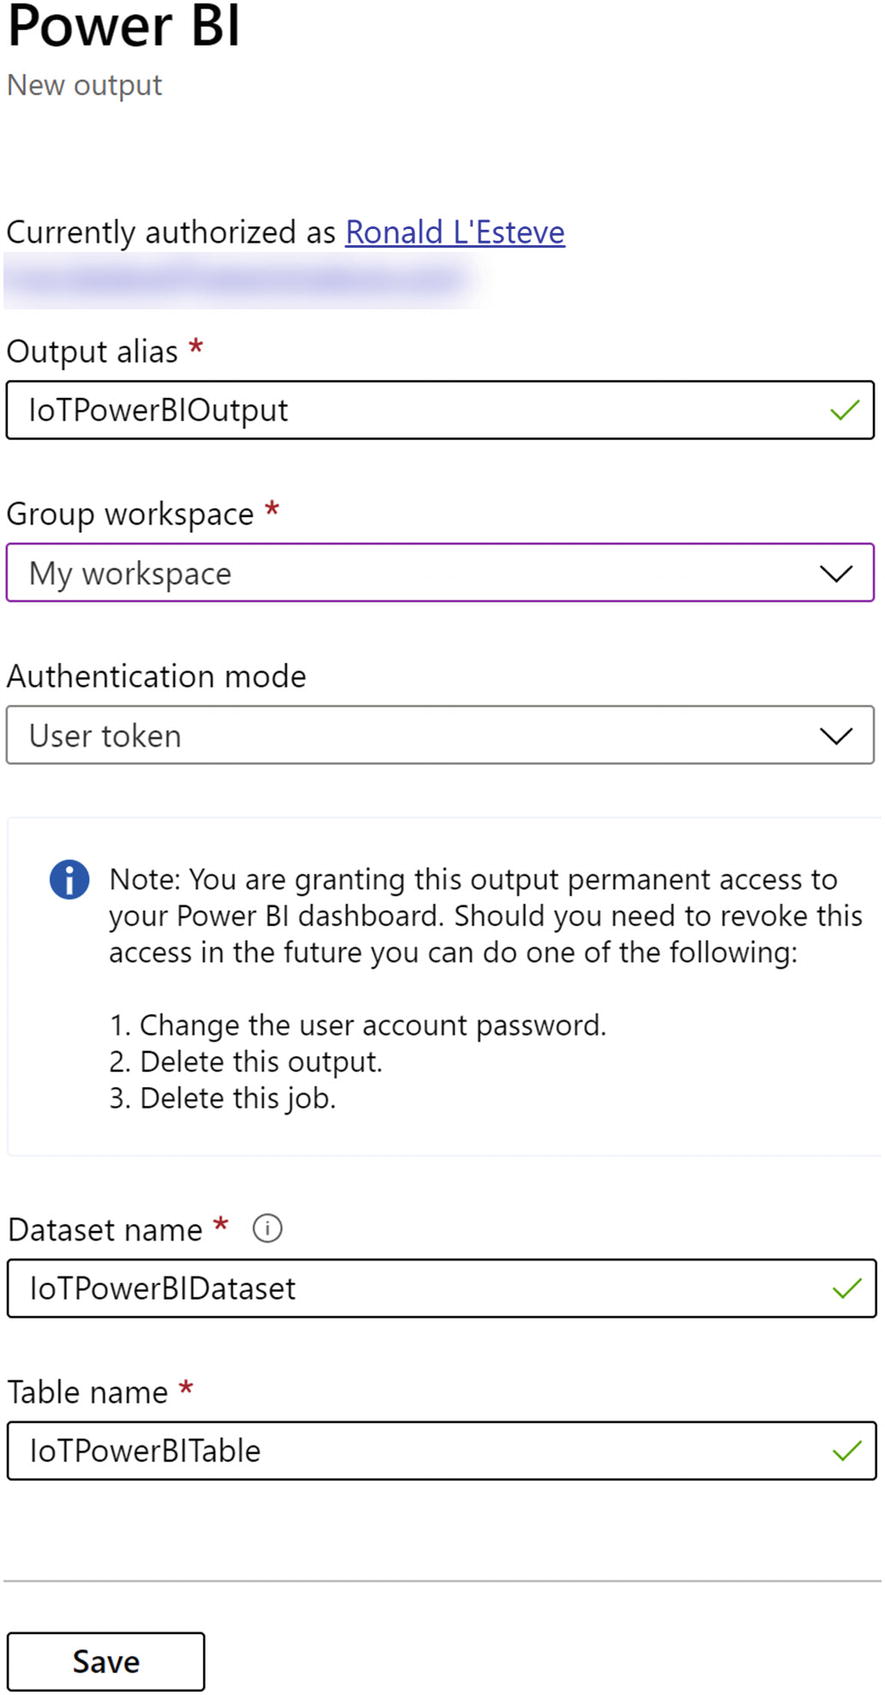
Configure the dataset and table and set the authentication mode to “User token” since this will be run ad hoc in dev/demo mode, which is shown in Figure 16-19.
Figure 16-19
Configure the dataset and table and set the authentication mode
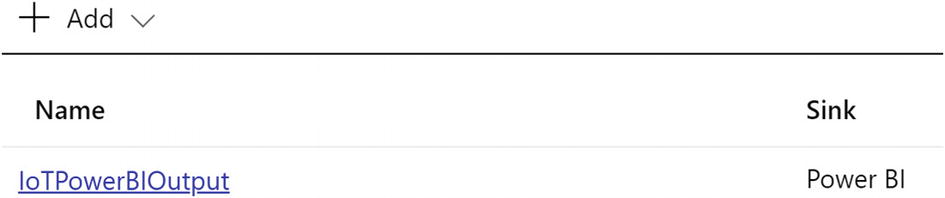
Lastly, Figure 16-20 shows that the IoTPowerBIOutput sink stream has been created.
Figure 16-20
IoTPowerBIOutput sink stream
Write the Stream Analytics Query
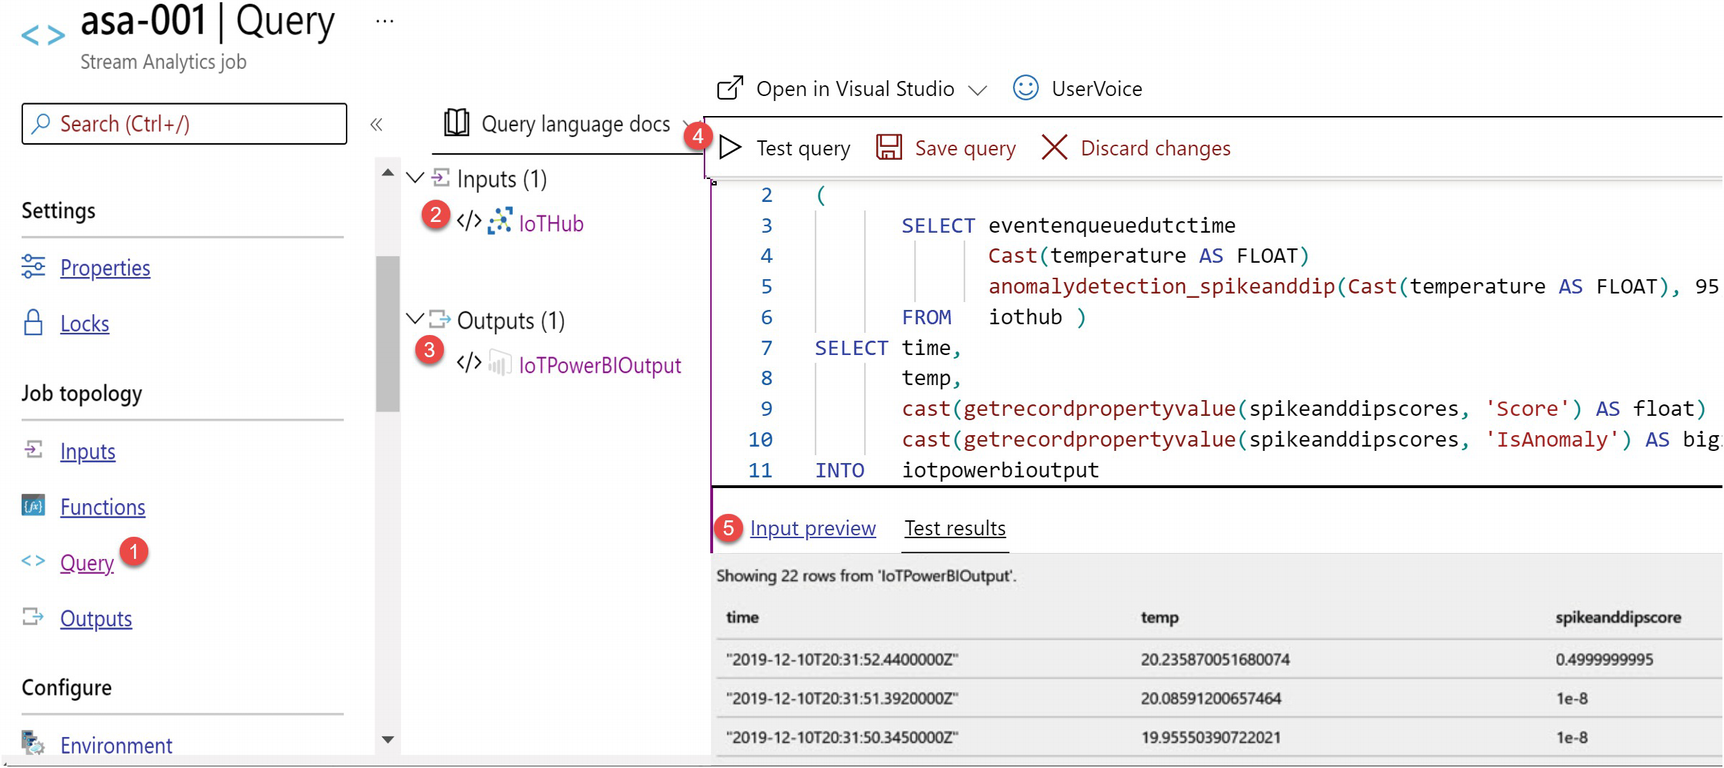
The final piece to creating the Stream Analytics job will be to write the SQL query for the anomaly detection. In this scenario, let’s use the Spike and Dip function. Azure Stream Analytics offers built-in machine learning–based anomaly detection capabilities that can be used to monitor the two most commonly occurring anomalies: temporary and persistent. With the AnomalyDetection_SpikeAndDip and AnomalyDetection_ChangePoint functions, you can perform anomaly detection directly in your Stream Analytics job. Anomaly detection in Azure Stream Analytics features machine learning–based anomaly detection operators such as Spike and Dip and Change Point. Figure 16-21 shows you where to add the SQL query that contains the built-in anomaly detection Spike and Dip function.
Figure 16-21
ASA SQL query for the anomaly detection
Here is the code that is being used as the source Stream Analytics query shown in Figure 16-21. This source query will take the incoming streaming events and apply a SQL query to them, which contains the addition of aliases, casting, and the usage of the Spike and Dip anomaly detection function that is a part of the Stream Analytics SQL query functions:
WITH anomalydetectionstep AS
(
SELECT eventenqueuedutctime
AS time,
Cast(temperature AS FLOAT)
AS temp,
anomalydetection_spikeanddip(Cast(temperature AS FLOAT), 95, 120, 'spikesanddips') OVER(limit duration(second, 120)) AS spikeanddipscores
FROM iothub )
SELECT time,
temp,
cast(getrecordpropertyvalue(spikeanddipscores, 'Score') AS float) AS spikeanddipscore,
cast(getrecordpropertyvalue(spikeanddipscores, 'IsAnomaly') AS bigint) AS isspikeanddipanomaly
INTO iotpowerbioutput
FROM anomalydetectionstep
Start the Stream Analytics Job
The final step to creating a successful Stream Analytics job is to start the job. This will ensure that events are being received from the IoT Hub device and passed to the Power BI service in real time. After all the necessary components of the job have been configured, start the Stream Analytics job, as shown in Figure 16-22. Notice that there is one IoT Hub input and one Power BI output.
Figure 16-22
Start the ASA job from Azure Portal
When starting the job, you will be prompted to set the job output start time, as shown in Figure 16-23. This job will start with a specific number of streaming units. You can change streaming units under the Scale section. The job will default to 3 streaming units. You can configure to run this job in either the standard multi-tenant environment that Stream Analytics provides or a dedicated Stream Analytics cluster that you own. The job will default to the standard environment. The job might need to read input data ahead of time to ensure results are accurate. To resume a stopped job without losing data, choose Last stopped. Note that this option isn’t available if you’re running a job for the first time. For the purposes of this exercise, ensure that the job output start time is set to “Now” and click Start.
Figure 16-23
ASA start job details
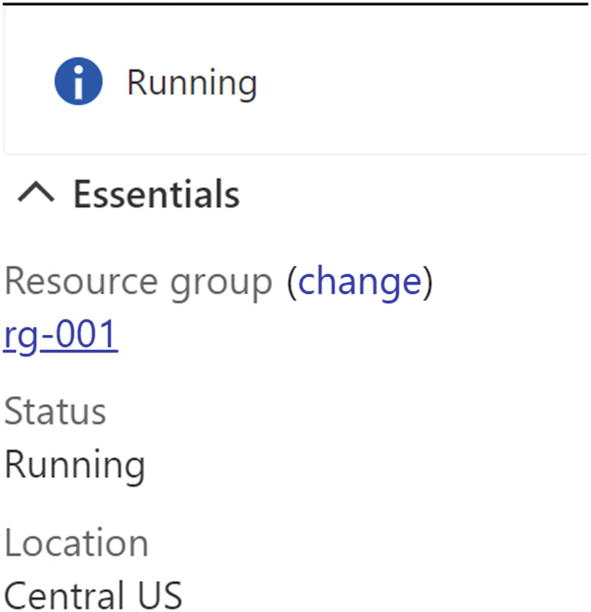
Notice the status of “Running” once the job has started, as shown in Figure 16-24.
Figure 16-24
ASA job in Running status
Create a Real-Time Power BI Dashboard
Once the job is running, head over to Power BI to begin building the real-time dashboard. It is on this dashboard that you’ll be able to see the results of your monitoring query. Keeping an eye on the dashboard is how you will know when an anomaly is present.
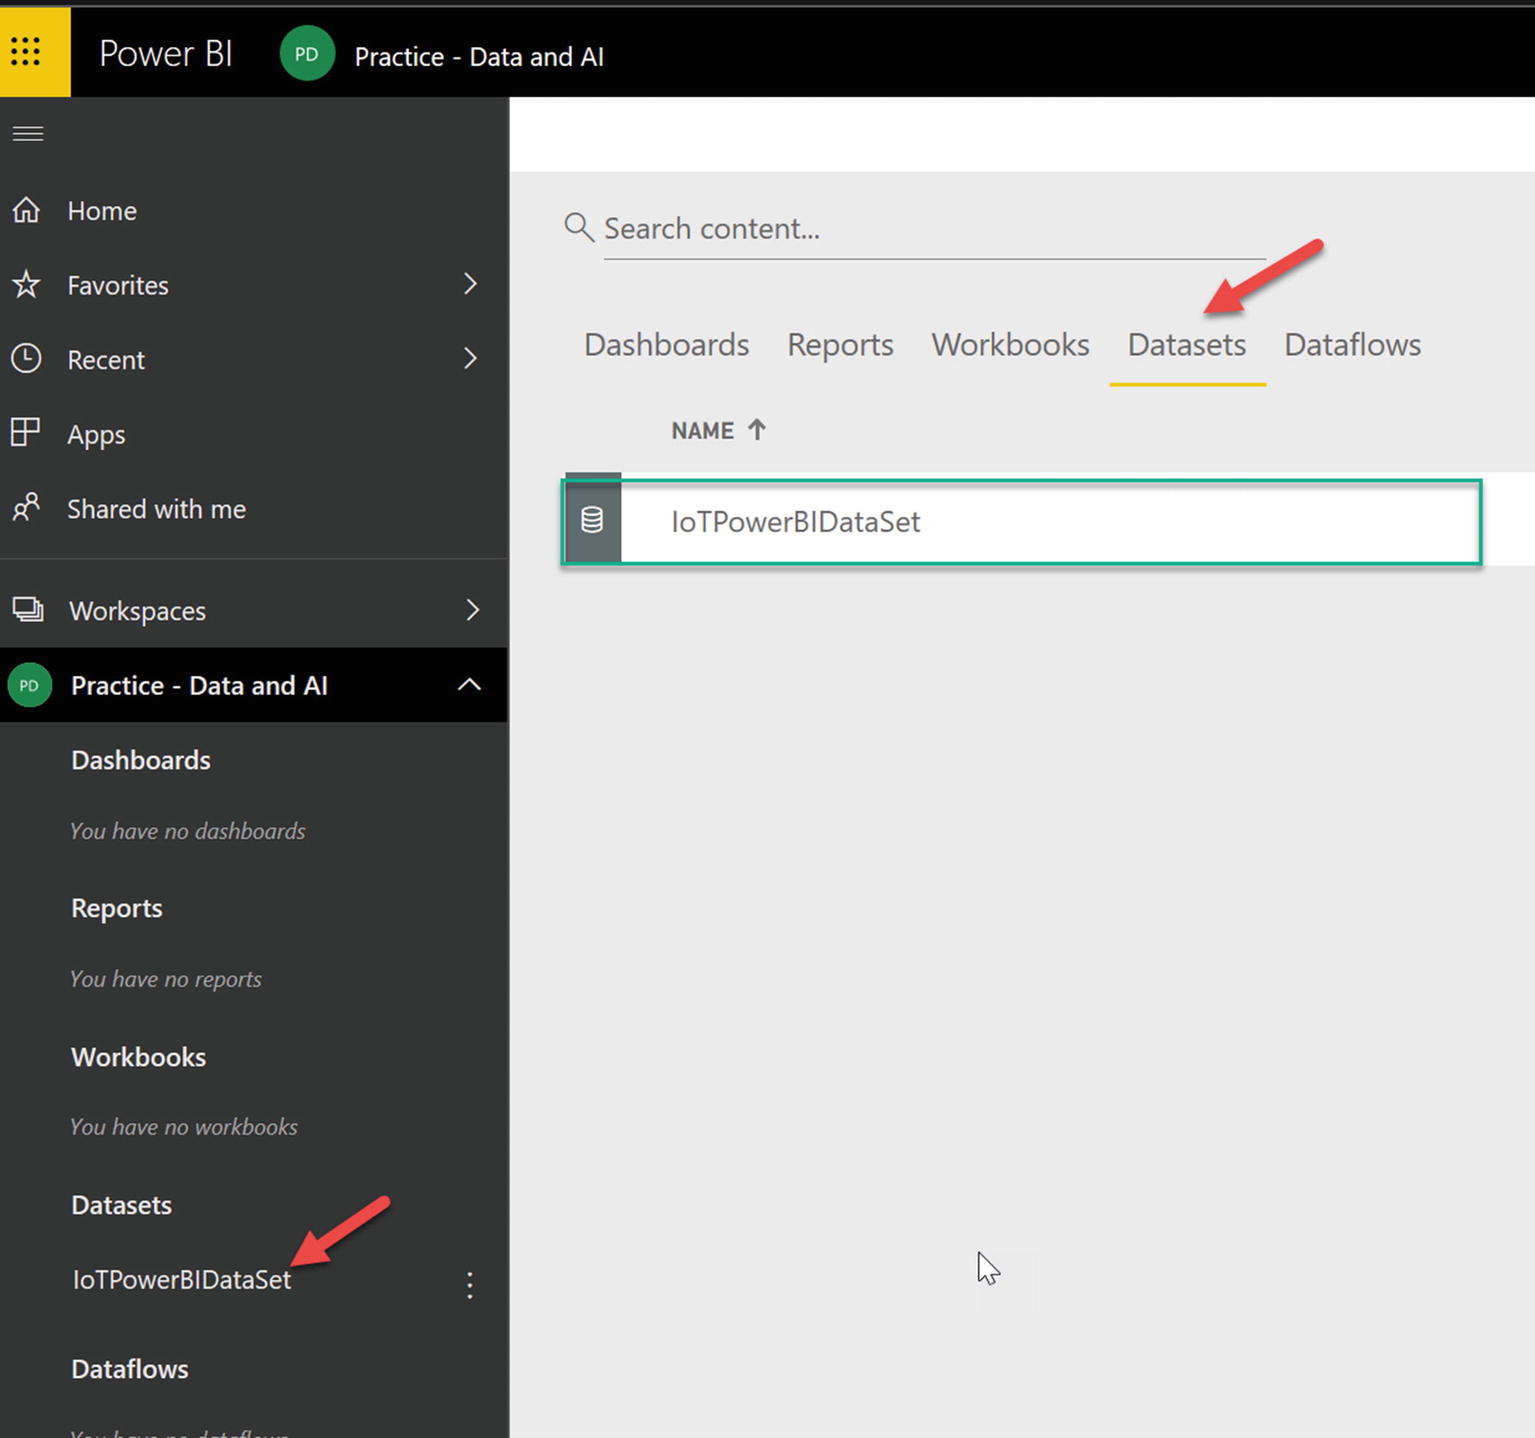
Create a Dataset
Start by navigating to the workspace containing the IoTPowerBIDataSet in the Datasets section shown in Figure 16-25. Note that the Stream Analytics job must be running and must have processed at least one event for the dataset to be created.
Figure 16-25
PBI create datasets
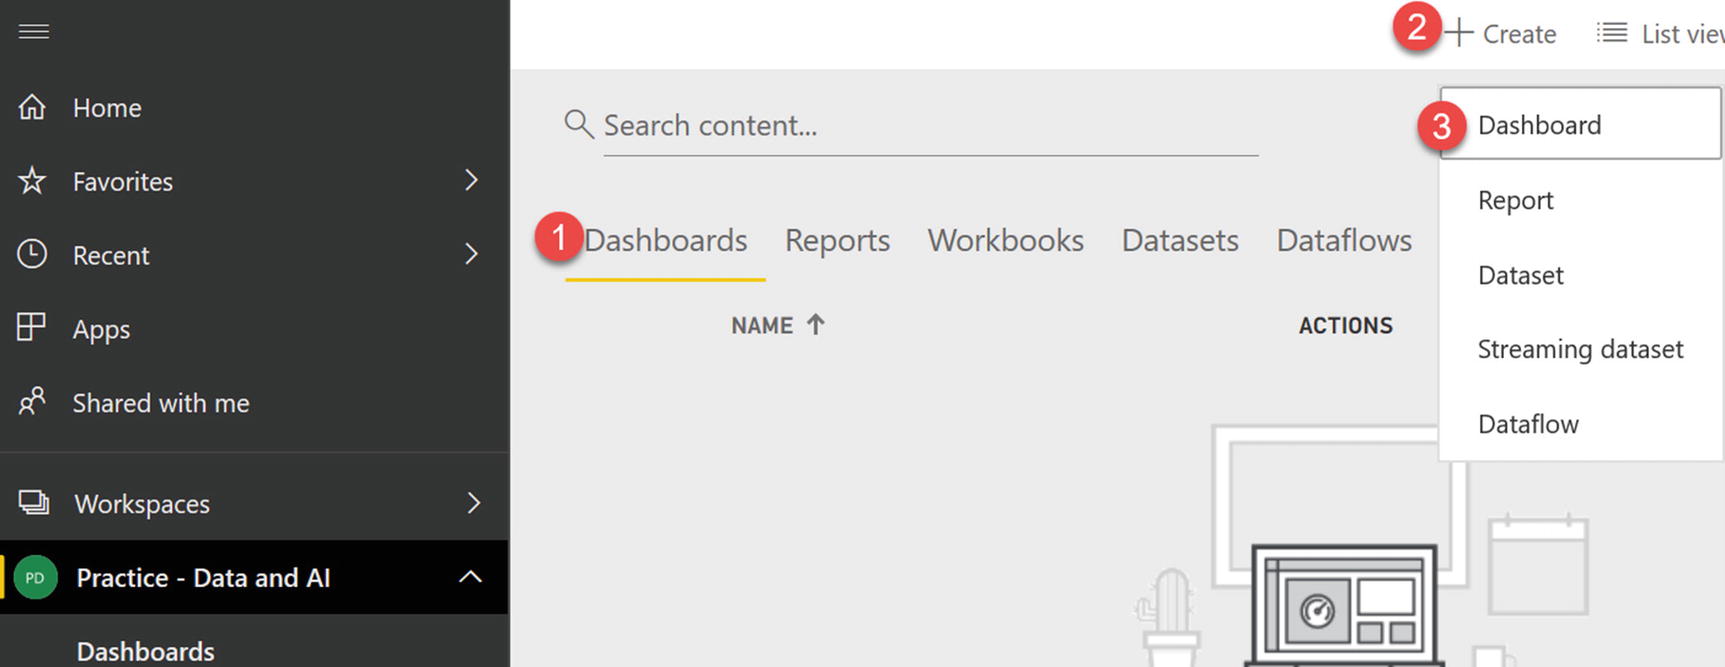
Create a Dashboard
After verifying that the dataset was created, also create a new dashboard, as shown in Figure 16-26.
Figure 16-26
PBI create a dashboard
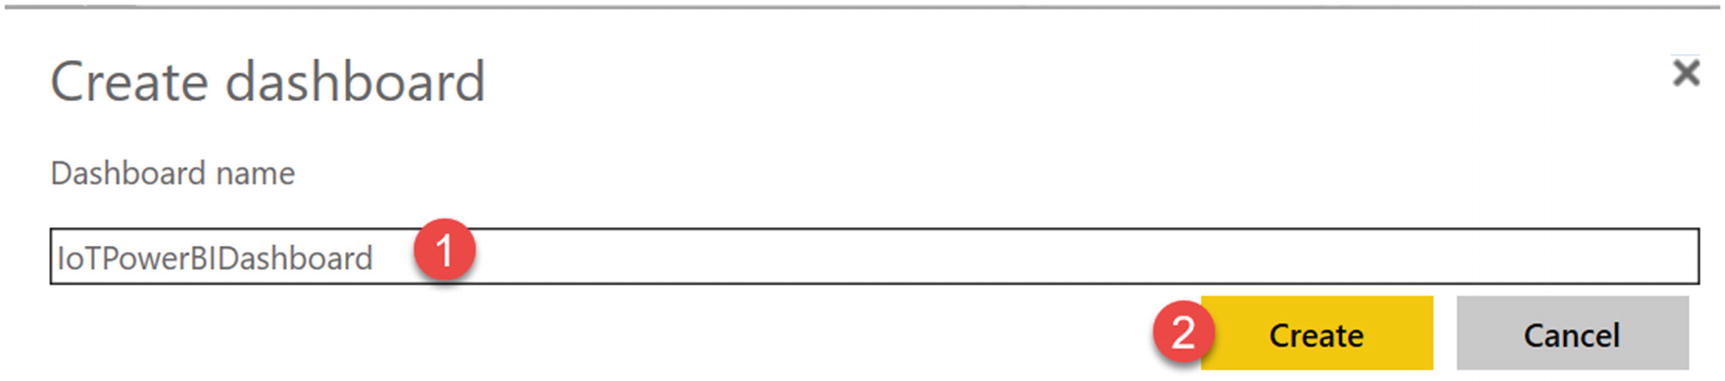
Give the dashboard a name. In this exercise, it is called IoTPowerBIDashboard, as shown in Figure 16-27.
Figure 16-27
PBI name the dashboard
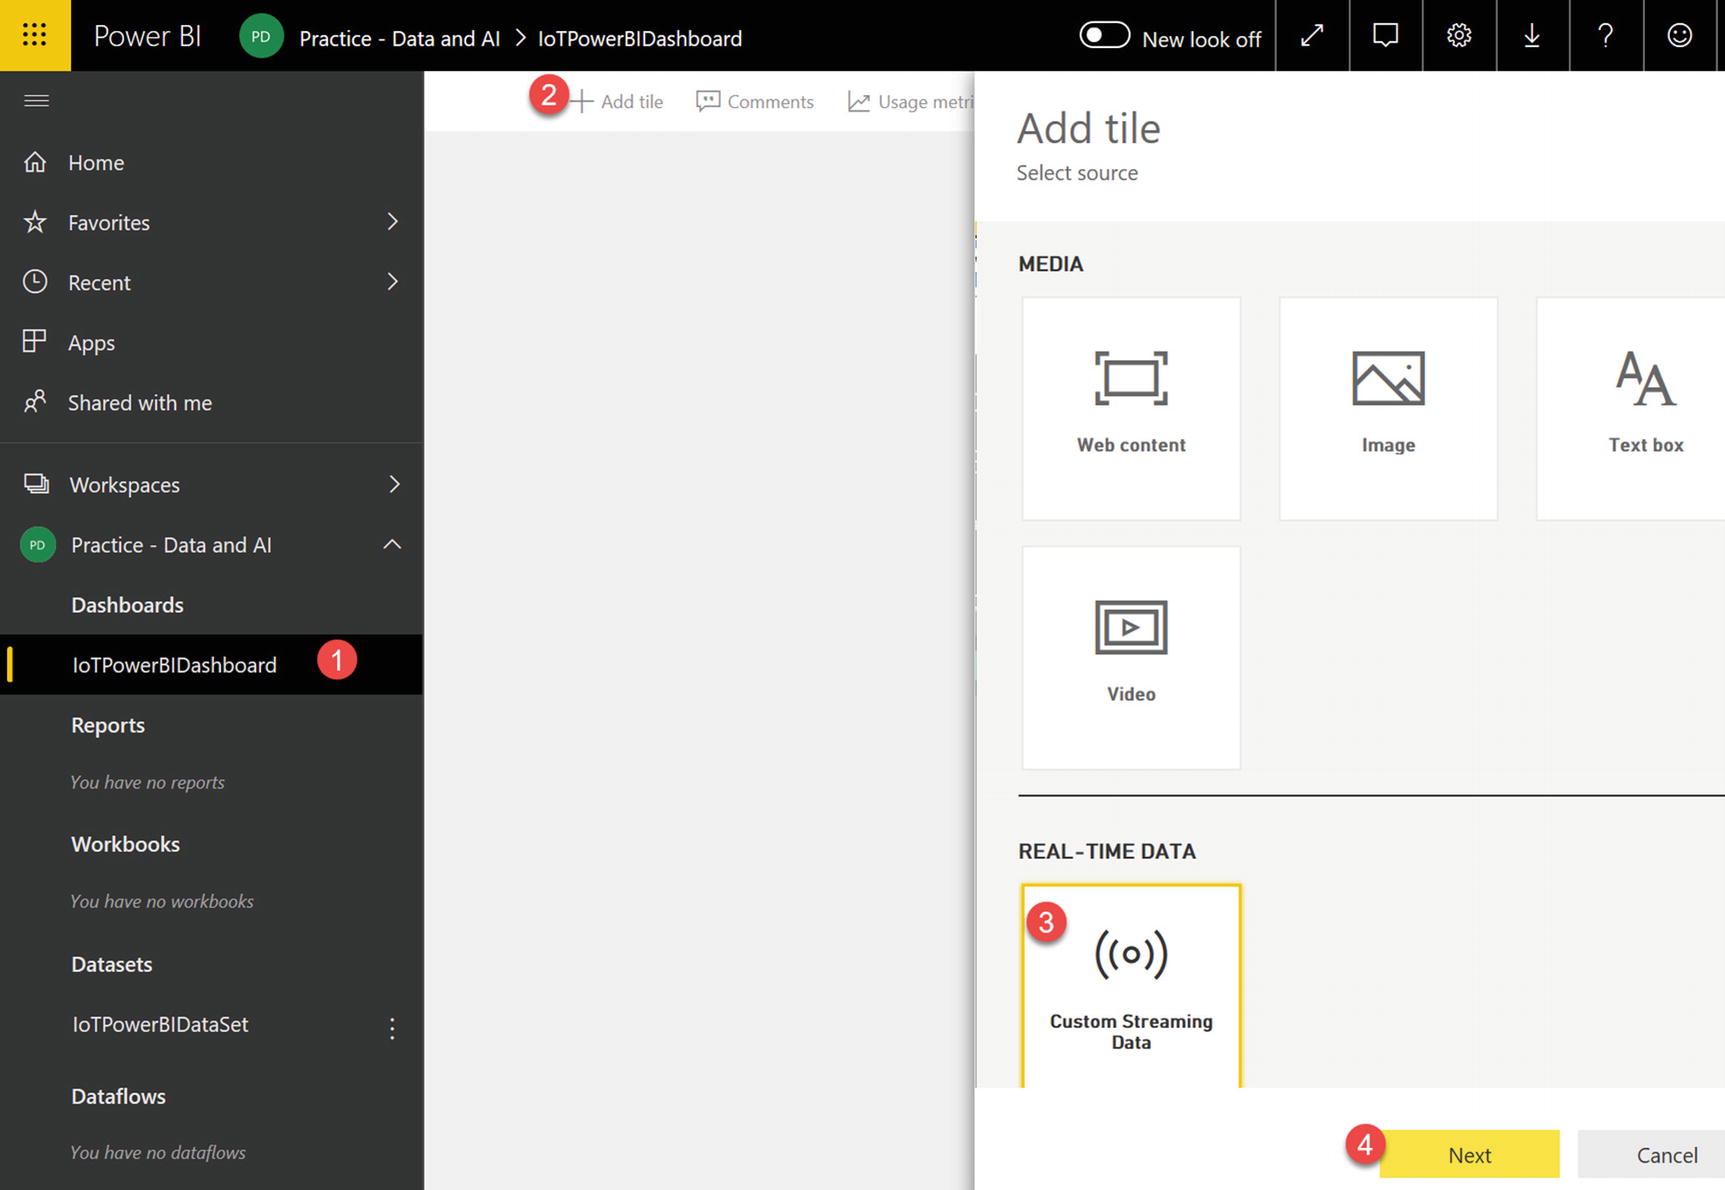
Add a Tile
A tile is a snapshot of your data, pinned to the dashboard. A tile can be created from a report, dataset, dashboard, and more. Dashboards and dashboard tiles are a feature of Power BI service, not Power BI Desktop, so you’ll need to ensure you have the Power BI service up and running. Add a tile for the real-time custom streaming data, as shown in Figure 16-28.
Figure 16-28
PBI add a tile
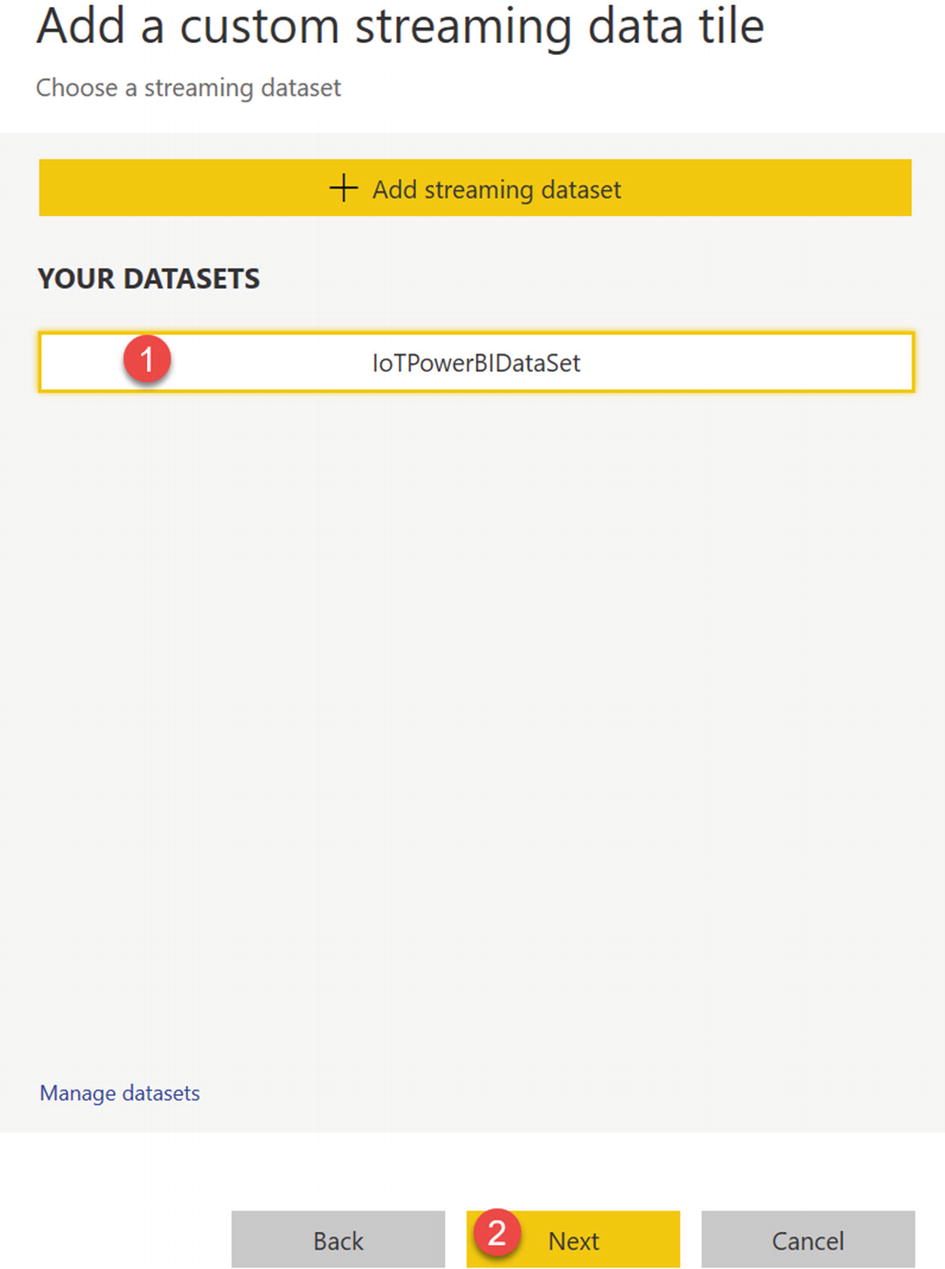
Select the dataset, as shown in Figure 16-29. Note that a dataset is a collection of data that you import or connect to. Power BI lets you connect to and import all sorts of datasets and bring all of them together in one place. Datasets are associated with workspaces, and a single dataset can be part of many workspaces.
Figure 16-29
PBI add a custom streaming data tile
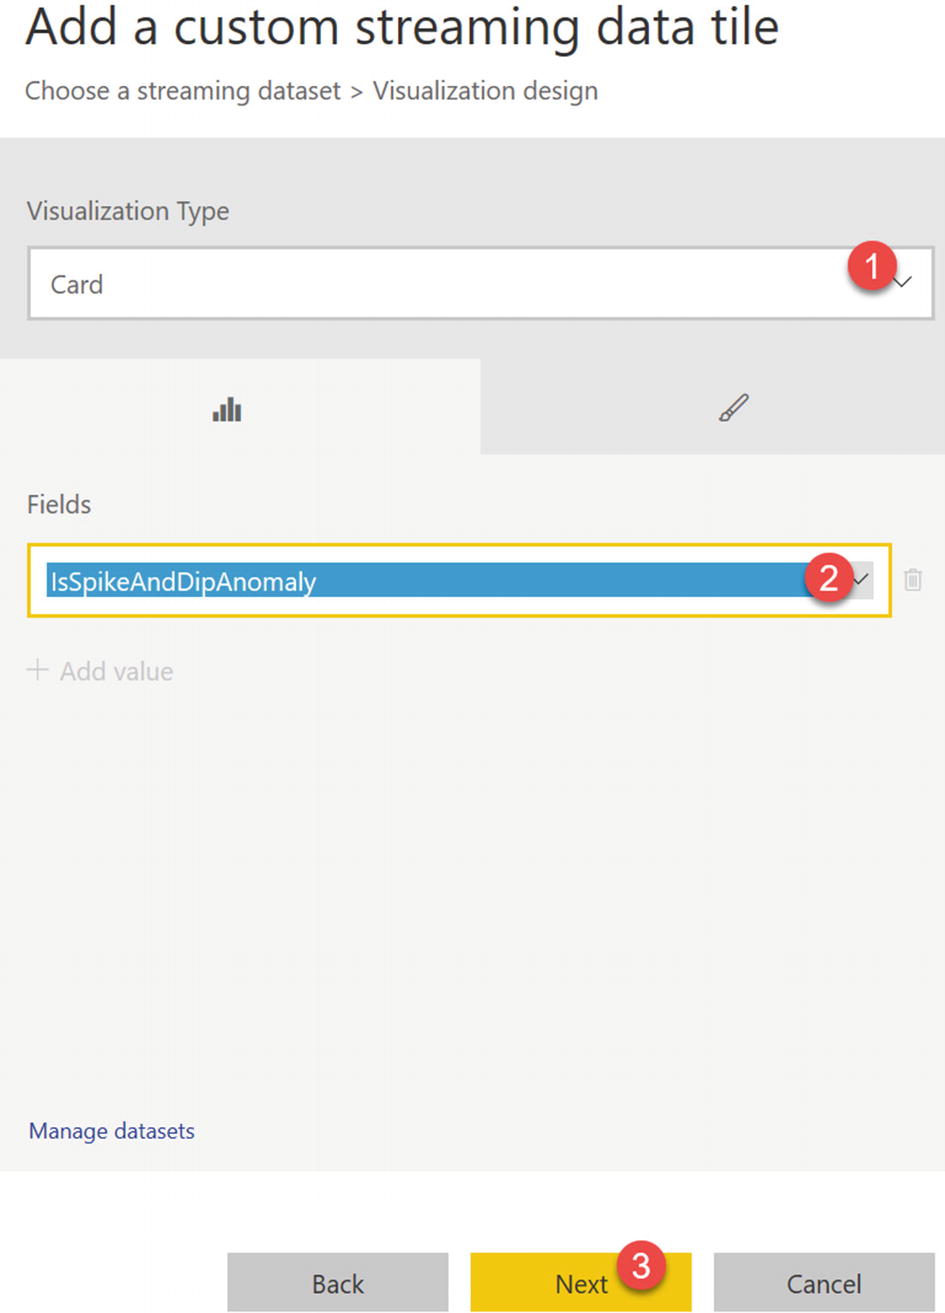
A card visualization is a solitary number within your Power BI dashboard and mostly the most critical thing you need to track in your dashboard or report. In this exercise, anomalies are the most critical metric that will need to be tracked. Add a card visualization to track the count of Spike and Dip anomalies, as shown in Figure 16-30.
Figure 16-30
PBI add a card visualization
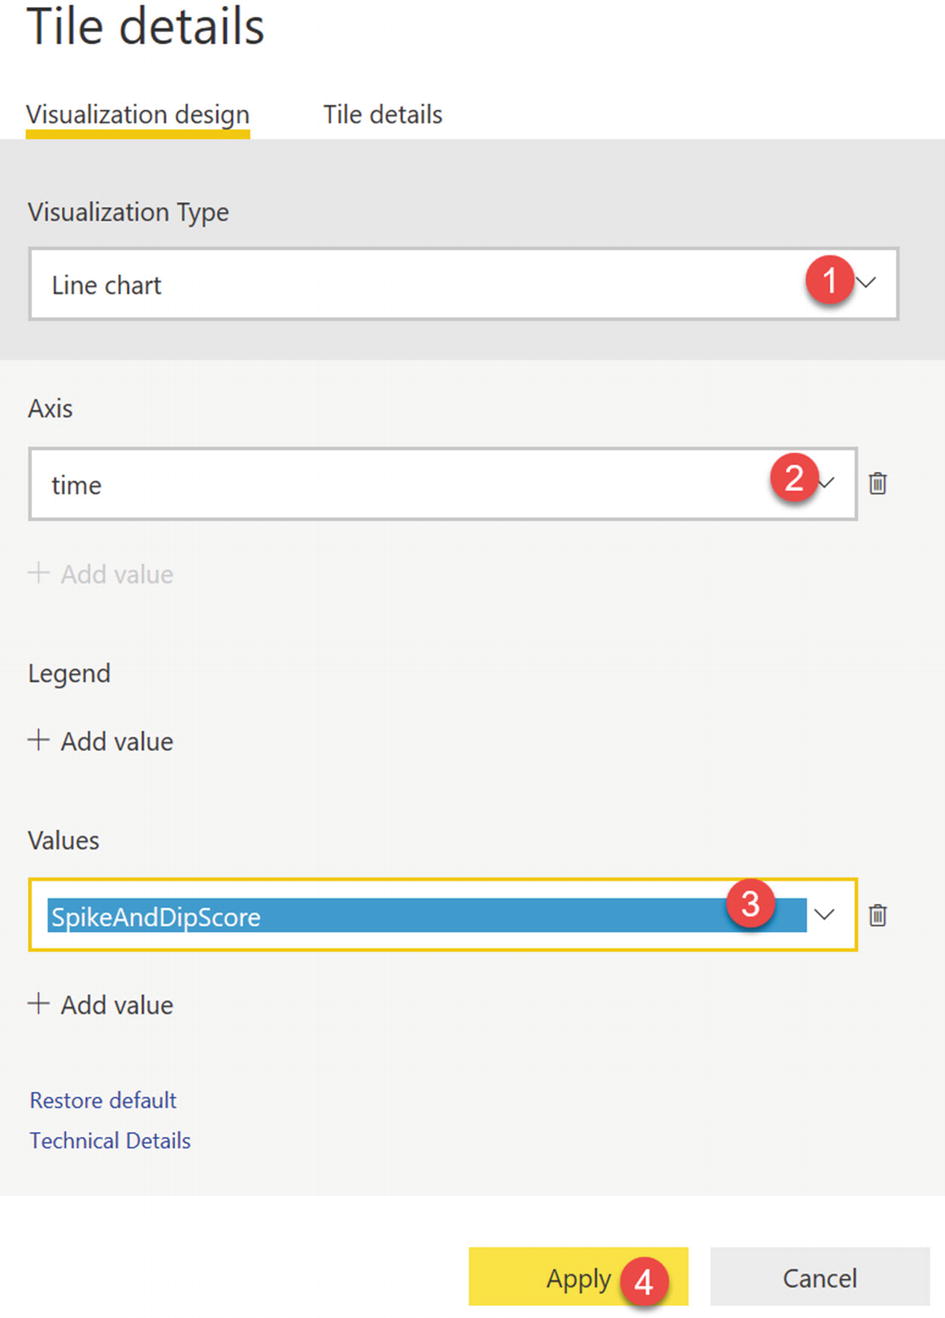
A line chart is a series of data points that are represented by dots and connected by straight lines. A line chart may have one or many lines. Line charts have an X and a Y axis. Also add a line chart visualization to track the Spike and Dip scores, as shown in Figure 16-31.
Figure 16-31
PBI Tile details
Run the Device Simulator
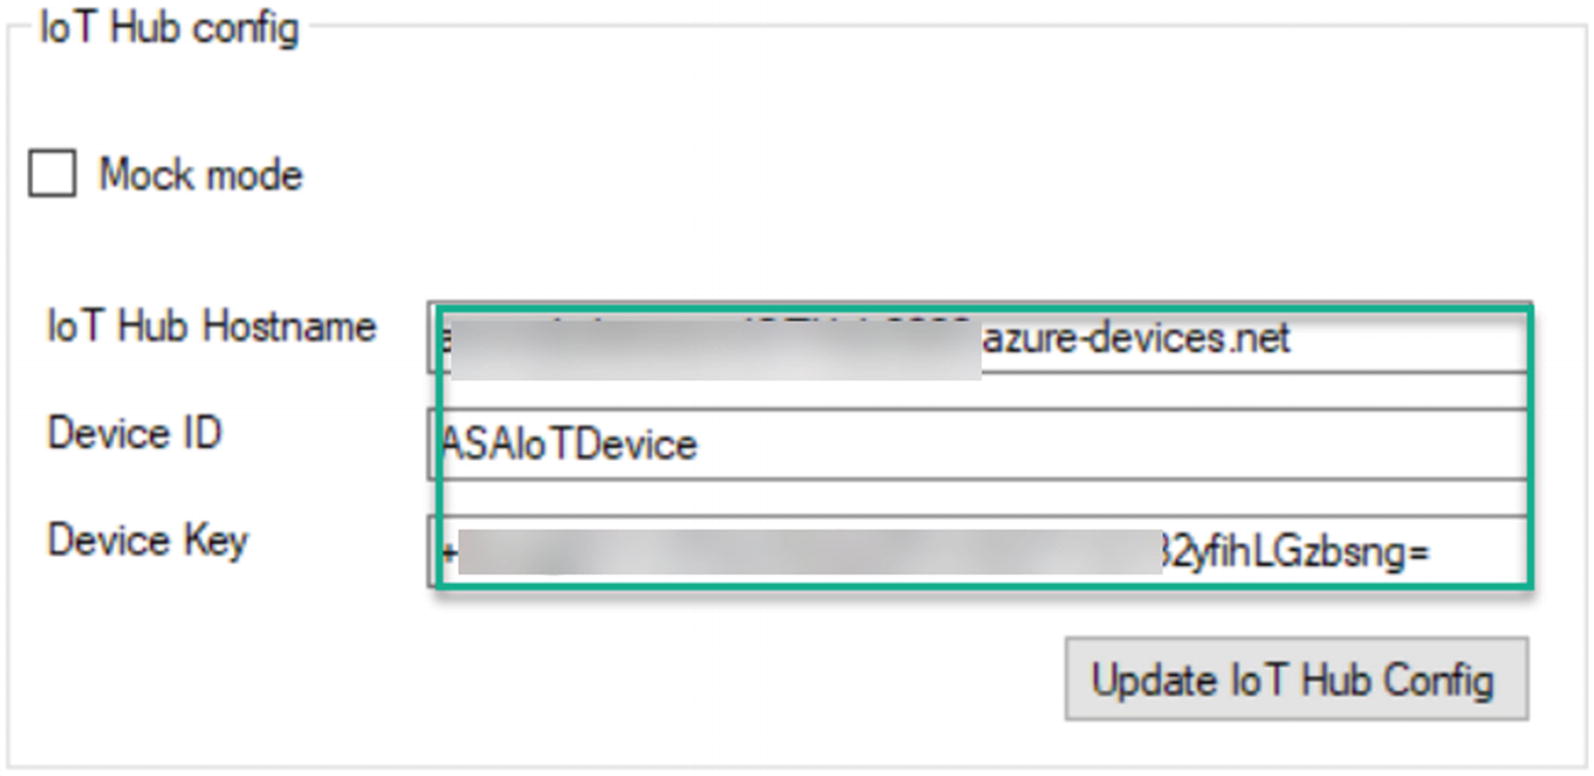
Now head back to the Device Simulator and configure the IoT Hub details that you’ve accumulated from the previous sections of this chapter. Once the details are configured, click “Update IoT Hub Config” in the Device Simulator, as shown in Figure 16-32.
Figure 16-32
IoT Hub config details
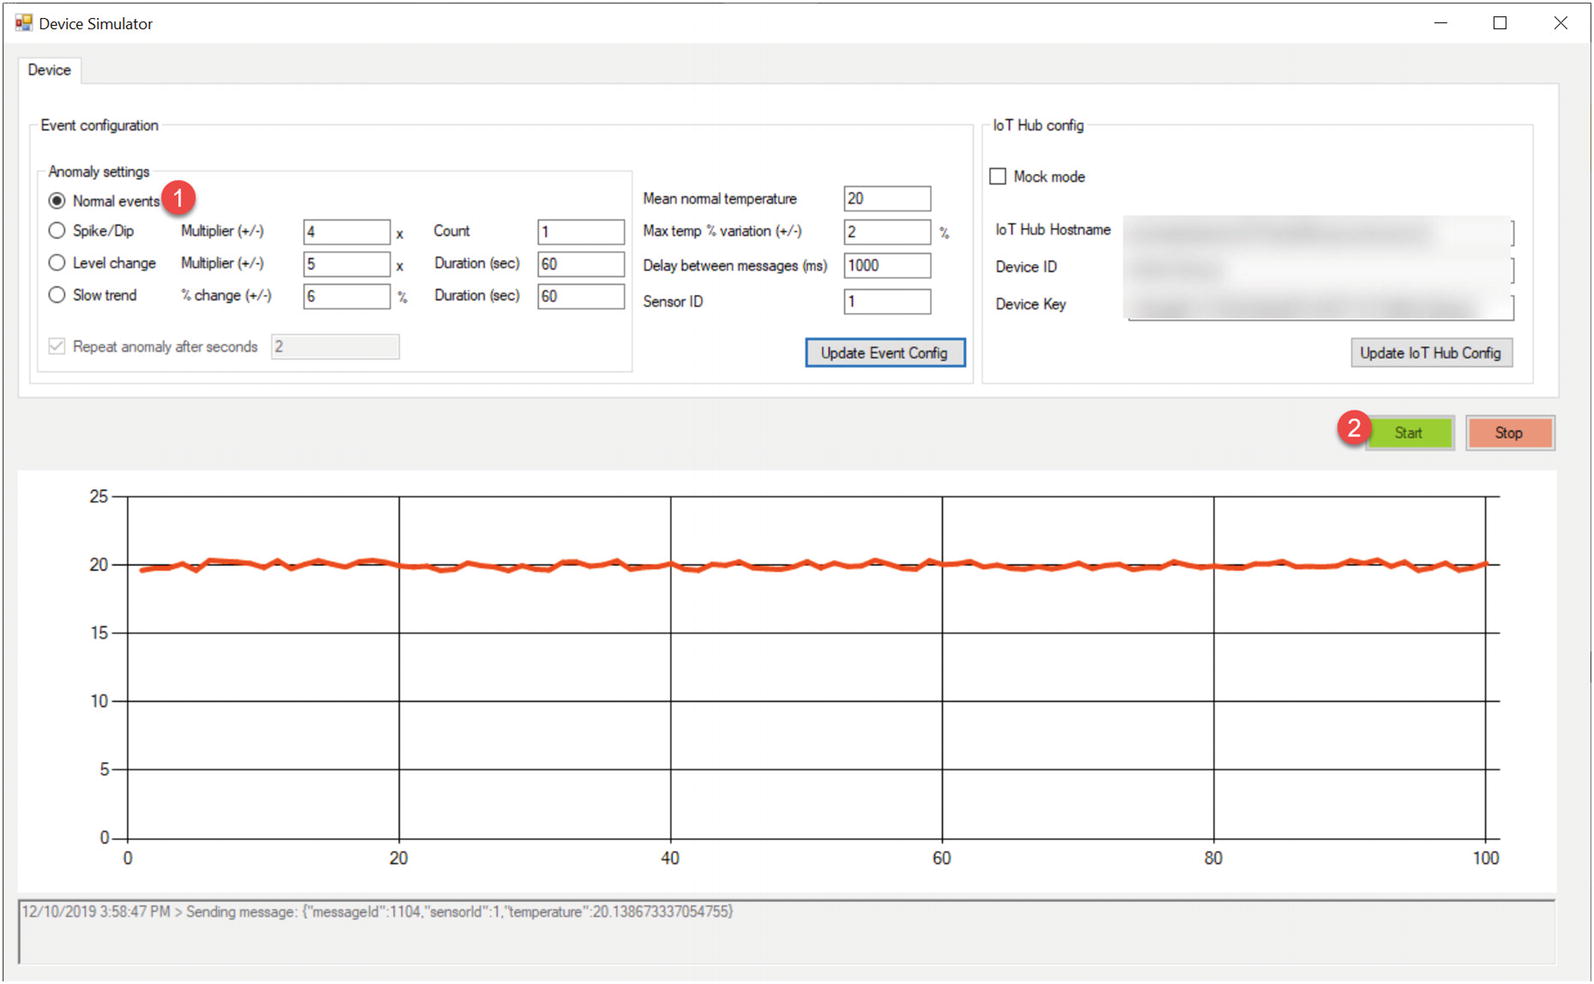
Select anomaly settings for normal events, shown in Figure 16-33, and start the Device Simulator. This will simply get the simulator started and begin generating a normal set of events that will be passed to the IoT Hub and to the Power BI dashboard.
Figure 16-33
Device Simulator anomaly settings for normal events
Monitor Real-Time Power BI Streaming
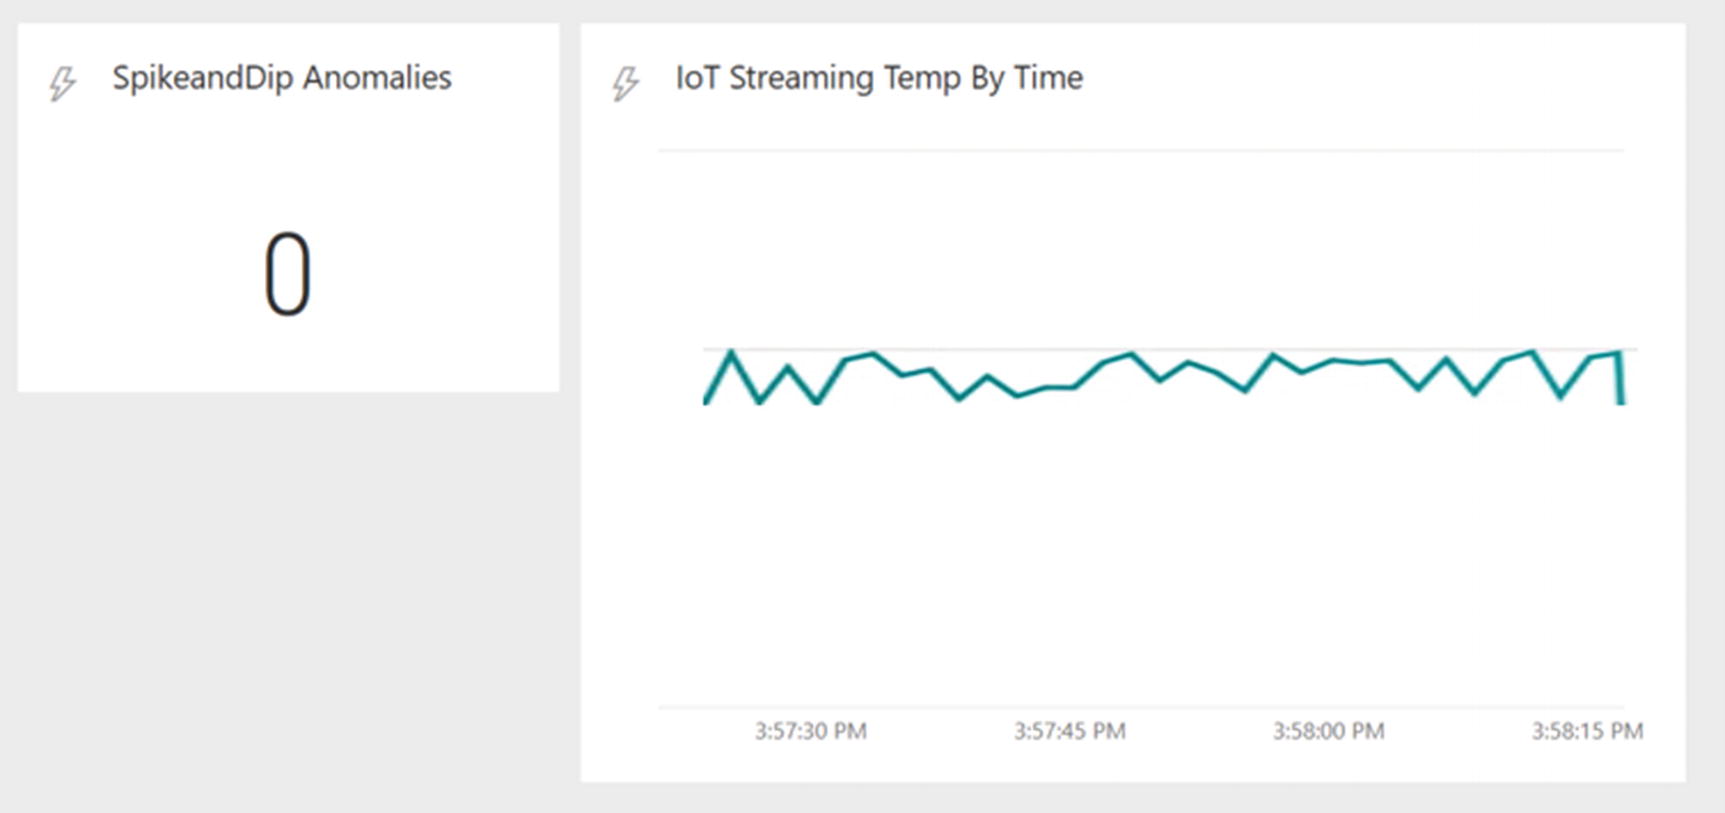
Once the device has been started, head back to your Power BI dashboard to begin monitoring the stream. Notice from Figure 16-34 that the streaming details are now available on the Power BI dashboard. Note also how the SpikeandDip Anomalies card is still 0 since we are currently only streaming normal events.
Figure 16-34
PBI real-time streaming dashboard with normal events
Then head back to the simulator and change the anomaly settings to Spike/Dip and have it repeat every 2 seconds. Notice from Figure 16-35 that the anomalies have begun in the simulator.
Figure 16-35
Device Simulator creating anomaly events
After heading back to the real-time Power BI dashboard, notice that the Spike and Dip anomalies have begun flowing into the dashboard and the SpikeandDip Anomalies card is beginning to display the incoming anomalies, shown in Figure 16-36.
Figure 16-36
PBI Spike and Dip anomalies
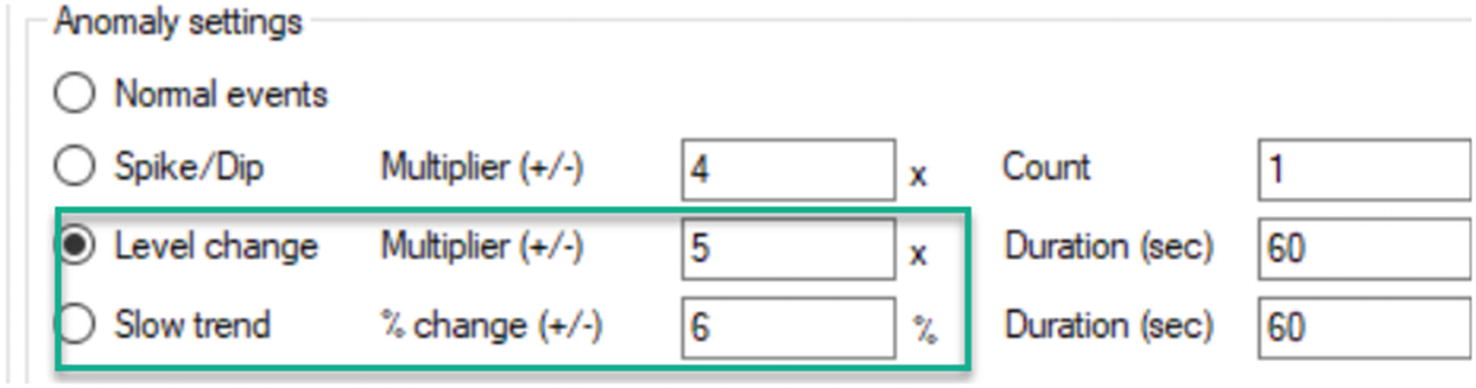
There are a few additional anomaly settings in the Device Simulator that could be explored as a next step, such as Level change and Slow trend, as shown in Figure 16-37.
Figure 16-37
PBI anomaly settings in Device Simulator
Once the tests are complete, ensure that you head back to Azure Portal and stop the Stream Analytics job and Device Simulator as well, as shown in Figure 16-38.
Figure 16-38
Stop the streaming job
Summary
In this chapter, I have demonstrated a practical end-to-end example of how to create real-time events using a Device Simulator and send those events to an IoT Hub, which will collect those events and process for downstream anomaly detection using Azure Stream Analytics’ built-in Spike and Dip anomaly detection function. Finally, you learned how to use Power BI for visualizing the real-time streaming data into a dashboard. You also learned about some of the capabilities of real-time anomaly detection and reporting in Azure.