
So far, we measured the latency of our applications, and we created alerts that fire when certain thresholds based on request duration are reached. Those alerts are not based on the number of requests coming in (traffic), but on the percentage of slow requests. The AppTooSlow would fire even if only one single request enters an application, as long as the duration is above the threshold. For completeness, we need to start measuring traffic or, to be more precise, the number of requests sent to each application and the system as a whole. Through that, we can know if our system is under a lot of stress and make a decision on whether to scale our applications, add more workers, or apply some other solution to mitigate the problem. We might even choose to block part of the incoming traffic if the number of requests reaches abnormal numbers providing a clear indication that we are under Denial of Service (DoS) attack (https://en.wikipedia.org/wiki/Denial-of-service_attack).
We'll start by creating a bit of traffic that we can use to visualize requests.
 1  for i in {1..100}; do
 2      curl "http://$GD5_ADDR/demo/hello"
 3  done
 4
 5  open "http://$PROM_ADDR/graph"
We sent a hundred requests to the go-demo-5 application and opened Prometheus' graph screen.
We can retrieve the number of requests coming into the Ingress controller through the nginx_ingress_controller_requests. Since it is a counter, we can continue using rate function combined with sum. Finally, we probably want to know the rate of requests grouped by the ingress label.
Please type the expression that follows, press the Execute button, and switch to the Graph tab.
 1  sum(rate(
 2    nginx_ingress_controller_requests[5m]
 3  ))
 4  by (ingress)
We can see a spike on the right side of the graph. It shows the requests that went to the go-demo-5 applications through the Ingress with the same name.
In my case (screenshot following), the peak is close to one request per second (yours will be different).

We are probably more interested in the number of requests per second per replica of an application, so our next task is to find a way to retrieve that data. Since go-demo-5 is a Deployment, we can use kube_deployment_status_replicas.
Please type the expression that follows, and press the Execute button.
1 kube_deployment_status_replicas
We can see the number of replicas of each Deployment in the system. The go-demo-5 application, in my case painted in red (screenshot following), has three replicas.

Next, we should combine the two expressions, to get the number of requests per second per replica. However, we are facing a problem. For two metrics to join, they need to have matching labels. Both the Deployment and the Ingress of go-demo-5 have the same name so we can use that to our benefit, given that we can rename one of the labels. We'll do that with the help of the label_join (https://prometheus.io/docs/prometheus/latest/querying/functions/#label_join()) function.
If the previous explanation of the label_join function was confusing, you're not alone. Instead, let's go through the example that will transform kube_deployment_status_replicas by adding ingress label that will contain values from the deployment label. If we are successful, we'll be able to combine the result with nginx_ingress_controller_requests since both will have the same matching labels (ingress).
Please type the expression that follows, and press the Execute button.
 1  label_join(
 2    kube_deployment_status_replicas,
 3    "ingress",
 4    ",",
 5    "deployment"
 6  )
Since we are, this time, interested mostly in values of the labels, please switch to the Console view by clicking the tab.
As you can see from the output, each metric now contains an additional label ingress with the same value as deployment.

Now we can combine the two metrics.
Please type the expression that follows, and press the Execute button.
 1  sum(rate(
 2    nginx_ingress_controller_requests[5m]
 3  ))
 4  by (ingress) /
 5  sum(label_join(
 6    kube_deployment_status_replicas,
 7    "ingress",
 8    ",",
 9    "deployment"
10  ))
11  by (ingress)
Switch back to the Graph view.
We calculated the rate of the number of requests per application (ingress) and divided it with the total number of replicas per application (ingress). The end result is the rate of the number of requests per application (ingress) per replica.
It might be worth noting that we can not retrieve the number of requests for each specific replica, but rather the average number of requests per replica. This method should work, given that Kubernetes networking in most cases performs round robin that results in more or less the same amount of requests being sent to each replica.
All in all, now we know how many requests our replicas are receiving per second.

Now that we learned how to write an expression to retrieve the rate of the number of requests per second per replica, we should convert it into an alert.
So, let's take a look at the difference between the old and the new definition of Prometheus' Chart values.
 1  diff mon/prom-values-latency.yml
 2      mon/prom-values-latency2.yml
The output is as follows.
62a63,69
> - alert: TooManyRequests
>   expr: sum(rate(nginx_ingress_controller_requests[5m])) by (ingress) / sum(label_join(kube_deployment_status_replicas, "ingress", ",", "deployment")) by (ingress) > 0.1
>   labels:
>     severity: notify
>   annotations:
>     summary: Too many requests
>     description: There is more than average of 1 requests per second per replica for at least one application
We can see that the expression is almost the same as the one we used in Prometheus' graph screen. The only difference is the threshold which we set to 0.1. As a result, that alert should notify us whenever a replica receives more than a rate of 0.1 requests per second, calculated over the period of five minutes ([5m]). As you might have guessed, 0.1 requests per second is too low of a figure to use it in production. However, it'll allow us to trigger the alert easily and see it in action.
Now, let's upgrade our Chart, and open Prometheus' alerts screen.
 1  helm upgrade -i prometheus
 2    stable/prometheus
 3    --namespace metrics
 4    --version 7.1.3
 5    --set server.ingress.hosts={$PROM_ADDR}
 6    --set alertmanager.ingress.hosts={$AM_ADDR}
 7    -f mon/prom-values-latency2.yml
 8
 9  open "http://$PROM_ADDR/alerts"
Please refresh the screen until the TooManyRequests alert appears.

Next, we'll generate some traffic so that we can see the alert is generated and sent through Alertmanager to Slack.
 1  for i in {1..200}; do
 2      curl "http://$GD5_ADDR/demo/hello"
 3  done
 4
 5  open "http://$PROM_ADDR/alerts"
We sent two hundred requests and reopened the Prometheus' alerts screen. Now we should refresh the screen until the TooManyRequests alert becomes red.
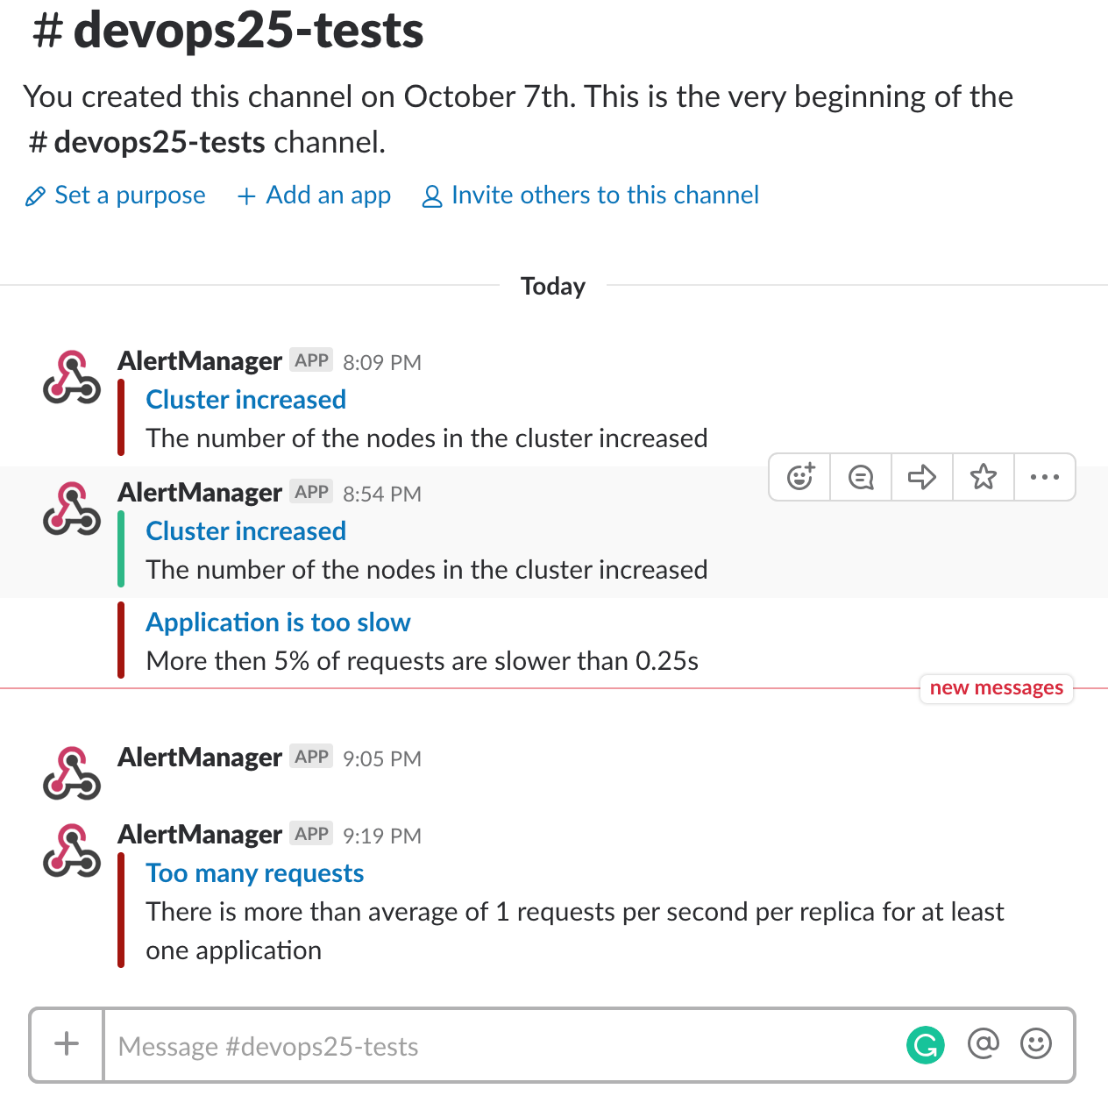
Once Prometheus fired the alert, it was sent to Alertmanager and, from there, forwarded to Slack. Let's confirm that.
1 open "https://devops20.slack.com/messages/CD8QJA8DS/"
We can see the Too many requests notification, thus proving that the flow of this alert works.
Next, we'll jump into errors-related metrics.