
Saturation measures fullness of our services and the system. We should be aware if replicas of our services are processing too many requests and being forced to queue some of them. We should also monitor whether usage of our CPUs, memory, disks, and other resources reaches critical limits.
For now, we'll focus on CPU usage. We'll start by opening the Prometheus' graph screen.
1 open "http://$PROM_ADDR/graph"
Let's see if we can get the rate of used CPU by node (instance). We can use node_cpu_seconds_total metric for that. However, it is split into different modes, and we'll have to exclude a few of them to get the "real" CPU usage. Those will be idle, iowait, and any type of guest cycles.
Please type the expression that follows, and press the Execute button.
 1  sum(rate(
 2    node_cpu_seconds_total{
 3      mode!="idle",
 4      mode!="iowait",
 5      mode!~"^(?:guest.*)$"
 6   }[5m]
 7  ))
 8  by (instance)
Switch to the Graph view.
The output represents the actual usage of CPU in the system. In my case (screenshot following), excluding a temporary spike, all nodes are using less than a hundred CPU milliseconds.
The system is far from being under stress.

As you already noticed, absolute numbers are rarely useful. We should try to discover the percentage of used CPU. We'll need to find out how much CPU our nodes have. We can do that by counting the number of metrics. Each CPU gets its own data entry, one for each mode. If we limit the result to a single mode (for example, system), we should be able to get the total number of CPUs.
Please type the expression that follows, and press the Execute button.
 1  count(
 2    node_cpu_seconds_total{
 3      mode="system"
 4    }
 5  )
In my case (screenshot following), there are six cores in total. Yours is likely to be six as well if you're using GKE, EKS, or AKS from the Gists. If, on the other hand, you're running the cluster in Docker for Desktop or minikube, the result should be one node.
Now we can combine the two queries to get the percentage of used CPU
Please type the expression that follows, and press the Execute button.
 1  sum(rate(
 2    node_cpu_seconds_total{
 3      mode!="idle",
 4      mode!="iowait",
 5      mode!~"^(?:guest.*)$"
 6    }[5m]
 7  )) /
 8  count(
 9    node_cpu_seconds_total{
10      mode="system"
11    }
12  )
We summarized the rate of used CPUs and divided it by the total number of CPUs. In my case (screenshot following), only three to four percent of CPU is currently used.
That is not a surprise since most of the system is at rest. Not much is going on in our cluster right now.

Now that we know how to fetch the percentage of used CPU of the whole cluster, we'll move our attention to applications.
We'll try to discover how many allocatable cores we have. From application's perspective, at least when they're running in Kubernetes, allocatable CPUs show how much can be requested for Pods. Allocatable CPU is always lower than total CPU.
Please type the expression that follows, and press the Execute button.
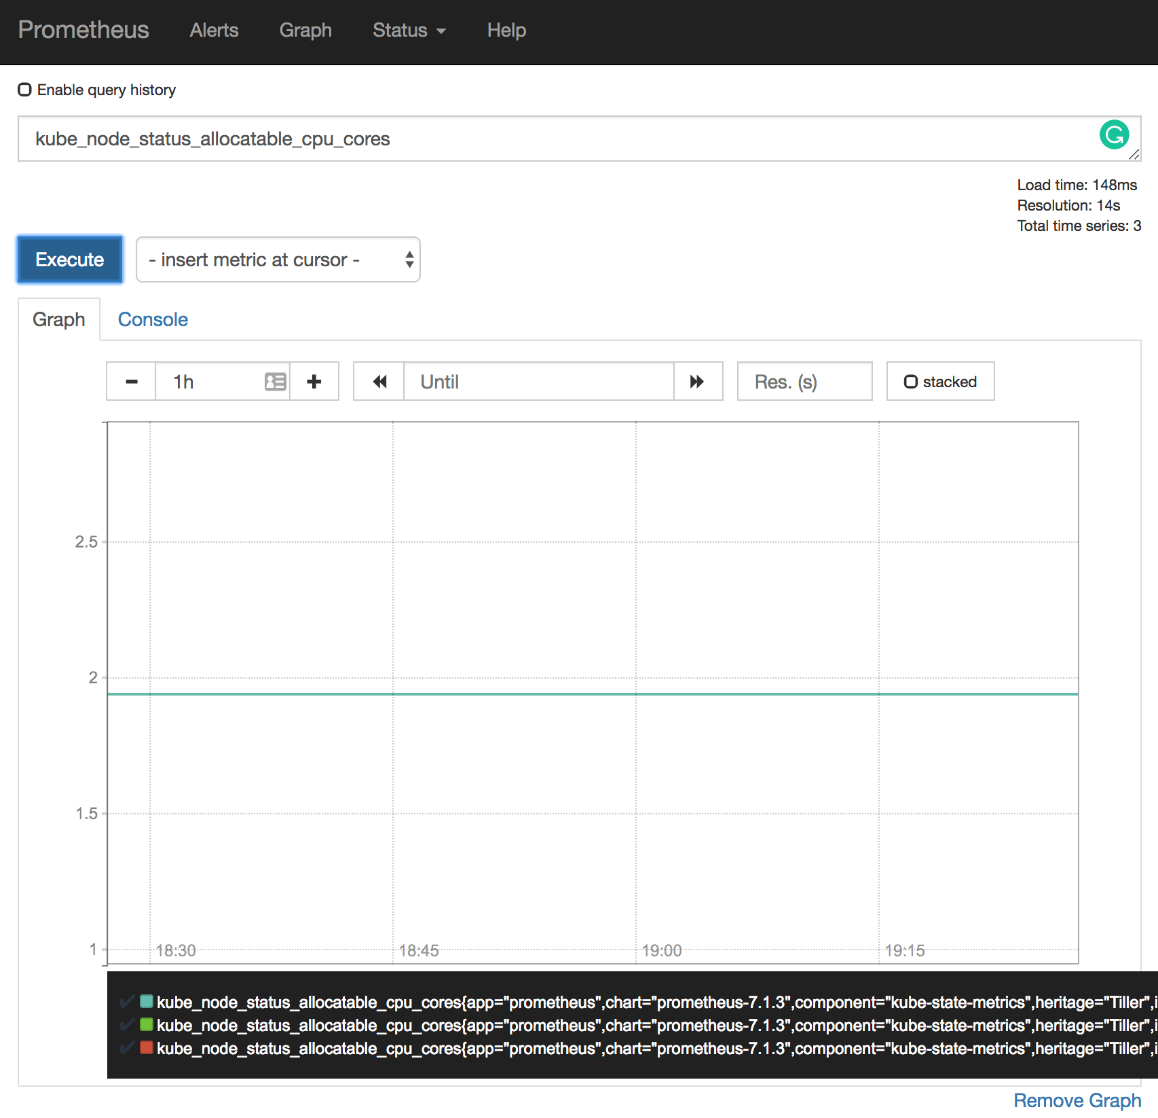
1 kube_node_status_allocatable_cpu_cores
The output should be lower than the number of cores used by our VMs. The allocatable cores show the amount of CPU that can be assigned containers. To be more precise, allocatable cores are the number of CPUs assigned to nodes minus those reserved by system-level processes. In my case (screenshot following), there are almost two full allocatable CPUs.
However, in this context, we are interested in the total amount of allocatable CPUs since we are trying to discover how much is used by our Pods inside the whole cluster. So, we'll sum the allocatable cores.
Please type the expression that follows, and press the Execute button.
 1  sum(
 2    kube_node_status_allocatable_cpu_cores
 3  )
In my case, the total allocatable CPUs is somewhere around 5.8 cores. For the exact number, please hover on the graph line.
Now that we know how many allocatable CPUs we have, we should try to discover how much was requested by Pods.
Please note that requested resources are not the same as used resources. We'll get to that use-case later. For now, we want to know how much we requested from the system.
Please type the expression that follows, and press the Execute button.
1 kube_pod_container_resource_requests_cpu_cores
We can see that requested CPU is relatively low. In my case, all the containers with requested CPU have their values below 0.15 (hundred and fifty milliseconds). Your result might differ.
Just as with allocatable CPU, we are interested in the sum of requested CPU. Later on, we'll be able to combine the two results and deduce how much is left unreserved in the cluster.
Please type the expression that follows, and press the Execute button.
 1  sum(
 2    kube_pod_container_resource_requests_cpu_cores
 3  )
We summed all the CPU resource requests. As a result, in my case (screenshot following), all the requested CPUs are slightly below 1.5.

Now, let's combine the two expressions and see the percentage of requested CPU.
Please type the expression that follows, and press the Execute button.
 1  sum(
 2    kube_pod_container_resource_requests_cpu_cores
 3  ) /
 4  sum(
 5    kube_node_status_allocatable_cpu_cores
 6  )
In my case, the output shows that around a quarter (0.25) of all allocatable CPU is reserved. That means that we could have four times as many CPU requests before we reach the need to expand the cluster. Of course, you already know that, if present, Cluster Autoscaler will add nodes before that happens. Still, knowing that we are close to reaching CPU limits is important. Cluster Autoscaler might not be working correctly, or it might not even be active. The latter case is true for most, if not all on-prem clusters.
Let's see whether we can convert the expressions we explored into alerts.
We'll explore yet another difference between a new set of Chart values and those we used before.
 1  diff mon/prom-values-latency2.yml
 2      mon/prom-values-cpu.yml
The output is as follows.
64c64
<   expr: sum(rate(nginx_ingress_controller_requests[5m])) by (ingress) / sum(label_join(kube_deployment_status_replicas, "ingress", ",", "deployment")) by (ingress) > 0.1
---
>   expr: sum(rate(nginx_ingress_controller_requests[5m])) by (ingress) / sum(label_join(kube_deployment_status_replicas, "ingress", ",", "deployment")) by (ingress) > 1
87a88,103
> - alert: NotEnoughCPU
>   expr: sum(rate(node_cpu_seconds_total{mode!="idle", mode!="iowait", mode!~"^(?:guest.*)$"}[5m])) / count(node_cpu_seconds_total{mode="system"}) > 0.9
>   for: 30m
>   labels:
>     severity: notify
>   annotations:
>     summary: There's not enough CPU
>     description: CPU usage of the cluster is above 90%
> - alert: TooMuchCPURequested
>   expr: sum(kube_pod_container_resource_requests_cpu_cores) / sum(kube_node_status_allocatable_cpu_cores) > 0.9
>   for: 30m
>   labels:
>     severity: notify
>   annotations:
>     summary: There's not enough allocatable CPU
>     description: More than 90% of allocatable CPU is requested
We can see from the differences that we restored the original threshold of TooManyRequests back to 1 and that we added two new alerts called NotEnoughCPU and TooMuchCPURequested.
The NotEnoughCPU alert will fire if more than ninety percent of CPU across the whole cluster is used for over thirty minutes. That way we'll avoid settings alarms if there is a temporary spike in CPU usage.
The TooMuchCPURequested also has the threshold of ninety percent and will be triggered if it persists for over thirty minutes. The expression computes the total amount of requested divided with the total among allocatable CPU.
Both alerts are reflections of the Prometheus expressions we executed short while ago, so you should already be familiar with their purpose.
Let's upgrade Prometheus' Chart with the new values and open the alerts screen.
 1  helm upgrade -i prometheus
 2    stable/prometheus
 3    --namespace metrics
 4    --version 7.1.3
 5    --set server.ingress.hosts={$PROM_ADDR}
 6    --set alertmanager.ingress.hosts={$AM_ADDR}
 7    -f mon/prom-values-cpu.yml
 8
 9  open "http://$PROM_ADDR/alerts"
All that's left is to wait until the two new alerts appear. If they are not already there, please refresh your screen.
There's probably no need to see the new alerts in action. By now, you should trust the flow, and there's no reason to believe that they would not trigger.

In the "real world" scenario, receiving one of the two alerts might provoke different reactions depending on the Kubernetes flavor we're using.
If we do have Cluster Autoscaler (CA), we might not need NotEnoughCPU and TooMuchCPURequested alerts. The fact that ninety percent of node CPUs is in use does not prevent the cluster from operating correctly, just as long as our CPU requests as set correctly. Similarly, having ninety percent of allocatable CPU reserved is also not an issue. If Kubernetes cannot schedule a new Pod due to all CPU being reserved, it will scale up the cluster. As a matter of fact, reaching almost full CPU usage or having nearly all allocatable CPU reserved is a good thing. That means that we are having as much CPU as we need and that we are not paying for unused resources. Still, that logic works mostly with Cloud providers and not even all of them. Today (October 2018), Cluster Autoscaler works only in AWS, GCE, and Azure.
All that does not mean that we should rely only on Cluster Autoscaler. It can malfunction, like anything else. However, since CA is based on watching for unschedulable Pods, if it does fail to work, we should detect that through observing Pod statuses, not CPU usage. Still, it might not be a bad idea to receive alerts when CPU usage is too high, but in that case, we might want to increase the threshold to a value closer to a hundred percent.
If our cluster is on-prem or, to be more precise, if it does not have Cluster Autoscaler, the alerts we explored are essential if our process for scaling up the cluster is not automated or if it's slow. The logic is simple. If we need more than a couple of minutes to add new nodes to the cluster, we cannot wait until Pods are unschedulable. That would be too late. Instead, we need to know that we are out of available capacity before the cluster becomes full (saturated) so that we have enough time to react by adding new nodes to the cluster.
Still, having a cluster that does not auto-scale because Cluster Autoscaler does not work is not an excuse good enough. There are plenty of other tools that we can use to automate our infrastructure. When we do manage to get to such a place that we can automatically add new nodes to the cluster, the destination of the alert should change. Instead of receiving notifications to Slack, we might want to send a request to a service that will execute the script that will result in a new node being added to the cluster. If our cluster is running on VMs, we can always add more through a script (or some tool).
The only real excuse to receive those notifications to Slack is if our cluster is running on bare-metal. In such a case, we cannot expect scripts to create new servers magically. For everyone else, Slack notifications when too much CPU is used or all allocated CPU is reserved should be only a temporary solution until proper automation is in place.
Now, let's try to accomplish similar goals but, this time, by measuring memory usage and reservations.
Measuring memory consumption is similar to CPU, and yet there are a few differences that we should take into account. But, before we get there, let's go back to the Prometheus' graph screen and explore our first memory-related metric.
1 open "http://$PROM_ADDR/graph"
Just as with CPU, first we need to find out how much memory each of our nodes has.
Please type the expression that follows, press the Execute button, and switch to the Graph tab.
1 node_memory_MemTotal_bytes
Your result is likely to be different than mine. In my case, each node has around 4 GB of RAM.
Knowing how much RAM each node has is of no use without knowing how much RAM is currently available. We can get that info through the node_memory_MemAvailable_bytes metric.
Please type the expression that follows, and press the Execute button.
1 node_memory_MemAvailable_bytes
We can see the available memory on each of the nodes of the cluster. In my case (screenshot following), each has around 3 GB of available RAM.

Now that we know how to get total and available memory from each of the nodes, we should combine the queries to get the percentage of the used memory of the whole cluster.
Please type the expression that follows, and press the Execute button.
 1  1 -
 2  sum(
 3    node_memory_MemAvailable_bytes
 4  ) /
 5  sum(
 6    node_memory_MemTotal_bytes
 7  )
Since we are searching for the percentage of used memory, and we have the metric with available memory, we started the expression with 1 - that will invert the result. The rest of the expression is a simple division of available and total memory. In my case (screenshot following), less than thirty percent of memory is used on each of the nodes.

Just as with CPU, available and total memory does not paint the whole picture. While that is useful information and a base for a potential alert, we also need to know how much memory is allocatable and how much of it is in use by Pods. We can get the first figure through the kube_node_status_allocatable_memory_bytes metric.
Please type the expression that follows, and press the Execute button.
1 kube_node_status_allocatable_memory_bytes
Depending on the Kubernetes flavor and the hosting provider you're using, there might be a very small, or a big discrepancy between the total and allocatable memory. I am running the cluster in AKS, and allocatable memory is a whole GB less than total memory. While the former is around 3 GB RAM, the latter was approximately 4 GB RAM. That's a big difference. I do not have full 4 GB for my Pods, but around one quarter less than that. The rest, around 1 GB RAM, is spent on system-level services. To make things worse, that's 1 GB RAM spent on each node which, in my case, results in 3 GB less in total since my cluster has three nodes. Given such a huge difference between the total and the allocatable amount of RAM, there is a clear benefit for having less number of bigger nodes. Still, not everyone needs big nodes and reducing their number to less than three might not be a good idea if we'd like to have our nodes spread in all the zones.
Now that we know how to retrieve the amount of allocatable memory, let's see how to get the amount of requested memory for each of the applications.
Please type the expression that follows, and press the Execute button.
1 kube_pod_container_resource_requests_memory_bytes
We can see that Prometheus (server) has the most requested memory (500 MB), with all the others being way below. Bear in mind that we are seeing only the Pods that do have reservations. Those without are not present in the results of that query. As you already know, it is OK not to define reservations and limits only in exceptional cases like, for example, for short-lived Pods used in CI/CD processes.

The previous expression returned the amount of memory used by each Pod. However, our mission is to discover how much requested memory we have in the system as a whole.
Please type the expression that follows, and press the Execute button.
 1  sum(
 2    kube_pod_container_resource_requests_memory_bytes
 3  )
In my case, the total amount of requested memory is around 1.6 GB RAM.
All that's left is to divide the total requested memory with the amount of all the allocatable memory in the cluster.
Please type the expression that follows, and press the Execute button.
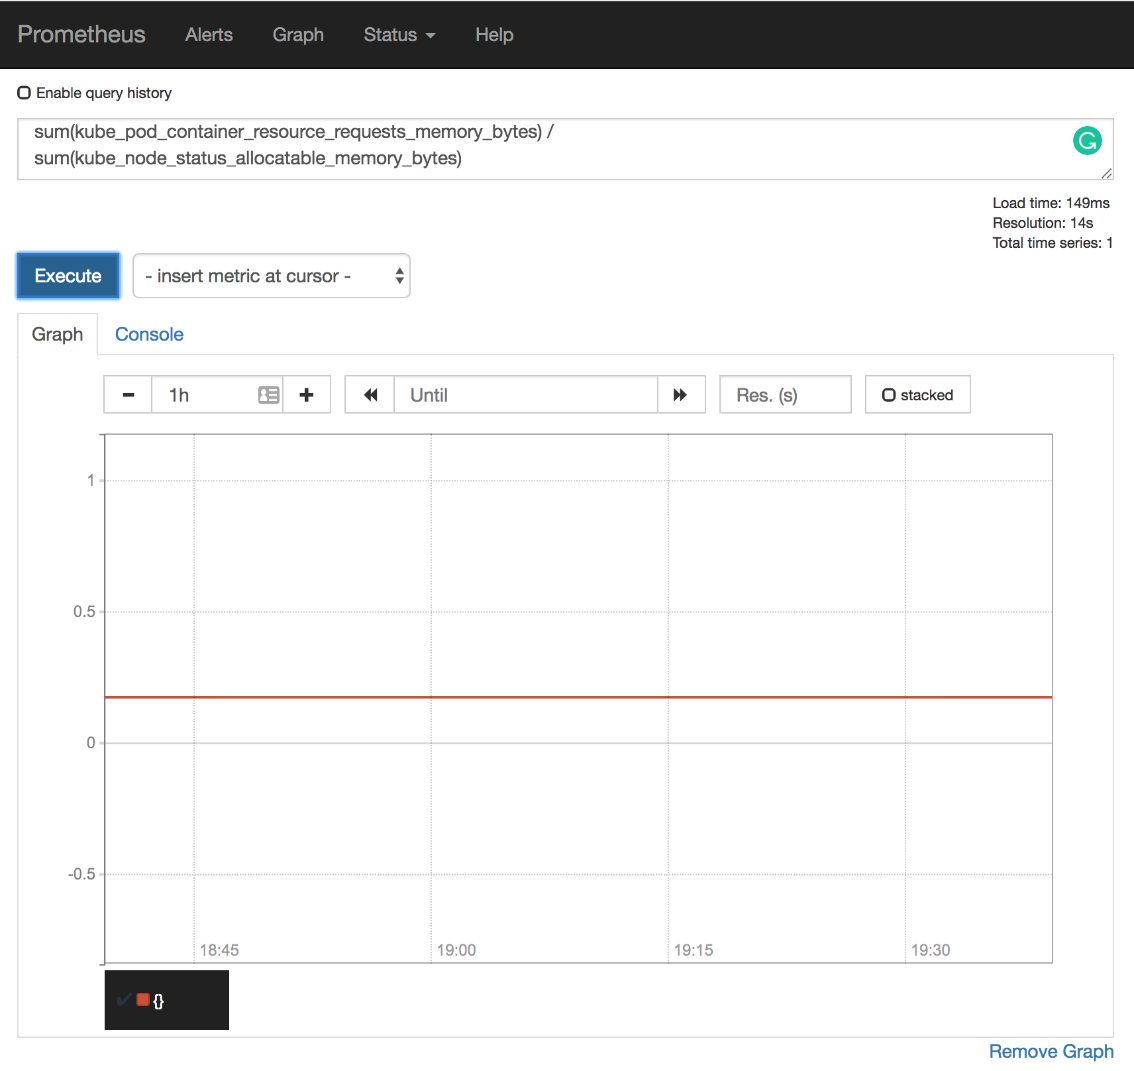
 1  sum(
 2    kube_pod_container_resource_requests_memory_bytes
 3  ) /
 4  sum(
 5    kube_node_status_allocatable_memory_bytes
 6  )
In my case (screenshot following), the total of the requested memory is around twenty percent (0.2) of the cluster's allocatable RAM. I am far from being in any type of danger, nor there is a need to scale up the cluster. If anything, I have too much unused memory and might want to scale down. However, we are at the moment only concerned with scaling up. Later we'll explore alerts that might result in scaling down.
Let's take a look at the differences between the old Chart's values and those we are about to use.
 1  diff mon/prom-values-cpu.yml
 2      mon/prom-values-memory.yml
The output is as follows.
103a104,119
> - alert: NotEnoughMemory
>   expr: 1 - sum(node_memory_MemAvailable_bytes) / sum(node_memory_MemTotal_bytes) > 0.9
>   for: 30m
>   labels:
>     severity: notify
>   annotations:
>     summary: There's not enough memory
>     description: Memory usage of the cluster is above 90%
> - alert: TooMuchMemoryRequested
>   expr: sum(kube_pod_container_resource_requests_memory_bytes) / sum(kube_node_status_allocatable_memory_bytes) > 0.9
>   for: 30m
>   labels:
>     severity: notify
>   annotations:
>     summary: There's not enough allocatable memory
>     description: More than 90% of allocatable memory is requested
We added two new alerts (NotEnoughMemory and TooMuchMemoryRequested). The definitions themselves should be straightforward since we already created quite a few alerts. The expressions are the same as the ones we used in Prometheus graph screen, with the addition of the greater than ninety percent (> 0.9) threshold. So, we'll skip further explanation.
We'll upgrade our Prometheus Chart with the new values, and open the alerts screen to confirm that they
 1  helm upgrade -i prometheus
 2    stable/prometheus
 3    --namespace metrics
 4    --version 7.1.3
 5    --set server.ingress.hosts={$PROM_ADDR}
 6    --set alertmanager.ingress.hosts={$AM_ADDR}
 7    -f mon/prom-values-memory.yml
 8
 9  open "http://$PROM_ADDR/alerts"
If the alerts NotEnoughMemory and TooMuchMemoryRequested are not yet available, please wait a few moments, and refresh the screen.

The actions based on the memory-based alerts we created so far should be similar to those we discussed with CPU. We can use them to decide whether and when to scale up our cluster, either through manual actions or through automated scripts. Just as before, if we do have our cluster hosted with one of the vendors supported by the Cluster Autoscaler (CA), those alerts should be purely informative, while on-prem or with unsupported Cloud providers, they are much more than simple notifications. They are an indication that we are about to run out of capacity, at least when memory is concerned.
The CPU and memory examples are all focused on the need to know when is the right time to scale our cluster. We might create similar alerts that would notify us when the usage of CPU or memory is too low. That would give us a clear indication that we have too many nodes in the cluster and that we might want to remove some. That, again, assumes that we do not have Cluster Autoscaler up-and-running. Still, taking only CPU or only memory into account for scaling-down is too risky and can lead to unexpected results.
Let's imagine that only twelve percent of allocatable CPU is reserved and that we have three worker nodes in the cluster. Such a low CPU usage surely does not warrant that many nodes since on average, each has a relatively small amount of reserved CPU. As a result, we can choose to scale down, and we remove one of the nodes thus allowing other clusters to reuse it. Was that a good thing to do? Well, it depends on other resources. If the percentage of memory reservations was low as well, removing a node was a good idea. On the other hand, if the reserved memory were over sixty-six percent, removal of a node would result in insufficient resources. When we removed one of the three nodes, over sixty-six percent of reserved memory across three nodes becomes over one hundred percent on two nodes.
All in all, if we are to receive notifications that our cluster is in need to scale down (and we do NOT have Cluster Autoscaler), we need to combine memory and CPU, and probably a few other metrics as alert thresholds. Fortunately, the expressions are very similar to those we used before. We just need to combine them into a single alert and change the thresholds.
As a reminder, the expressions we used before are as follows (there's no need to re-run them).
 1  sum(rate(
 2    node_cpu_seconds_total{
 3      mode!="idle",
 4      mode!="iowait",
 5      mode!~"^(?:guest.*)$"
 6    }[5m]
 7  ))
 8  by (instance) /
 9  count(
10    node_cpu_seconds_total{
11      mode="system"
12    }
13  )
14  by (instance)
15
16  1 -
17  sum(
18    node_memory_MemAvailable_bytes
19  )
20  by (instance) /
21  sum(
22    node_memory_MemTotal_bytes
23  )
24  by (instance)
Now, let's compare yet another update of the Chart's values with those we're using right now.
 1  diff mon/prom-values-memory.yml
 2      mon/prom-values-cpu-memory.yml
The output is as follows.
119a120,127
> - alert: TooMuchCPUAndMemory
>   expr: (sum(rate(node_cpu_seconds_total{mode!="idle", mode!="iowait", mode!~"^(?:guest.*)$"}[5m])) by (instance) / count(node_cpu_seconds_total{mode="system"}) by (instance)) < 0.5 and (1 - sum(node_memory_MemAvailable_bytes) by (instance) / sum(node_memory_MemTotal_bytes) by (instance)) < 0.5
>   for: 30m
>   labels:
>     severity: notify
>   annotations:
>     summary: Too much unused CPU and memory
>     description: Less than 50% of CPU and 50% of memory is used on at least one node
We're adding a new alert called TooMuchCPUAndMemory. It is a combination of the previous two alerts. It will fire only if both CPU and memory usage are below fifty percent. That way we'll avoid sending false positives and we will not be tempted to de-scale the cluster only because one of the resource reservations (CPU or memory) is too low, while the other might be high.
All that's left, before we move into the next subject (or metric type), is to upgrade Prometheus' Chart and confirm that the new alert is indeed operational.
 1  helm upgrade -i prometheus
 2    stable/prometheus
 3    --namespace metrics
 4    --version 7.1.3
 5    --set server.ingress.hosts={$PROM_ADDR}
 6    --set alertmanager.ingress.hosts={$AM_ADDR}
 7    -f mon/prom-values-cpu-memory.yml
 8
 9  open "http://$PROM_ADDR/alerts"
Please refresh the alerts screen if the alert is still not present. In my case (screenshot following), the total of reserved memory and CPU is below fifty percent, and the alert is in the pending state. In your case, that might not be true, and the alert might not have reached its thresholds. Nevertheless, I'll continue explaining my case, where both CPU and memory usage is less than fifty percent of total available.
Thirty minutes later (for: 30m), the alert fired. It waited for a while (30m) to confirm that the drop in memory and CPU usage is not temporary. Given that I'm running my cluster in AKS, Cluster Autoscaler would remove one of the nodes long before thirty minutes. But, since it is configured to operate with a minimum of three nodes, CA will not perform that action. As a result, I might need to reconsider whether paying for three nodes is a worthwhile investment. If, on the other hand, my cluster would be without Cluster Autoscaler, and assuming that I do not want to waste resources while other clusters might need more, I would need to remove one of the nodes (manually or automatically). If that removal were automatic, the destination would not be Slack, but the API of the tool in charge of removing nodes.

Now that we have a few examples of saturation, we covered each of the metrics championed by Google Site Reliability Engineers and almost any other monitoring method. Still, we're not done. There are a few other metrics and alerts I'd like to explore. They might not fall into any of the discussed categories, yet they might prove to be very useful.