CHAPTER SIX
PRODUCT AND SERVICE FIT
At any level—from regional office to division to enterprise—a company’s most visible aspects to its customers and the rest of the outside world are its products and services. It’s not surprising that most companies define themselves this way: “We are a car company,” managers say, introducing their firms. “We are a phone company.” “We sell accounting services.” Even companies that migrate to other businesses in a coherent manner still retain their original identity: IBM and Apple are still referred to as “computer makers,” and Disney as a “cartoon company,” even though all three companies do so much more with the same capabilities system.
Internally, product and service categories are even more closely tied to a company’s identity. Companies count their revenues and costs accordingly, thereby reinforcing the roster of products and services as the company’s organizational spine. This is a natural thing to do, but it has unfortunate side effects. Instead of differentiating you, it sets you up with the same structure as just about every other company in your industry. It amplifies the incoherence penalty, with its costs and inefficiencies. It makes it more difficult to align your products and services with your capabilities system, and it adds pervasive pressure to design your strategy to fit your existing portfolio. Finally, it makes your business more risky—if the market changes for your flagship products, where do you go?
If instead you define your company by its way to play and capabilities system, it will be much easier to differentiate yourself, gain the coherence premium, and adapt to market changes without a blow to your identity. Doing this, however, means a shift in perspective about your products and services. Now, their value potential depends primarily on their relevance to your strategy instead of the other way around. You judge your lineup of products and services based not so much on their individual potential, but on coherence: on their strategic fit with your capabilities system and way to play.
Unfortunately, many companies don’t pay much attention to the coherence of the business—or the impact that their lineup of products and services can have on it. In many companies, the idea of fit is associated with being in the same sector. Two automobiles, or two food products, are automatically assumed to fit together naturally, whether or not they depend on similar capabilities systems. This view leads many companies to expand to adjacencies: products and services that seem related, but that may require very different capabilities to win. (In chapter 7, we’ll go into more detail on the adjacency trap.) That’s why we typically advise executives to form a very clear idea of their way to play and capabilities system before making decisions about products and services—and to line up products and services, not with one another, but with the firm’s overall strategy.
When products and services do not fit into your way to play or capabilities system, you can end up with immense costs and inefficiencies. These often arise when you try to make the most of a constrained investment pool, spreading it around on too many offerings. Somewhere out there, you may have a competitor that is more coherent than you, investing in fewer capabilities to support a better-fitting lineup of products and services—and therefore beating you in the market, time and time again. You have probably seen this happen already in some parts of your business. And while these businesses pay the cost of failure, the largest price of this incoherence is paid by the parts of the businesses that do fit, but that do not get the investment and attention they require.
Frankly, if you can’t find a way to align some of your products and services with your capabilities system and way to play, then maybe you shouldn’t be in those businesses. Maybe you should divest them, and in the process release short-term capital to reinvest in the more coherent parts of your company.
In this chapter, we present the practice of portfolio analysis from a coherence perspective. At the enterprise level, the word “portfolio” typically means the lineup of businesses and business units, but within individual businesses, we also mean your specific lineup of products and services. It can also mean the portfolio of R&D projects or line extensions that you are considering. All of these have the potential to increase either coherence or incoherence, depending on the choices you make.
Listerine PocketPaks: When Terrific Products Don’t Fit
The story of the rise and fall of Listerine PocketPaks shows how a breakthrough product or service can fail if the right way to play and capabilities system aren’t there to support it. As we saw in chapter 1, the leaders of Pfizer Consumer Healthcare (PCH), which owned Listerine, navigated nearly every product and service decision they made in favor of coherence. They primarily favored products that fit their capabilities system and could deliver on health-related claims. One of their few missteps was the Listerine PocketPak, rolled out in the early 2000s.
PocketPaks were the first breath-freshening dissolvable film strips produced in the United States. Adapted from a Japanese product, they are edible, paper-thin strips that melt on the tongue and deliver a dose of flavor. Listerine’s mouthwash-releasing “breath strips,” as they were called, were a runaway hit with a blockbuster brand, genuine appeal, and an immediate business success story. As the first to market, Pfizer enjoyed a first-mover bonanza, with $160 million in sales in the product’s first full year.1Time magazine hailed PocketPaks as one of the breakthrough inventions of 2002.2
The PCH managers saw the product as a natural fit: an extension of their Listerine mouthwash brand. They tried to apply their company’s differentiating capabilities, such as claims-based marketing. But a health-benefits-based marketing approach conferred no major advantage to a product that was, in the end, a confection. It needed to be sold in the racks near the cashier, alongside gums and candies, and it relied on constant flavor innovation to maintain its popularity.
Thus, Pfizer’s commanding market position proved brief. By 2004, competitors had introduced more than a dozen new breath-strip brands. The most prominent rival was Eclipse Flash Strips, produced by the Wrigley gum company. This was the first nongum product in Wrigley’s 113-year history; the company was attracted to this business in part because breath-strip popularity was cutting into sugar-free gum sales. Its Eclipse brand put out four flavors—cinnamon, peppermint, wintergreen, and spearmint—before Listerine could get its second flavor to the shelf. Eclipse rapidly overtook Listerine to become the number one breath strip on the market.3
As a chewing gum company, Wrigley had a confectionary-oriented capabilities system that Pfizer lacked; this system included expertise in capturing space on the candy racks and rapid-cycle flavor innovation. That was enough to prevail, despite the first mover’s early and overwhelming lead, and despite the enormous asset of the Listerine brand.
Ironically, dissolvable strips may ultimately prove to fit better with a claims-oriented capabilities system like Listerine’s, after all—but for a different group of products. The strips are resurfacing today as vehicles for delivering medicine, especially for animals and children who find it hard to swallow pills.4
You may have your own similar products or services—offerings too innovative or cherished to give up, but not at all aligned to your capabilities system. You may not be able to make them belong. What do you do? Work your way methodically through each of your products and services. Test them to see if you are equipped to take them to the customer in a way that gives you a meaningful and sustainable right to win. And decide their fate accordingly.
The Capabilities-Driven Portfolio
For the company seeking coherence, conventional portfolio decision tools can be misleading. The growth-share portfolio management matrix, developed by the Boston Consulting Group in the 1960s, made it easy for corporate strategists to categorize each business, product, or service according to its market share (indicating position relative to the competition) and market growth (indicating changes in the number of customers for the overall category). The most attractive quadrant, labeled “stars,” has the highest growth and highest share. These are the primary candidates for investment. Other businesses with high market share, the “cows,” are kept and milked, while the slow-growth, low-share “dogs” are relegated to be sold or abandoned. This was extremely valuable when market growth and market share were distinctive attributes and predictive in themselves of success. Since then, many other portfolio frameworks have been developed, mostly focusing on financial metrics—which is understandable, given the continuous need for short-term performance results.5
But today, it can be dangerous to base portfolio decisions primarily on growth, market share, or other short-term financial metrics, especially if you don’t take coherence and capabilities into account. Invest in that “star” product line that has been growing for two years at 19 percent per annum? You may be better off passing on it in favor of a “dog” that’s growing at 3 percent a year, if the slower-growing business is coherent with your way to play and your capabilities system.6 The problem is the metrics, which often provide misleading valuations. They don’t take into account, for example, what the “star” might be worth to your company if you sold it to another company with a better-matched capabilities system, or the hidden costs of continued investment in an incoherent product or service line.
Nor do the metrics show what value could be created if the “dogs” received the support they need, and could make use of your differentiating capabilities. This in fact has been an ongoing, much-noted problem with most forms of the growth-share matrix. Critics of those matrices, writes strategy historian Walter Kiechel, have “especially delighted in examples of low-share, low-growth businesses that, when taken under new management, ended up being gratifyingly profitable.”7 This hidden potential value is generally not manifest in market share, which is a lagging indicator, at best, of coherence.
Even more advanced forms of financial valuation don’t include the value of future coherence. They implicitly assume that a company’s coherence will stay the same, reflecting whatever way to play and capabilities are in place currently, no matter what plans for change exist. These forms of valuation don’t challenge the current business model or show how a business might perform with greater coherence. They also reveal very little about the potential incoherence penalty of the enterprise: the costs and distractions that stem from not focusing on a single way to play with one capabilities system. Moreover, they do not consider alternatives; they do not drive managers to ask how much a business or product line would be worth if it were sold to another company that could apply a more coherent model to it.
Many companies have begun to recognize this and now include a “fitness” metric now in their portfolio analysis. This is a good first step, but the prevailing definitions of “fit” still tend to be misleading. Most of them have to do with adjacency: whether the products or services reside within the same sector. In other words, businesses are judged according to whether they fit the definition of “what we sell,” rather than “what sets us apart.” Moreover, the question of strategic fit is typically raised at the end of a strategic planning process, when the team has already come to its conclusions about performance and is beginning to act on them. At such times, the temptation to force-fit the answer that people want to hear is hard to resist.
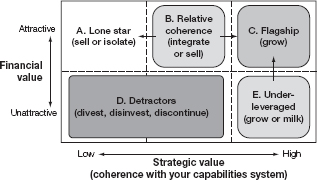
It’s better to analyze your product and service fit earlier in any planning process. We recommend the portfolio analysis shown in figure 6-1. Use it to judge your potential market value more effectively, to proactively create portfolio value instead of merely balancing the components you have, and to bring your enterprise into greater alignment. It can also be used to evaluate acquisition opportunities (see chapter 8).
In this figure, y-axis (value) represents a forward-looking assessment of a product, service, or business unit. You can use enterprise value or equity value (subtracting net debt from enterprise value) for this purpose, deriving them from estimated future profits (net of capital costs) or future cash flow. (All of these metrics assume no change in the underlying coherence of the business.)
To assess coherence on the x-axis, quantify the extent to which your capabilities system is used as a differentiator for each of the businesses, as we did in chapter 2. Or you may bring a group of senior leaders together and consider each of the businesses in turn.
FIGURE 6-1
A portfolio matrix for gaining coherence
Source: Strategy&.
Your businesses will fall into five groups:
A. These “lone stars,” with low coherence but high financial value, are clearly worth a great deal—but may be worth more to another company than to you. There’s an incoherence penalty for keeping them, because they require investment unrelated to the rest of your portfolio. Look for opportunities to monetize them. Build them up to sell them at the appropriate time (as Pfizer did with PCH), rethink your way to play so that you can include them, or treat them as a stand-alone small business (as Procter & Gamble does with Pringles potato chips). By moving early, you can sell at a propitious time, when there are more alternatives and when you have a prospect generally recognized as valuable, rather than after the business has begun to lose value when a stronger, disruptive competitor has emerged.
B. These businesses have relative coherence: they outperform the competition, but they are only partly aligned to your way to play and capabilities system. Hang on to these businesses and invest in them, if all three of the following conditions are true: (1) you expect them to keep outperforming competitors, because the capabilities system they deploy will continue to be relevant to customers; (2) the capabilities system that supports them overlaps with the differentiated capabilities—not the table stakes—of your primary business; and (3) when you look into monetizing them, the potential sale price is unattractive. Otherwise, divest. If you keep these businesses, you’ll have to watch them carefully; the world may shift and their relative advantage may rapidly disappear.
C. This group contains your most promising endeavors—the “flagship” businesses with high coherence and high financial value. They are already your stars—or should be. As we’ll see in chapter 7, you may create ways to accentuate their growth and flagship business status.
D. The detractors are businesses with low financial value and low coherence that drag your company down and constitute a major source of the incoherence penalty. Your first concern is to stop them from hemorrhaging cash. Next, figure out why they are doing so poorly. You may end up selling them at a reasonable price, isolating them from the rest of your enterprise while optimizing their performance for cash, or discontinuing them if necessary. Like the businesses in group A, they may be worth more to others; look for likely buyers that can create more value than your capabilities system allows.
E. With high coherence but low financial value, these businesses may well be among the “dogs” of a conventional analysis. But they also represent your most underleveraged (and underappreciated) opportunities. Will additional investment in these businesses, or greater linkage to your capabilities system, propel them to earn a right to win? If so, and if you are prepared to invest in them more heavily, move them into the C group. If not, milk them—either for cash or for the support they offer your capabilities system and other businesses—until they are ready to be sold or shut down.
Whether these are business units, products, services, or other parts of your portfolio, the same general principle applies: they are always better served when aligned to your chosen capabilities system. With that principle in mind, you can work your way methodically through the list, deciding how each item fits—and where it is best suited to thrive. (You can also apply similar logic to potential acquisitions, as we’ll see in chapter 8.)
Rethinking the Portfolio at Ahlstrom
The Ahlstrom company is a good example of a company that reevaluated its products and services in line with coherence and is reaping the benefits. Founded in 1851, Ahlstrom is a $1.6 billion Finnish manufacturer of fiber-based rolled goods, including composites and specialty papers. Its materials are used around the world to make a wide variety of products: turbine blades, boat hulls, masking tape, filters, baby wipes, medical gowns, teabags, sausage casing, wine labels, milk carton paper, building materials, and disposable hygiene products among them. Like many business-to-business companies, Ahlstrom was deeply affected by the economic downturn of 2008–2009. Even in its earliest stages, the downturn was significant enough that CEO Jan Lång, with the approval of the board, initiated an exercise in 2009 to rethink the company’s corporate strategy and portfolio of businesses.
The problem, as Lång saw it, was that Ahlstrom hadn’t clearly settled on “the reason for being one company”: the logic that held the firm together as one group. It had a large and complex line of businesses, built partly through acquisition and spanning a variety of industries, products, technologies, and organizational structures. It was also a highly innovative company; almost half of its net sales in 2009 were generated by new or improved products. But while some product lines were highly profitable or first in market share in their categories, others were struggling. To avoid ongoing losses, the company needed to focus on the businesses that had the most potential within its portfolio and use that to improve operations, and perhaps add other businesses that would make more strategic sense.
To evaluate dozens of product lines, the Ahlstrom executives first defined twenty product groups that made up distinctive businesses and reflected the way their products were used. They then surveyed several hundred customers in fifty countries about the purchasing criteria that had led each customer to select a particular supplier. The survey responses directly or indirectly indicated the capabilities most relevant to each broad product group. The analysis also confirmed what some members of the management team already suspected: some capabilities, such as basic product quality and delivery competence, were merely table stakes. Every supplier had mastered them. Other factors were more distinctive: innovation, technical support, and price; customers made choices most frequently based on these.
In the conversations that followed, Lång and the executive team concluded that their company naturally divided into two categories of business, each with its own capabilities system and way to play. They went down their list of products and services, dividing them into two groups. The first group—including glass-fiber tissue; vegetable parchment; industrial, medical, and food nonwovens; and more—was called “value-added businesses.” These were businesses where the technical-support capability was given a strong focus; Ahlstrom’s staff typically learned the ins and outs of the customers’ production processes and could thus offer those customers specifically tailored assistance for improving their products. These businesses had often built strong relationships with customers in precisely that way. They were tagged for growth and expansion, including possible small acquisitions.
The second group—which included abrasive and coated papers, air filtration, and pre-impregnated décor papers (for the production of laminates)—had not performed as consistently well, but its businesses shared a viable way to play as value players. Here, technical support was rarely needed or requested; price was the primary consideration for most purchasers. These businesses would henceforth focus on improving operational excellence so they could offer more price-competitive products, and on innovating for cost improvement and simplifying the value chain, while the company would allocate most of its growth-oriented investment to the capabilities system of the value-added group.
This was not just another restructuring exercise. With the full executive team involved, Ahlstrom had in effect simplified its line of products into two groups, roughly equivalent to “flagship” and “relative coherence,” according to their respective ways to play. Now, all decisions around investment, capability development, and organizational design could be made more simply, with a clear underlying rationale. Since the new strategy was announced, Ahlstrom has designed a new operating model that supports the roles of the two different business clusters and enables corporate functions, including sales and marketing and product and technology development, to more efficiently serve and strengthen the individual businesses. Moreover, a series of growth initiatives is being launched in the value-added businesses. The company is also reorganizing its supply chain and innovation functions to support this group: specifically, to improve product performance and conversion processes for its customers.
As this story shows, a clear look at your product and service lineup can lead to substantial movement toward coherence. Conversely, sooner or later, any company moving toward coherence will reach a similar point of choice about its lineup. The clearer your way to play and the better developed your capabilities system, the easier your task will be.
The Divested Star
One critical part of your capabilities-driven strategy will be selling or streamlining the businesses that do not fit well with your capabilities system and way to play. Selling has several advantages: it removes a distraction, improves the ability of the remaining enterprise to create value, and puts the divested business into a better environment, where it is more likely to thrive. The more value you create from divestiture, the more effectively you can invest in the capabilities that are important to your strategy.
You may be challenged by the notion of selling profitable businesses. Is it really appropriate to get rid of your lone stars, especially since they are reasonably good performers? Although they are probably better off elsewhere, it is very difficult to act on that awareness. A chemical company we know of, for example, owns one disjointed food business through an acquisition. As a small enterprise with a best-selling condiment, this food maker has just enough capabilities to keep the business on track. Its competition is equally ill equipped to move the category forward, and therefore, this food product is financially successful enough that the company keeps reinvesting in it. But in their thoughtful moments, the business leaders are the first to admit that they don’t really know how to grow that business into its full potential. Such businesses may be stars, but they are also often deceptively inefficient; they require hidden resources disproportionate to their size and influence, simply because they don’t fit with the capabilities needed for other businesses.
We don’t care how big or powerful a company may be; it can’t do everything. There will always be choices and trade-offs: every business wants to expand its share, each function seeks to build its own world-class capabilities system, and every product or service may be seen as important. But without enough coherence, the decisions about which offerings to support become random, rather than connected to a common strategy. A true capabilities-driven strategy will help you and others throughout your company make those hard decisions in a much easier way.