
APPENDIX A
Growth of the India Way
THE GROWTH RATE OF THE Indian economy has far outstripped that of the United States in recent years. The American GDP in 2008 stood at 1.64 times its size in 1990, while the Indian GDP had increased over that same eighteen-year period by a factor of 3.02 (see figure A-1). The disparity in growth rates is likely to increase even further. At the writing of this book, the U.S. economy was in the grip of the worst recession since the Great Depression, with negative GDP growth forecast for much of 2009. Though India’s growth was expected to slow as well, forecasts still anticipated Indian GDP expansion in 2009 of better than 5 percent.1
While the Indian economy has been growing at a considerably higher rate than that of the United States, foreign investment, both coming into and going out of India, has been surging even more rapidly. As seen in figure A-2, annual foreign direct investment—the placement of capital in an enterprise based in India—rose from $100 million in 1990 to $21.8 billion in 2007. At the same time, annual Indian direct investment abroad rose from $2.5 million in 1990 to $13 billion in 2007.
Gross domestic product in constant domestic currency, U.S. and India, 1990–2008
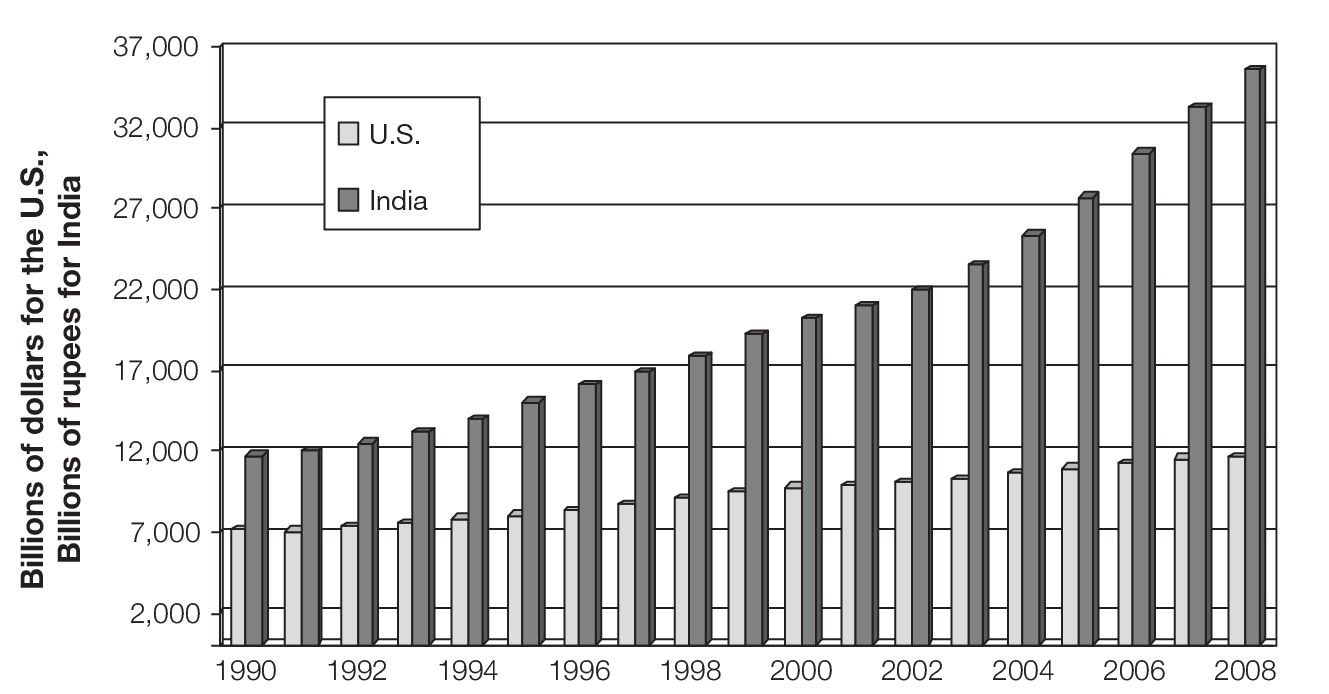
Source: International Monetary Fund, World Economic Outlook Database, April 2009.
Indian foreign direct investment inflows and outflows, 1990–2007
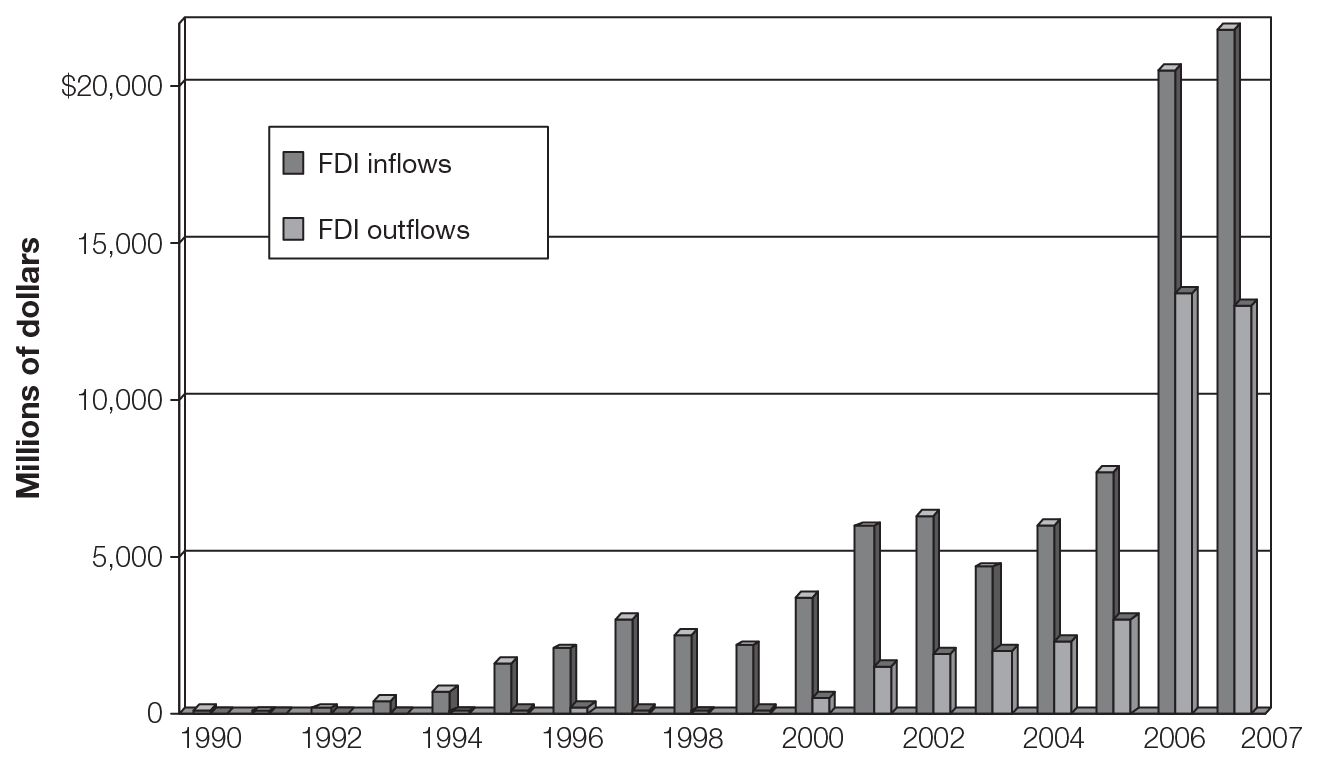
Source: Euromonitor International, Global Market Information Database, August 2009.
Mergers and acquisitions by foreign companies in India—and by Indian companies abroad—displayed comparable growth, as shown in figure A-3. In 1990, Indian companies deployed $2 million in merging with or acquiring companies abroad, but by 2008 that number had reached $12.3 billion. In 1991, foreign companies had spent less than $1 million in merging with or acquiring Indian enterprises, but by 2008 that number had grown to $6.4 billion.
Other trend lines displayed much the same upward slope. As shown in figure A-4, private equity investing in India rose from under $1 billion annually in the early part of the 2000s to $14 billion in 2007. Inflation was under control, and the surging real growth was pulling tens of millions out of poverty, as seen in figure A-5. While the Indian population has more than doubled since the 1960s, the GDP has risen eightfold over the same period. GDP per capita, adjusted with year 2000 U.S. dollars, rose from $181 in 1960 to $686 in 2007, as displayed in figure A-6.
FIGURE A-3 Indian transnational mergers and acquisitions, 1990–2008
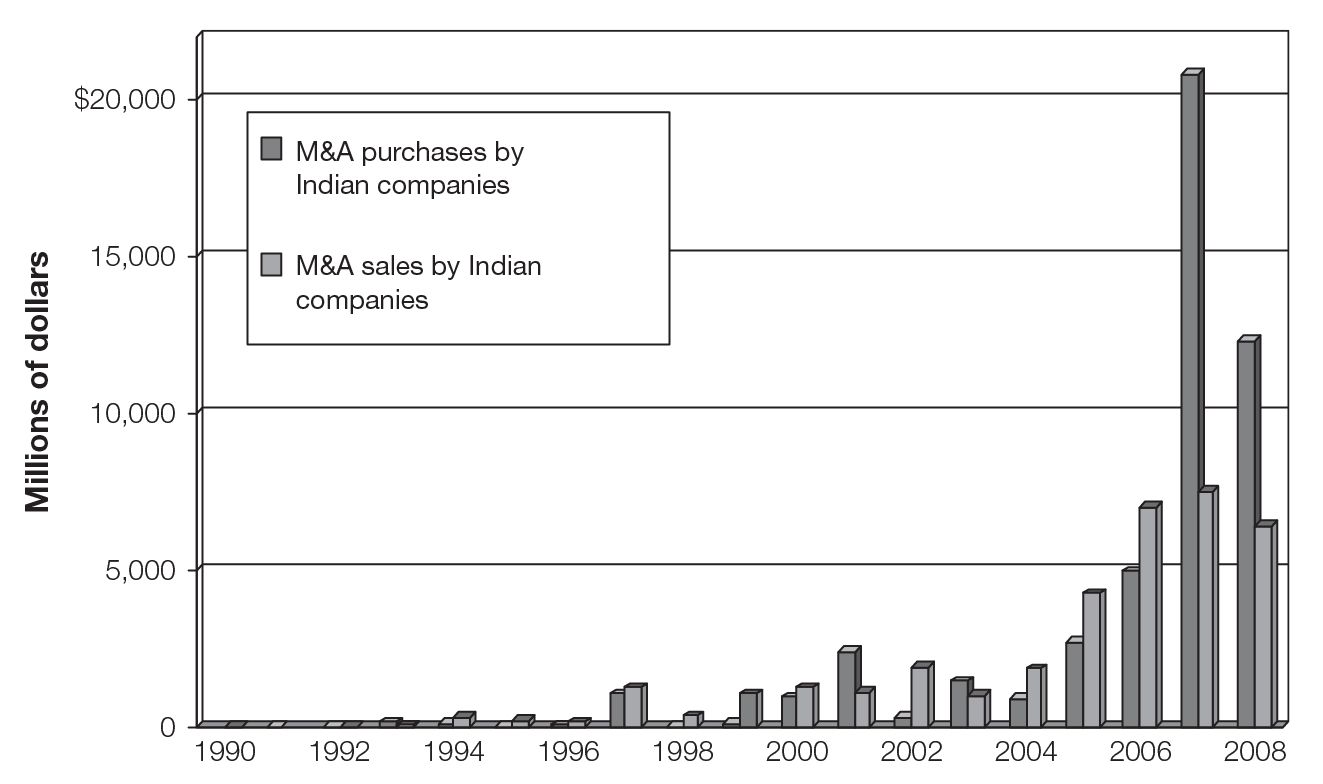
Source: Euromonitor International, Global Market Information Database, August 2009.
Private equity investment in India, 2000–2007
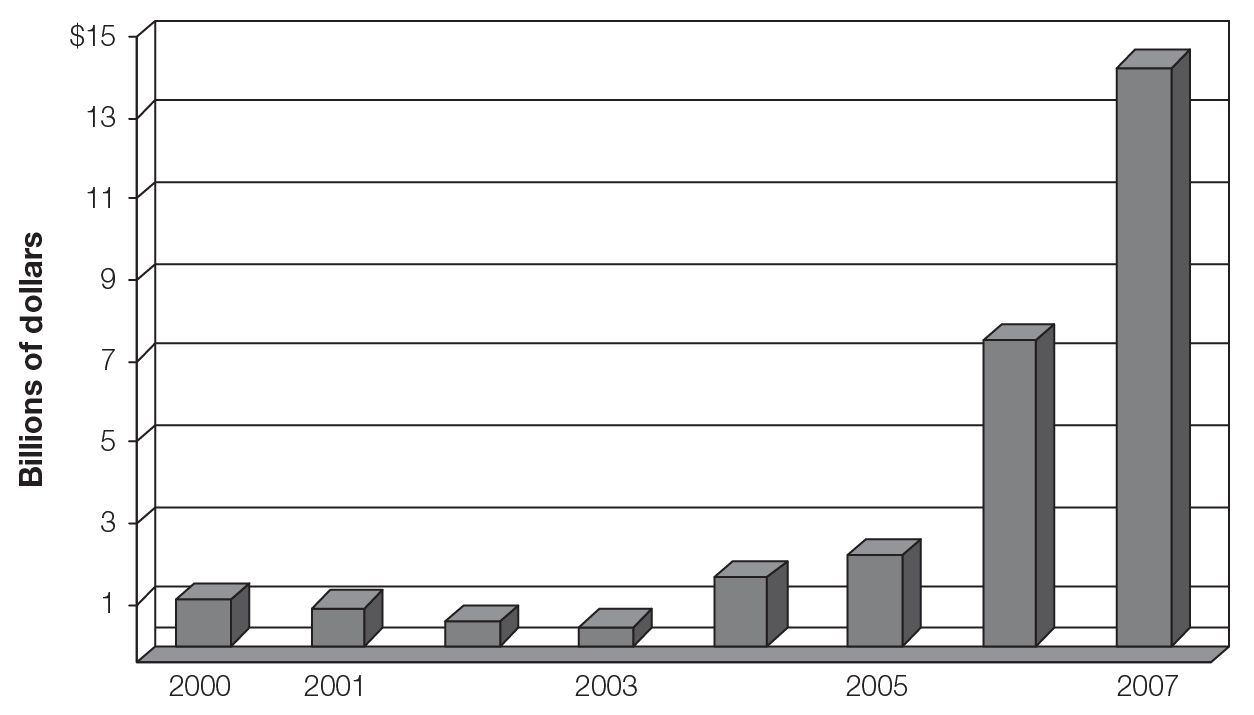
Source: India Venture Capital Association, 2008.
Poverty rate in India, 1974–2007
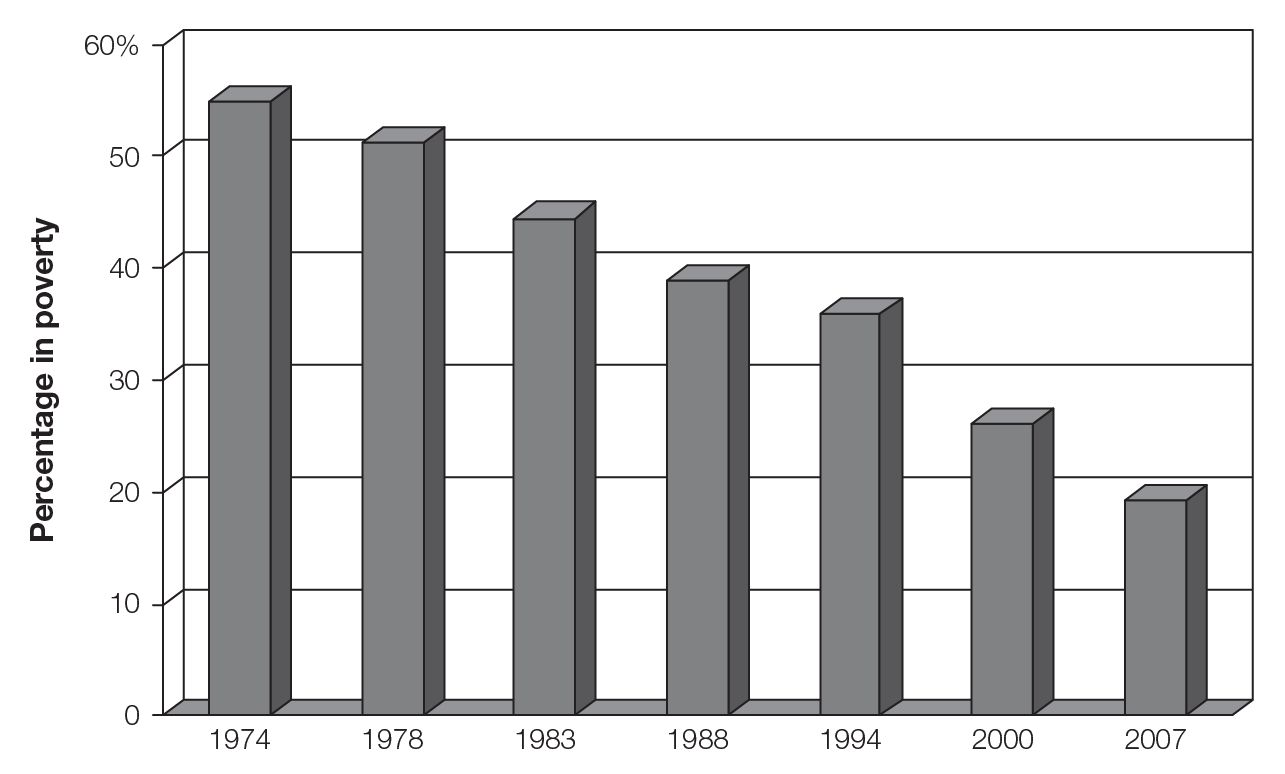
Source: Central Statistical Organization, Government of India, 2009.
GDP per capita in India, 1960–2008
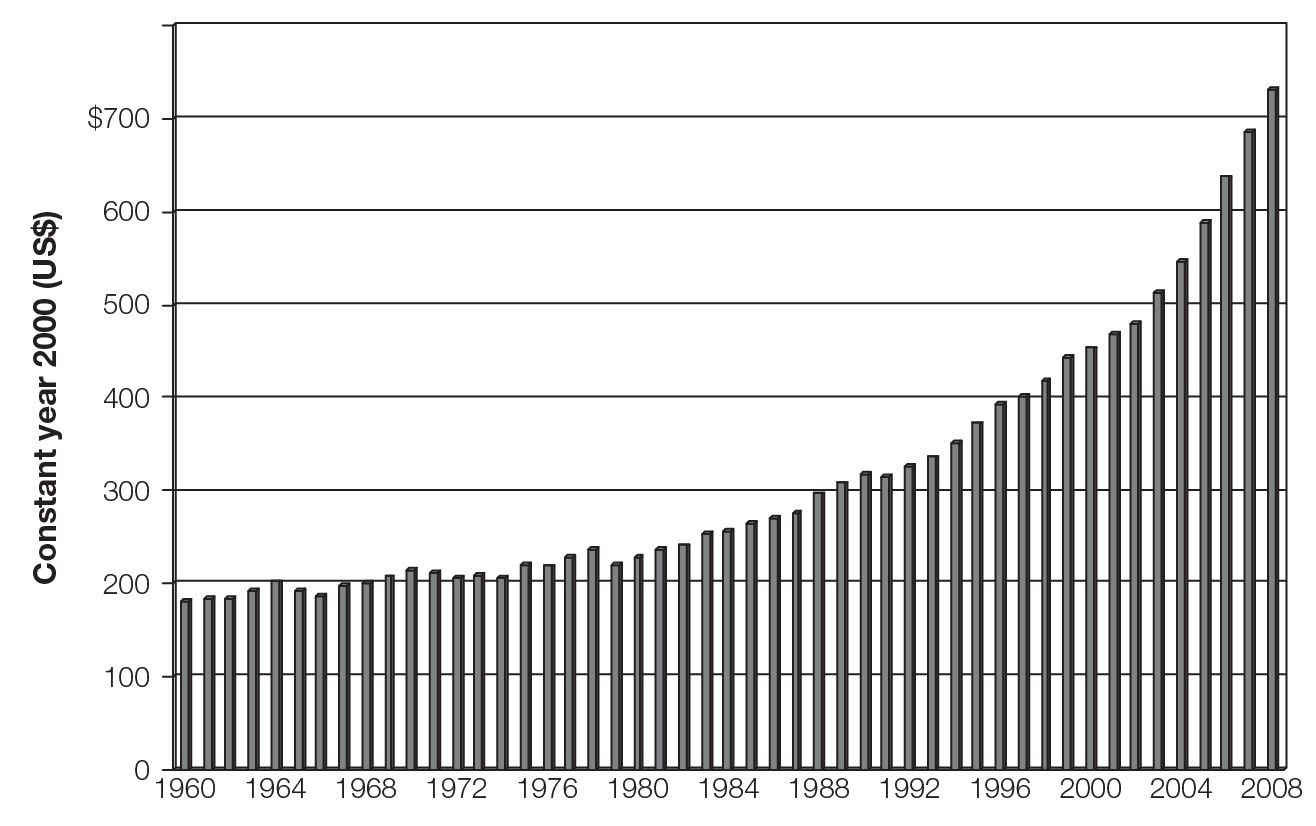
Source: World Development Indicators, WDI Online, 2009, http://www.worldbank.org/.