
Electronic properties and adsorption behaviour of thin films with polar character
Abstract:
Thin films of polar nature are distinctively different from their non-polar counterparts. They feature characteristic properties in their surface morphology, electronic structure and adsorption behaviour, which originate from the effort of such systems to lower the polarity-induced electrostatic energy. This chapter provides insight into the general concepts of polarity and typical polarity healing mechanisms. A main focus is the polarity of thin oxide films and the chapter deals with the various observable consequences of uncompensated surface dipoles in such systems. Furthermore, the distinct adsorption characteristic of polar films is discussed, putting special emphasis on the peculiar growth modes, self-assembly phenomena and charging effects that accompany residual polarity. Finally, brief reference is made to potential applications of polar materials.
11.1 Introduction to oxide polarity
Thin films with polar character form a particularly interesting class of materials, as they possess a number of unusual structural and electronic properties and a unique adsorption and reaction behaviour with respect to non-polar systems (Noguera, 1996; Goniakowski et al, 2008). The decisive property of a polar system is a macroscopic surface dipole that orients perpendicular to the surface and originates from a distinct crystallographic structure of the material. Surface polarity usually arises from the presence of elementary cells in the atomic lattice that carry an uncompensated dipole moment. As electrostatic dipoles are related to the occurrence of charged species in the lattice, surface polarity is restricted to highly ionic materials and does not occur in covalently bound or metallic systems. Prototypical polar materials are therefore sulfides, oxides and halides that are characterized by a high level of ionicity. In this chapter, we will concentrate exclusively on polar oxide films, whereas information on halides and sulfides can be found in the literature.
P. W. Tasker introduced a simple three-level scheme to classify polar systems (Tasker, 1979). Type I materials consist neither of charged atomic layers parallel to the surface nor of unit cells with a dipole moment and are consequently non-polar (Fig. 11.1a). Type II systems are built of atomic planes that carry a net charge. However those charges add up to a vanishing dipole moment within each unit cell, rendering the ideal system non-polar again. One recognizes immediately, however, that polarity can be introduced to such systems if the top-most surface plane does not coincide with the boundaries of the unit cell and a layer of uncompensated charges resides at the surface (Fig. 11.1b, dashed line). The polarity of type II systems is therefore not intrinsic to a certain crystallographic orientation, but depends on the surface termination. A typical example is the Al2O3(0001) surface, which is non-polar for the Al-termination as a charge-compensated unit cell that includes the surface can be constructed, but polar for the O-termination. The same consideration holds for the O- (non-polar) versus the Ti-terminated (polar) surface of TiO2(110). Type III systems are intrinsically polar according to Tasker’s scheme, because they comprise stacks of oppositely-charged atomic planes as well as elementary cells that have a non-vanishing dipole moment along the surface normal (Fig. 11.1c). Prominent examples are the rocksalt crystals with (111) orientation, e.g. MgO(111), NiO(111) and FeO(111), and the (0001) planes of wurzite, for instance ZnO(0001).

Fig. 11.1 Classification of ionic systems according to the Tasker scheme. (a) and (c) are intrinsically non-polar and polar surfaces, respectively. The polarity of (b) depends on the termination. A non-polar surface is obtained when cutting the crystal between two dipole-compensated unit cells, whereas polarity arises for a cut through the unit cell (dashed line)
The specific properties of polar systems become evident in thicker films. Each unit perpendicular to the surface carries a dipole moment μ of:
with σ being the charge density in the layer and d the layer distance. For polar films consisting of thousands of charge-separated planes, those dipole moments add up to a macroscopic quantity that finally diverges in the bulk material (Fig. 11.2). The electrostatic energy Vtotal to stabilize the dipole moment in a slab of N unit cells can be approximated with the help of a plate capacitor model:

Fig. 11.2 (a) Vertical cut through a polar system. The layer distance d and the size of the unit cell D are indicated. (b) Dependence of the electrostatic energy on the thickness of the polar slab.
whereby ε0 and εr are the vacuum permittivity and the dielectric constant of the material, respectively (Kittel, 1996). To get an idea of the energies involved, the electrostatic potential is calculated for a free-standing MgO(111) bilayer (εr ~ 10). The system consists of a positively-charged Mg2 + and a negative-charged O2 − plane (σ = 2|e|/7.8 Å2) separated by the bulk lattice parameter of 1.8 Å and already has an electrostatic energy of 8.3 eV. Apparently, the values for thicker slabs easily reach the lattice energy in ionic crystals of 20–30 eV, rendering polar materials energetically unstable. Bulk-like structures with uncompensated polarity should therefore not exist in nature.
The latter statement seems to be in conflict with the experimental observation of systems with polar character. Moreover, polar terminations are often characterized by a lower surface free energy than their non-polar counterparts. For example, MgO cubes terminated by non-polar (100) surfaces were found to develop polar (111) facets in a humid environment, although this should be accompanied by a dramatic increase of the electrostatic energy (Hacquart and Jupille, 2007). Similarly, a (111)-type NiO surface has been identified as the one with the lowest free energy even with respect to the non-polar (100) and (110) planes (Barbier et al., 2000). This discrepancy can be solved by considering the various polarity-healing mechanisms that are able to remove the electrostatic dipole and therewith the polarity of the respective surface (Goniakowski et al., 2008). From a purely mathematical viewpoint, polarity cancellation is achieved by adjusting a distinct charge density at the surface that compensates the bulk dipole. For simple systems, the required surface charge density is given by:
with D being the height of the unit cell and d the interlayer distance in the crystal. As an example, layers with 25% and 50% of the bulk charge density need to be formed on the wurzite (0001) (d/D = 0.25) and the rocksalt (111) surface (d/D = 0.5) in order to remove the polarity in the whole system. In simple terms, the polarity annihilation might be understood in these cases as the result of an additional dipole that is created between the upper and lower surface of the slab and has exactly the same size but an opposite sign as the bulk moment.
Several mechanisms have been identified that enable an adjustment of the required charge density at the surface (Noguera, 1996; Goniakowski et al., 2008). A first possibility is the restructuring of the top-most surface layers, creating planes with fractional atom filling and hence modified charge distribution (Fig. 11.3a). The best studied example is the octopolar reconstruction of the rocksalt (111) surface, which was predicted by Wolf in 1992 and later verified experimentally through X-ray diffraction measurements on NiO(111) and MgO(111) (Barbier et al., 2000; Finocchi et al., 2004). The octopolar reconstruction comprises two surface layers with 75% and 25% atom filling with respect to the ideal plane, which adds up to the required 50% charge density at the surface according to Eq. 11.3. The dipole compensation in this case is so efficient that the free energy of the reconstructed surface drops below the value for comparable non-polar oxide planes (Barbier et al., 2000). Alternative reconstructions have been identified for other lattice geometries and different chemical environments. For instance, a spinel-like termination was found to develop on NiO(111) at low O2 partial pressures (Barbier and Renaud, 1997; Barbier et al., 1999), while several non-stoichiometric surface compositions were revealed for SrTiO3(111) in a Sr- or O-rich environment (Bottin et al., 2003). For the Zn-terminated ZnO(0001) surface, polarity healing has been investigated at the local scale with the help of scanning tunnelling microscopy (STM) (Parker et al, 1998; Dulub et al, 2003; Ostendorf et al, 2008). The studies revealed triangular-shaped islands and pits of 1 ML height that cover the complete oxide surface (Fig. 11.4a). According to density functional theory (DFT) calculations, the edges of those triangular structures are saturated with O atoms, rendering the surface oxygen-rich with respect to the bulk (Kresse et al., 2003). As discussed above, the polarity of wurzite(0001) is cancelled by creating a surface layer with 25% extra charges, which corresponds to a local Zn:O stoichiometry of 3:4 with respect to the bulk value of 1:1. Exactly this ratio is adjusted by introducing the triangular islands and pits into the ZnO surface. Each equilateral triangle comprises ½ ⋅ n ⋅ (n + 1) anions and ½ ⋅ n ⋅ (n − 1) cations (n being the side length) and has an excess of n oxygen ions. The desired 3:4 surface stoichiometry is now realized by forming islands with seven edge atoms (n = 7), a structure that is indeed frequently found on the surface (Fig. 11.4b). For larger islands, additional atoms have to be removed from the layer underneath to reach the ideal Zn:O surface ratio (Fig. 11.4c,d). The patched Zn-terminated ZnO(0001) surface is therefore an ideal example for polarity healing via surface reconstruction (Dulub et al., 2003).


Fig. 11.4 (a) Empty-states STM image of Zn-terminated ZnO(0001) (50 × 50 nm2). The terraces are covered with triangular islands and pits that are involved in healing the surface polarity. (b–d) Structure models of three triangular islands of different size. The island borders are saturated with oxygen. The resulting non-stoichiometry produces a charged surface layer that compensates the bulk dipole moment. Reprinted with permission from Dulub et al., 2003, Copyright (2010) by the American Physical Society.
Alternatively, dipole compensation might be achieved via purely electronic effects, leaving the atomic structure of the surface unchanged (Fig. 11.3b). One proposed mechanism is the creation of surface states, the electron filling of which is adjusted to reach the required charge density for polarity healing (Goniakowski et al., 2008). The formation of a partly-filled electronic state is always connected with the metallization of the oxide surface. This particular mechanism has been predicted for bulk Al2O3(0001) (Wang et al., 2000) and thin, unreconstructed MgO(111) films (Goniakowski et al., 2007). The formation of dipole-compensating surface states becomes particularly easy when the polar oxide is capped by a metal film, as demonstrated for Pd and Cu over-layers on MgO(111) and ZnO(0001), respectively (Goniakowski and Noguera, 2002; Meyer and Marx, 2004).
A third way to compensate the polarity of oxide materials is the binding of ad-species that become charged upon adsorption (Fig. 11.3c). The prototype adsorbate to heal surface polarity is hydrogen, which forms hydroxyl groups consisting of a surface oxygen ion and a positively charged H+ ion. The hydroxylation of oxide surfaces is often triggered by the heterolytic splitting of water, which renders this compensation mechanism especially efficient in an ambient environment. Hydroxylation was predicted to occur spontaneously on most rocksalt (111) surfaces (Pojani et al., 1997), on ZnO(0001) and on Al2O3(0001) (Wang et al., 2000). It has been revealed experimentally for instance on MgO(111) (Poon et al., 2006; Hacquart and Jupille, 2007), NiO(111) (Rohr et al, 1994; Kitakatsu et al, 1998) and ZnO(0001) (Wang, 2008)by detecting the O–H vibrational bands. Also combined mechanisms are reported, where molecular adsorption induces the formation of a partly-filled surface state at the Fermi level, which in turn removes the surface polarity (Wang et al, 2005). Adsorbate-mediated polarity healing, in general, is responsible for the unique binding properties of polar systems and their enhanced chemical reactivity with respect to non-polar materials (Sun et al., 2009).
11.2 Polar oxide films
Whereas for bulk materials the polarity needs to be healed in order to avoid a divergence in the electrostatic energy, thin films grown on metal and semiconductor supports can be stabilized even in a polar state. This difference to bulk materials relies on two effects. First, the electrostatic energy might be kept below the lattice energy of the film, as the number of polar units is small (see Eq. 11.2). As a consequence, reconstruction of the surface can be avoided and the film keeps its polar nature. Second, the substrate contributes to a reduction of the film dipole, especially when using a polarizable metal support. In this case, the required charge density that heals the polarity according to Eq. 11.3 is provided by the substrate and localized at the metal–oxide interface (Goniakowski and Noguera, 2002, 2009). The interplay between a polar film and a metal support shall be demonstrated in the following for a simple bilayer structure, consisting of a cationic and an anionic plane (Fig. 11.5).

Fig. 11.5 Sequence of oxide layers at the interface to an electronegative (a) and an electropositive (b) support. In both cases, the intrinsic dipole of the film is oriented in opposite direction to the interface dipole that results from a polarization/charge transfer between oxide and metal support. This compensation effect partly quenches the polarity of the combined system.
The preferred adsorption geometry of the film is given by the electron affinity of the substrate. Whereas the interface is formed by positively charged ions on electronegative metals (e.g. Au and Pt), a negatively charged oxygen layer sits on top of electropositive materials (e.g. Mg and Al) (Goniakowski and Noguera, 2009). In the first case, electrons accumulate in the topmost substrate plane, leading to the following sequence of charged layers: metal surface(−)/cations(+)/anions(−). In the second scenario, the charge distribution changes to metal(+)/anions(−)/cations(+), as the electron density in the metal surface is depleted by the polar film. In both cases, the tri-layer structure has a reduced vertical dipole moment and hence low polarity. This substratemediated effect on the polarity might be enhanced by a real charge transfer, whereby electrons flow out of the polar film on electronegative metals but into the ad-layer on electropositive supports. The resulting charge-driven dipole always aligns in opposite direction to the film moment and further quenches the polarity of the metal–oxide system. The various electrostatic interactions that occur between a metal surface and a polar film, as well as the dipole moments involved are summarized in Fig. 11.5.
Thanks to efficient polarity stabilization schemes, thin oxide films with residual dipole moment can be prepared on metal surfaces, even if the respective bulk oxides are thermodynamically unstable. Well-studied examples for polar oxide films are MgO(111) on Ag(111) and Au(111) (Kiguchi et al, 2003; Arita et al, 2004; Mantilla et al, 2008; Myrach et al., 2011), ZnO(0001) on Ag(111) (Tusche et al, 2007), CoO(111) on Ir(100) (Giovanardi et al, 2006) as well as FeO(111) on Pt(111) (Vurens et al, 1988; Ritter et al, 1998; Rienks et al, 2005). STM topographic images of the respective films are displayed in Fig. 11.6. The residual polarity of the various systems depends largely on the film structure and the nature of the metal–oxide interactions and is rather different in all cases. Rocksalt MgO(111) is only polar in the limit of ultrathin films, but becomes non-polar with increasing thickness due to the formation of 3D oxide islands (Myrach et al., 2011). In ZnO(0001)/Ag(111), on the other hand, the polarity is suppressed already in the first atomic planes, which adopt a hexagonal boron nitride structure with Zn and O ions lying in the same layer (Tusche et al., 2007). The wurzite structure of bulk ZnO is only restored in thicker films, which are, however, subject to considerable surface roughening that quenches the reappearing surface dipole. In rocksalt CoO(111) and spinel Co3O4(111), polarity healing is achieved by a substantial decrease in the interlayer distance between the top-most O and Co planes and a concomitant reduction of the ionicity of the surface species (Giovanardi et al., 2006). A similar means to reduce the surface polarity has been identified for FeO(111) on Pt(111). Using X-ray diffraction techniques, the Fe-O layer separation in the film was determined as 0.68 Å, which is 50% smaller than the bulk value and substantially decreases the surface dipole (Kim et al, 1997). As a result of this vertical contraction, the FeO layer is expanded within the surface plane and the Fe nearest-neighbour distance increases from its bulk value of 3.0 Å to 3.1 Å in the film. A similar tetragonal distortion has been revealed for other polar films, e.g. for VO/Rh(111) (Schoiswohl et al, 2005; Parteder et al, 2008) and TiOx/Pt(111) (Sedona et al, 2005), indicating the universal nature of this polarity healing mechanism.
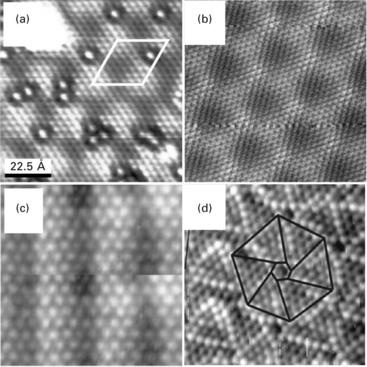
Fig. 11.6 STM topographic images of polar oxide films prepared on metal supports. (a) ZnO/Ag(111) (9 × 9 nm2, 1.2 V). Reprinted with permission from Tusche et al. (2007), Copyright (2010) by the American Physical Society. (b) FeO/Pt(111) (9 × 9 nm2, 0.65 V). (c) CoO/Ir(100) (4.5 × 4.5 nm2, 0.15 V). Reprinted with permission from Giovanardi et al. (2006), Copyright (2010) by the American Physical Society. (d) VO/Rh(111) (6 × 6 nm2, 2.0 V). Reprinted with permission from Parteder et al. (2008), Copyright (2010) by Elsevier.
In all these experiments, changes in the oxide stoichiometry and parasitic adsorption processes have been excluded as means to heal the oxide polarity. Thin oxide films that can be prepared on various metal supports are therefore well suited to study the adsorption behaviour of polar materials. However, before this issue is addressed in Section 11.4, experimental techniques to quantify the amount of oxide polarity will be introduced in the next Section.
11.3 Measuring polarity of thin oxide films
In most experiments, the polar nature of thin films is concluded from indirect evidence, for instance from a reconstruction of the surface (Dulub et al., 2003; Ostendorf et al., 2008), unusual electronic properties (Kiguchi et al., 2003; Arita et al., 2004) or an adsorption behaviour that strongly deviates from the non-polar case (Rohr et al., 1994; Wang et al., 2005; Poon et al., 2006). Such indirect indications give no information on the nature of the actual polarity healing mechanism and on the size of the remaining surface dipole. However, this kind of data can be obtained with STM, a technique that is usually employed to probe the surface topography. In the following, two spectroscopic applications of STM are discussed that enable detection of the local surface potential as a measure for the polarity. The techniques are based on the evaluation of (i) energy positions of field emission resonances (FER) and (ii) effective barrier heights for electron-tunnelling into the polar film. They are demonstrated using the example of the FeO(111) film mentioned above (Rienks et al., 2005), but can be applied to any other polar system with sufficient conductivity to perform STM.
The FeO film has a bilayer structure, consisting of a hexagonal O layer at the surface and a hexagonal Fe plane at the interface to the Pt(111) (Fig. 11.7). It has a polar character due to the ionic nature of the Feδ + and Oδ − species and belongs to type III materials in the Tasker scheme (Tasker, 1979). The FeO film has an in-plane lattice parameter of 3.1 Å, being 11% larger than that of Pt(111) (2.76 Å). This mismatch leads to the formation of a coincidence lattice with 25 Å edge length and a crystallographic relation of (√ 91 × √ 91)R ± 5.2![]() with respect to the Pt support (Ritter et al., 1998). Within the coincidence cell, three stacking domains are distinguishable that differ in their Fe binding geometry on the Pt(111) surface (Fig. 11.7a). In the top domain, the interfacial Fe atoms bind on top of Pt, while the O atoms in the layer above occupy fcc hollow sites. In the fcc (hcp) domains, Fe binds to fcc (hcp) hollow sites while O sits in hcp (top) positions of the Pt(111) lattice. The different binding configurations give rise to a distinct contrast of the FeO film in low-bias STM images (Fig. 11.7b). The discernible regions have been assigned to the underlying stacking domains with the help of model calculations based on DFT (Giordano et al., 2007b) and a quantum-chemical scattering approach (Galloway et al., 1996).
with respect to the Pt support (Ritter et al., 1998). Within the coincidence cell, three stacking domains are distinguishable that differ in their Fe binding geometry on the Pt(111) surface (Fig. 11.7a). In the top domain, the interfacial Fe atoms bind on top of Pt, while the O atoms in the layer above occupy fcc hollow sites. In the fcc (hcp) domains, Fe binds to fcc (hcp) hollow sites while O sits in hcp (top) positions of the Pt(111) lattice. The different binding configurations give rise to a distinct contrast of the FeO film in low-bias STM images (Fig. 11.7b). The discernible regions have been assigned to the underlying stacking domains with the help of model calculations based on DFT (Giordano et al., 2007b) and a quantum-chemical scattering approach (Galloway et al., 1996).

Fig. 11.7 (a) Structure model of the coincidence cell formed between FeO and Pt(111). The O-top layer is omitted for the sake of clarity. (b) STM topographic image taken at 65 mV (7 × 7 nm2). The different stacking domains are assigned in accordance to the DFT calculations presented in Giordano et al. (2007b).
The binding of Fe and O atoms either to Pt hollow or top sites modulates the interlayer distance and hence the surface dipole in the three oxide domains. The resulting change in polarity is an observable quantity and produces a strong bias-dependent contrast of the FeO film in STM images taken at high sample bias (Fig. 11.8b). At 4.25 V, one region of the coincidence cell (marked with a circle) is imaged with a particularly bright contrast. The contrast is not related to a geometric effect, as the low-bias corrugation of the film that reflects its true morphology is very small (0.3 Å). It is, in fact, of electronic origin and caused by a strong increase in the conductance through the STM junction at this particular bias. To verify this statement, the differential conductance (dI/dV) through the FeO/Pt(111) system has been measured directly as a function of bias voltage, as shown in Fig. 11.8a. In correspondence to the topographic image, high dI/dV intensity at 4.25 V is observed in the domain marked by the circle. However, with increasing bias the dI/dV maximum moves to an adjacent domain, being flagged by the square, and finally appears in the triangle region at 4.9 V sample bias.

Fig. 11.8 (a) Conductance and (b) topographic images of FeO/Pt(111) taken as a function of the bias voltage (9 × 9 nm2). The contrast change reflects the varying contributions of field emission resonances to the electron transport through the different stacking domains. Reprinted with permission from Rienks et al. (2005), Copyright (2010) by the American Physical Society.
These bias-dependent conductance changes are caused by electron transport through confined states that develop in the classical part of an STM junction and become accessible for electrons at elevated bias (Binnig et al., 1982; Becker et al., 1985). Those states may be considered as eigenstates in a triangular potential, being confined by the sample surface on one side and the down-sloping vacuum barrier on the other (Fig. 11.9b). Electrons penetrating this classical region are able to form standing waves, if multiples of half their electron wavelength match the distance between the two boundaries. In this case, propagating and reflected waves interfere constructively and quasi-bound electronic states with a high transmission probability develop in the STM junction. These states are termed field emission resonances (FER) and dominate the STM image contrast at elevated bias. Interestingly, they also contain information on the local surface potential F and might therefore be used to probe oxide polarity (Fig. 11.9b). The interplay between FER and F can be explained with a simple picture. The electrostatic energy due to uncompensated polarity (Eq. 11.2) produces an offset on the surface potential that shifts the FER to higher energy and modulates their availability for electron transport through the oxide film. Up-shifted FER are therefore indicative for polar regions, while down-shift states occur in areas with compensated polarity.

Fig. 11.9 (a) Conductance spectra obtained with closed feedback loop on the three stacking domains of the FeO film, as indicated in the STM image shown in the inset. Each maximum marks the position of a field emission resonance (FER) in the tip-sample junction. (b) Potential diagram visualizing the formation of FER at high bias voltage and their dependence on the local work function. Reprinted with permission from Rienks et al. (2005), Copyright (2010) by the American Physical Society.
Already this crude model is sufficient to connect the contrast changes observed in the dI/dV maps of FeO/Pt(111) to spatial modulations of the surface polarity (Rienks et al., 2005). The domain that turns bright at 4.25 V is the one with lowest surface potential, as the first FER becomes available at relatively low bias (Fig. 11.8a). Based on a simple hard-sphere model of the film, this region is assigned to the FeO top domain, in which Fe and O atoms occupy top and hollow sites of the Pt surface, respectively, and the Fe-O interlayer distance and hence the surface dipole are small. At 4.5 V, the FER become available in the square regions, which have a slightly higher F as indicated by the up-shifted resonances. The region marked by the triangle turns bright only at 4.9 V and consequently has the highest F and hence the highest degree of polarity. The hard-sphere model connects this region to the hcp domains, as the vertical distance between the hollow-bound Fe atoms and the top-bound O atoms is expected to be largest there. The sequential availability of FER in the different domains is not so evident in the topographic images, which contain information on the integral conductance probed over a large bias window (Fig. 11.8b).
The changes in the electrostatic potential due to the modulations in the polarity can even be quantified for the three stacking domains of FeO/Pt(111) (Rienks et al, 2005). For this purpose, the position of the first six FER was detected with dI/dV spectroscopy performed in a large bias window (1–10 V) (Fig. 11.9a). In correspondence to the dI/dV maps, the series of FER starts in the top domain at 4.25 V (see circle in Fig. 11.8a), whereas the fcc (square) and hcp (triangle) domains follow at 4.7 and 5.1 V, respectively. It should be noted that due to the limited spatial resolution of dI/dV spectroscopy at high bias, low-lying FER of neighbouring domains show up in the spectrum of a selected region as well. Consequently, the dI/dV peaks of fcc and hcp domains are split into two and three maxima with the lower ones arising from conductance contributions of the adjacent top and fcc domains, respectively.
The local surface potential Φ is determined from fitting the experimental FER positions to a quantum-mechanical model that describes the resonances as eigenstates in a triangular potential. The well is confined by the sample surface and the vacuum barrier that slopes down with the tip-induced electric field F (Fig. 11.9b) (Kolesnychenko et al., 2000). Here, F is assumed to be constant during spectroscopy due to the enabled feedback loop of the STM. The position of the nth FER calculates to:
with m being the free electron mass (Kolesnychenko et al., 2000). A fit of all experimental FER except the first one, whose energy position is altered by other effects, yields the surface potential. The derived Φ values increase from 3.5 eV in the top region to 3.65 and 3.85 eV in the fcc and hcp domains, in good agreement with the results of the dI/dV maps. Conclusively, the hcp and top domains are the most and least polar ones, corroborating the predictions from the hard sphere model.
Complementary information on the surface polarity is obtained by measuring the effective barrier height Φeff that is experienced by electrons tunnelling into the FeO film (second approach). The barrier height is measured via dI/dz spectroscopy, detecting the current response I to a change in the tip-sample distance z (Chen, 1993). The relationship between those quantities can be derived from a one-dimensional model for electron tunnelling through a square-shaped barrier:
Although the barrier height is not identical to the real surface potential, it is a monotonous function of Φ (Olesen et al., 1996). It will thus be largest on the most polar oxide region, as the electrons have to overcome a substantial surface dipole. Figure 11.10 shows two approaches to probe the effective barrier height of the FeO thin film. In Fig. 11.10(a), the logarithmic current response to a linear distance ramp is recorded and Φeff is extracted from the slope of the ln(I)-Δz curves. In Fig. 11.10(b), the d(lnI)/dz signal is mapped directly with lock-in technique by adding a small z-modulation to the STM feedback loop. In both cases, spatial variations in the effective barrier height are detected on the FeO surface. Here, the top domains exhibit the smallest slope in ln(I)-Δz curves and the lowest intensity in d(lnI)/dz maps, indicating a low barrier height. The hcp domains, on the other hand, are characterized by a large Φeff value, in agreement with their more polar nature. The two techniques discussed above, namely evaluating the FER energies and probing the effective barrier height, therefore reveal similar modulations in the local surface potential and provide unmatched insight into the polarity of the three FeO stacking domains.

Fig. 11.10 (a) Tunnel current versus tip-sample distance recorded for the top and hcp domain of the FeO coincidence cell. From the current slope, the effective barrier height is determined and displayed in the inset. (b) d(lnI)/dz image of FeO/Pt(111) taken with lock-in technique and closed feedback loop. (Image size 5.7 × 5.7 nm2, Vs = 4.5 V, Δzrms = 1 Å.) Reprinted with permission from Rienks et al. (2005), Copyright (2010) by the American Physical Society.
The experimental results obtained on the polar FeO/Pt(111) film have been corroborated by DFT calculations (Giordano et al., 2007b). Due to the large size of the real FeO-Pt coincidence cell, they were performed with a smaller computational cell that still contains Fe atoms in characteristic top, fcc and hcp binding configurations (Fig. 11.11a). While the hcp and fcc regions display similar properties in the simulations, the top domain sticks out in various aspects. It is characterized by the largest interfacial separation from the Pt(111) surface and therefore mimics the properties of a free-standing FeO layer. Additionally, the vertical separation between Fe and O planes (0.5 Å) is 15–20% smaller in the top than in adjacent hcp and fcc domains (0.8 Å). The top region therefore has the smallest Feδ +-Oδ − surface dipole and hence the lowest surface potential. Its Φ value is 0.29 and 0.23 eV lower than those of the hcp and fcc regions, respectively, in good agreement with the measured potential modulations in the FeO coincidence cell of 0.35 eV.

Fig. 11.11 (a) Top view of a model structure for the FeO/Pt(111) system that contains all relevant Fe binding configurations but is much smaller than the real coincidence cell. (b) STM image of the polar FeO film taken at + 4.5 V sample bias (top, 7 × 7 nm2) and corresponding surface potential map calculated with the model shown in (a) (bottom). The map depicts the -Φ signal, and regions with low surface potential. Reprinted with permission from Giordano et al. (2007b), Copyright (2010) by the American Physical Society.
Based on the computed surface potentials, STM images have been simulated for bias voltages in the field emission mode (Giordano et al., 2007b). As discussed above, the contrast in this regime is governed by the availability of FER, which in turn depends on the local surface potential. A small Φ gives rise to a bright contrast, as low-lying FER with high electron transmissibility promote the electron transport, while regions with large Φ appear dark. Calculated Φ maps, depicted with inverted contrast, indeed reproduce the high-bias STM images of the FeO/Pt system (Fig. 11.11b). In agreement with our earlier interpretation, the brightest region corresponds to the one with the lowest surface potential and is assigned to the top domain that has the lowest polarity of all FeO stacking domains.
Measurements of the surface potential with an STM have proven to be an adequate means to probe the polarity of FeO thin films (Rienks et al., 2007). Similar results were obtained for other polar systems, e.g. MgO(111) films grown on Au(111) (Myrach et al., 2011). Also here, a considerable surface dipole develops from the stacking of a surface O2 − layer on top of an interfacial Mg2 + layer. This layer sequence is compatible with the electronegative character of gold, which promotes a charge transfer out of the cationic plane to reduce the vertical dipole moment (Fig. 11.5a). Similar to the FeO/Pt(111) system, the surface polarity is not homogeneous on the MgO(111) surface, but for a different reason. The oxide polarity quickly vanishes with film thickness, as three-dimensional MgO islands with zero dipole develop on the surface. The initial building blocks that are responsible for polarity healing are nano-pyramids of a few layers height (Wolf, 1992), which are readily observed in STM images of the oxide film (Fig. 11.12a). Their effect on the oxide polarity has been deduced from the barrier height images again (Fig. 11.12b). As expected, the Φeff value turns minimal above the surface protrusions, demonstrating the effective quenching of the surface dipole due to the island growth. It should be noted that this morphology-driven removal of the polarity bears similarities to the octopolar reconstruction that is the dominant healing mechanism on bulk MgO(111) (Barbier and Renaud, 1997; Barbier et al., 2000).
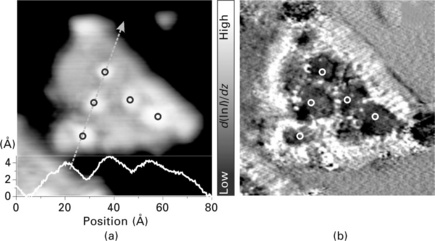
Fig. 11.12 (a) Topographic image of a bilayer MgO(111) island grown on Au(111) (− 0.25 V, 9 × 9 nm2). A height profile taken across the island is shown in the inset. (b) Effective barrier height (d(lnI)/dz) image of the same surface region. Particularly low values of the barrier height are revealed on the ad-structures that cover the oxide island, indicating their importance in quenching the surface dipole.
In general, the STM is able to provide spatially resolved information on the distinct properties of polar surfaces. The technique is not only suited to characterize the various polarity healing mechanisms from a topographic point of view, but enables a local determination of the surface potential and its correlation to the oxide polarity. Although STM-based approaches do not reach the same quantitative accuracy in determining surface potentials as, for instance, Kelvin–Probe spectroscopy, they feature an unmatched spatial resolution with respect to alternative techniques.
11.4 Adsorption properties of polar films
Residual polarity gives rise to unusual adsorption and chemical properties of thin oxide films (Goniakowski et al., 2008; Sun et al., 2009). The difference to non-polar systems lies in the electrostatic contribution to the surface free energy that originates from the uncompensated surface dipole (see discussion in Section 11.1). The binding behaviour of adsorbates is therefore not only governed by the usual physisorption and chemisorption effects, but includes changes in the electrostatic energy of the system as adsorbates might reduce its polarity. Given the magnitude of the energies involved, the binding potential of polar surfaces can be substantially higher compared to non-polar ones. A direct manifestation of this effect is the wetting growth of metals on polar surfaces, whereas mainly three-dimensional deposits form on non-polar oxide materials (Goniakowski and Noguera, 2002; Meyer and Marx, 2004).
Two mechanisms have to be considered in conjunction with polarity healing via adsorbates. In a first scenario, the ad-species become charged upon adsorption and alter the electron density on the surface. As discussed in Section 11.1, depolarization of the system takes place when the surface charge density equals the bulk density times the ratio between interlayer distance d and unit cell height D:
This condition can now be fulfilled by adsorbing the required number of charged species to the surface. The most prominent example of this mechanism is the attachment of protons (H+) that often originate from the heterolytic splitting of water to polar surfaces (hydroxylation). For rocksalt (111), every surface site needs to be occupied by a hydroxyl group in order to quench the polarity, although d/D = 0.5. The reason is that each H+ carries only half the charge of an oxide ion (Mg2 +, O2 −). In the case of wurzite (0001), on the other hand, 50% surface coverage would be sufficient. The hydroxylation of polar oxide surfaces has been intensively studied with infrared reflection absorption and high resolution electron energy loss spectroscopy (HREELS), as discussed for instance in Rohr et al. (1994), Poon et al., (2006) and Wang (2008). At the local scale, proton attachment was investigated with the STM on Cr2O3/Cr(110) films (Maurice et al., 2001) and more recently on FeO/Pt(111) (Merte et al., 2009; Knudsen et al., 2010). Although dipole removal via hydroxylation is observed most frequently, any other adsorbate that is easily ionized or polarized can be used instead. Examples for the adsorption of charged ad-species on polar oxide films are given in Section 11.4.1.
A second mechanism for dipole quenching is the metallization of polar surfaces. In this case, the adsorbates create electron bands that cross the Fermi energy of the system and can be filled with the required number of electrons to satisfy Eq. 11.4. Those electronic states might be intrinsic to the ad-species or induced into the polar material upon adsorption. The first case is typically realized with metallic adsorbates that possess states around the Fermi level. For instance, a single Pd layer attached to a Mg-terminated MgO(111) slab was found to charge up negatively by filling a Pd-like interface state (Goniakowski and Noguera, 2002). The computed charge density in the Pd layer hereby adopts 50% of the MgO bulk value in accordance with Eq. 11.4. Further thickening of the metal film does not change this situation, indicating that a single layer is sufficient to cancel the oxide polarity. Experimentally, the wetting growth of metals on polar oxide materials has been studied for Cu on Zn(0001) (Koplitz et al., 2003; Dulub et al., 2005; Kroll and Köhler, 2007). Especially, on the O-terminated surface, a layer-by-layer growth of Cu is observed that reflects, however, not only the impact of oxide polarity but also the generally higher adhesion for this surface termination. A similar result was obtained for the polar FeO/Pt(111) film, where extended 2D islands form upon Pd deposition (Fig. 11.13a). It should be noted that metals usually develop 3D particles when deposited on non-polar materials in order to minimize the contact area with the inert oxide surface (Bäumer and Freund, 1999).

Fig. 11.13 (a) STM image of a planar Pd island grown on a FeO/Pt(111) film (9.0 × 9.0 nm2). The two-dimensional growth mode is triggered by the polarity of the system. (b) STM images of a clean (left) and a hydrogen covered ZnO(10-10) surface (right). The dashed rectangle marks the (1 × 1) surface unit cell. H adsorption leads to a metallization of the ZnO(10-10) surface, as shown by the vanishing band gap in I-V curves taken on the H-covered surface. Reprinted with permission from Wang et al. (2005), Copyright (2010) by the American Physical Society.
Induction of a metallic surface state in the substrate itself has been demonstrated with STM conductance spectroscopy and HREELS for the ZnO(10-10) surface (Wang et al, 2005; Yin et al, 2006). In those experiments, the oxide band gap was found to disappear after adsorbing one H atom per unit cell of the ZnO surface (Fig. 11.13b). This result was explained with the transfer of the hydrogen electron into the initially empty 4 s-band of zinc that subsequently becomes half-filled. Increasing the dosage to two H atoms per unit cell renders the surface non-metallic again, as a second electron is added to the surface band that consequently shifts below the Fermi level. A similar metallization effect has so far not been revealed for the polar ZnO(0001) surface.
The detailed adsorption properties of polar systems are discussed for the FeO/Pt(111) film in the following section. This particular system is selected again because it has already been introduced in the previous sections. Furthermore, the FeO film exhibits spatial modulations of the surface polarity, which induces a template effect in the arrangement of the adsorbates. It is therefore an example where uncompensated polarity induces self-assembly phenomena on an oxide surface.
11.4.1 Adsorption of metal atoms on polar FeO films
As discussed in Section 11.3, the polarity of the FeO film arises from the interplay between an Feδ + interface and an Oδ − surface plane (Vurens et al., 1988; Kim et al, 1997). The Fe-O layer separation is not constant, but varies between 0.52 and 0.78 Å due to different Fe-O stacking configurations on the Pt(111) surface. Large interlayer distances occur for the fcc and hcp domains, while small separations are found in the top region of the FeO-Pt coincidence cell (see Fig. 11.7a for a structure model). As discussed above, such modulations in the interlayer distance affect the vertical dipole strength and therefore the polarity of the film, whereby the hcp and top regions turn out to be the most and least polar ones, respectively (Rienks et al., 2005). The same modulations should govern the spatial distribution of adsorbates on the FeO surface as well.
A first demonstration of this effect was provided in a low-temperature STM experiment, where single Au atoms were deposited onto the film at 10 K sample temperature (Nilius et al., 2005). The incoming atoms perform a transient diffusion on the FeO surface due to their initial thermal energy, and are able to reach their preferred adsorption sites. After thermalization, they can be imaged in the STM as 1.0 Å high, circular protrusions. The adatoms are not randomly distributed on the surface, but exhibit a large tendency to attach to the hcp domains of the coincidence cell. From the five adatoms shown in Fig. 11.14(a), only the uppermost one binds to a top region while the four lower ones sit in hcp domains. At a nominal Au coverage of 0.01 ML, which is close to one atom per coincidence cell, more than 70% of the hcp domains are occupied with Au atoms, whereas adjacent fcc and top regions remain nearly adsorbate-free (occupancy below 10%) (Fig. 11.14c). The site-specific adsorption behaviour of Au therefore leads to the formation of a hexagonal adatom array, the lattice parameter of which matches the size of the FeO/Pt(111) coincidence cell. The long-range order in the adatom arrangement becomes evident in a 2D pair-distribution function n(x, y), calculated from more than 700 atom positions (Fig. 11.15). The highest probability to find a neighbouring Au atom is in the hcp domain of the next FeO/Pt coincidence cell; however, also second and third neighbouring hcp domains show substantial occupancy due to the perfect ordering of the adsorbates. A distinct atom distribution is discernible even within each hcp region, as marked by seven, hexagonally-arranged spots with 3.1 Å mutual distance. This fine structure reflects the few atomic binding sites in the centre of each hcp domain that are actually populated by Au. Based on the pair distribution function, the modulation of Au binding energies within the coincidence cell ΔE can be estimated by assuming a Boltzmann distribution for the occupation probability: n(x, y) ∝ exp(− ΔE/kT) (Silly et al, 2004; Kulawik et al., 2005). As the self-assembly is observed for temperatures as high as 50 K, this temperature is used to calculate a lower bound for ΔE. The analysis yields an energetic preference of (10 ± 2) meV for Au binding to the hcp domains with respect to adjacent fcc and top regions. It is interesting to note that Au atoms remain essentially monomeric upon adsorption onto the oxide film even at relatively high coverage. No aggregation sets in before the majority of hcp domains is filled, which suggests a repulsive, most likely Coulomb-type interaction between the adatoms that inhibits cluster formation (Nilius et al., 2005).

Fig. 11.14 (a) STM topographic image of Au atoms on FeO/Pt(111) (0.5 V, 13 × 13 nm2). Four out of five adatoms occupy hcp domains in the FeO coincidence cell. (b) Overview STM image demonstrating the ordering of Au atoms into a hexagonal lattice (0.5 V, 60 × 60 nm2). (c) Histogram for the probability of finding an Au adatom on the different FeO stacking domains. The plot is based on the evaluation of ~700 atom positions. Reprinted with permission from Nilius et al. (2005), Copyright (2010) by the American Physical Society.

Fig. 11.15 Two-dimensional pair-distribution function of Au atoms on the FeO film (top). Most events occur in the hcp domains; the sharp maxima within those regions reflect the atomic binding sites of the adsorbates. The bottom part depicts the potential landscape for Au adsorption, being calculated by assuming a Boltzmann distribution according to the Au binding energy. Reprinted with permission from Nilius et al. (2005), Copyright (2010) by the American Physical Society.
The self-assembly of Au atoms on the FeO/Pt(111) surface can be traced back to the polar nature of the film. The adatoms preferentially attach to the hcp domains having the largest surface dipole (Giordano et al., 2007b). The uncompensated polarity in this region enables an efficient polarization of the Au, which in turn leads to an electrostatic coupling between the adatoms and the dipole field of the polar film. This binding contribution will be smaller on the adjacent fcc and top domains, where the dipole strength is reduced.
A more detailed picture of the Au ordering effect on the FeO is obtained from DFT calculations (Giordano et al., 2008). In this study, the Au interaction with O-top, Fe-top, bridge and hollow sites has been analysed for all three stacking domains of the coincidence cell. The largest adsorption energy of 0.6 eV was computed for the O-top sites in hcp domains, where the binding is 30% stronger than on Fe sites in the hcp and O sites in the fcc and top domains. This binding preference explains the observed self-assembly of Au adatoms on the FeO film. It should be noted that theory finds an even more favourable adsorption configuration, in which an interfacial Fe atom flips above the O-plane (Fig. 11.16). The hence under-coordinated Fe atom is able to bind the surface Au species with ~1.5 eV, much stronger than in the regular geometry. Due to a concomitant negative charging of the Au adatom, also the film polarity is locally quenched in this configuration, as the resulting Oδ −-Feδ +-Auδ − stacking carries no dipole moment (Fig. 11.16b). A similar binding configuration has been predicted for other electronegative metals, such as Pt (Goniakowski et al., 2009). However, the inverted adsorption geometry could not be confirmed experimentally, as neither the height nor the electronic properties of a potential Au-Fe ad-species was compatible with the STM data. Apparently, the energy barrier to break a Pt-Fe bond at the interface and swap the local Fe-O stacking sequence is not overcome at the low temperature of the experiment (Nilius et al., 2005).
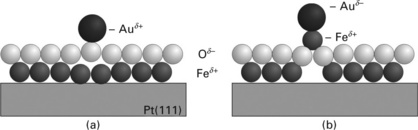
Fig. 11.16 (a) Experimentally observed and (b) energetically favoured binding configuration of Au on FeO/Pt(111). In the optimum geometry, a Fe atom flips above the oxide plane in order to increase the interaction with the Au. The energy barrier for this restructuring is not known.
The experimentally confirmed Au binding to O atoms in the hcp domains leads to a 20% increase of the Fe-O layer distance around the adsorption site, which enhances the surface dipole and therewith the electrostatic Au–FeO interaction (Giordano et al., 2008). The local lattice distortion is initiated by a charge transfer from the Au atom into the Pt crystal. The Coulomb interaction of the Au+ lifts the Oδ − ion underneath above the surface plane, but repels the three adjacent Feδ + ions, thereby inducing a polaronic distortion of the oxide lattice. The formation of charged adsorbates combined with a polaronic distortion of the surrounding lattice is a common binding scenario on ionic oxide films (Pacchioni et al., 2005; Giordano et al., 2007a). The cationic nature of Au atoms on the FeO film is further supported by state density calculations (Fig. 11.17b). The Au 6 s orbital of hcp-bound adatoms is located at + 0.3 eV above the Fermi level and thus empty, in contrast to its half-filled nature in gas-phase gold. This finding indicates that the 6 s electron has been transferred into the support, rendering the Au positively charged. Again, the formation of cationic gold is closely related to the polar nature of the FeO film. Only attachment of a positively charged species is able to heal the oxide polarity, as this neutralizes locally the Feδ + − Oδ − surface dipole (Fig. 11.16a). Adsorption of Au+ is therefore an efficient means to lower the surface free energy of the polar system and fully comparable with the common polarity healing mechanism via hydroxylation (H+ attachment). Energetically, the formation of cationic gold is supported by the unusually high work function of the FeO/Pt(111) system that impedes charge transfer out of the support (Giordano et al., 2007b, 2008). It should be noted at this point that Au+ is an unusual charge state for the strongly electronegative gold. In fact, Au becomes anionic on most non-polar oxide films due to a charge transfer into the adsorbate (Pacchioni et al., 2005; Nilius, 2009). The positive charging in the present case can only be rationalized if the polar character of the FeO film is taken into account.

Fig. 11.17 (a) Conductance spectra and (b) calculated state-density of Au and AuCO species adsorbed on hcp-domains in the FeO/Pt(111) film. An STM image of the probed species is shown in the inset. The Au- related peak at 0.5 V (exp.) and 0.3 eV (theory) corresponds to the Au 6 s orbital, while the AuCO state at 1.0 eV is of CO 2Π* character and not detected in STM. (c) Conductance maps of differently bound Au atoms (13 × 13 nm2). Whereas the upper atoms are attached to hcp domains and appear bright in the conductance map taken at the position of the Au 6 s orbital (0.55 V), the lower species sits in an adjacent domain and shows no 6 s-related dI/dV intensity (lower panel). Below the resonance position, all adatoms are imaged with the same dI/dV contrast (upper panel). Reprinted with permission from Giordano et al. (2008), Copyright (2010) by the American Physical Society.
The charge state of Au atoms on the FeO/Pt(111) system has been verified experimentally by probing the position of the Au 6 s orbital with respect to the Fermi level with STM conductance spectroscopy. The hcp-bound atoms exhibit a pronounced dI/dV peak at + 0.5 V that is readily assigned to the unfilled Au 6 s orbital with help of the DFT results (Fig. 11.17a) (Nilius et al., 2005; Giordano et al., 2008). Further evidence for the 6 s character of this state comes from CO adsorption experiments. After CO exposure onto the Au–FeO film, the + 0.5 V conductance peak vanishes, because the Au 6 s level shifts out of the accessible spectral range upon formation of the Au–CO bond (Fig. 11.17a). The origin of this up-shift is the Pauli repulsion that is exerted by the CO orbitals onto the Au states (Persson, 2005). However, even bare Au atoms do not display the + 0.5 V dl/dV peak if they are not bound to an hcp domain. As concluded from conductance spectra and images, Au atoms in fcc and top regions of the coincidence cell do not possess an unoccupied 6 s orbital (Fig. 11.17c). Apparently, those adatoms have a deviating electronic structure and are not charged, which explains their lower binding energy with respect to the hcp-bound species. The self-assembly of Au therefore results from an interplay between the spatially modulated oxide polarity and the concomitant charging response of the gold, which leads to a binding enhancement only for Au atoms on the FeO–hcp domains.
As the self-assembly of gold on the FeO/Pt(111) film is partially induced by a charge-mediated binding mechanism, it is not surprising that atoms with a deviating electronic structure do not show the same ordering effect. To a certain extent, palladium can be considered as the counterpart to gold, because the Pd affinity levels are far away from the Fermi energy and hardly involved in any charge transfer processes. More precisely, the Pd 5 s orbital is well above EFermi and empty, while the 4d states are below and completely filled. The inhibited electron transfer is expected to hamper the self-ordering of Pd atoms on the FeO surface. Indeed, Pd deposition at 10 K results in a random distribution of adatoms on the oxide film, as evident in the STM image shown in Fig. 11.18. Furthermore, the adsorbates tend to aggregate even at small Pd exposure and low deposition temperature (see arrows in Fig. 11.18c). The uncorrelated spatial arrangement becomes manifest in the radial pair-distribution function calculated for Pd, which does not display any maxima, in sharp contrast to the results obtained for Au (Fig. 11.18b).

Fig. 11.18 STM images of (a) Au and (c) Pd atoms on FeO/Pt(111) (0.25 V, 50 × 50 nm2). Arrows in (c) mark small Pd clusters. (b) Radial pair-distribution function for the Au and Pd adatoms on the FeO surface, calculated from hundreds of atom positions in different STM images. In contrast to Au, no ordering effect is observed for Pd adatoms. Reprinted with permission from Giordano et al. (2008), Copyright (2010) by the American Physical Society.
The absence of self-ordering effects for Pd on the polar FeO film has several reasons, being elucidated in a DFT study (Giordano et al, 2008). In general, Pd atoms experience a much higher binding energy than Au atoms (1.4 eV versus 0.6 eV). The largest binding contribution comes from the formation of covalent bonds with either a Fe or an O ion in the surface. Polarization interactions in the spatially modulated FeO dipole field, on the other hand, are comparatively small. As a consequence, the adsorption landscape of Pd adatoms is rather smooth on the FeO surface and local variations in binding strength are only of the order of 5% (compared to 30% for the Au). In particular, the different polarity of the top, fcc and hcp region does not give rise to prominent changes in the adsorption strength. In addition, the amplification of polar oxide properties due to charge transfer processes out of the adatoms, as observed for Au, does not take place for Pd that remains neutral on all binding sites of the FeO coincidence cell. It is the sum of all these effects that prevents the ordered arrangement of Pd atoms on the FeO film and even facilitates their aggregation into small aggregates on the surface (Giordano et al., 2008).
11.4.2 Adsorption of molecules on polar FeO films
Charging is, however, not essential to induce the self-assembly of adsorbates on polar oxide films. Especially in the absence of strong chemical forces, the modulated surface-dipole within the FeO coincidence cell might sufficiently perturb the adsorption landscape to trigger ordering effects. Self-assembly phenomena that are exclusively driven by the spatially varying oxide polarity are therefore expected for closed-shell, but highly polarizable electronic systems that are unable to form strong covalent bonds with the support. Ideal candidates in this respect are molecules with a conjugated π-electronic system that couple to the inert oxide surface mainly via polarization interactions (Witte and Woll, 2004). Therefore, magnesium phthalocyanine (MgPc) molecules have been chosen to study the adsorption behaviour of a polarizable, but chemically inactive species on the FeO/Pt(111) film (Lin and Nilius, 2008).
Figure 11.19(a) shows an STM topographic image taken after MgPc deposition onto the surface at 300 K. Close inspection of such images reveals that also the MgPc preferentially adsorbs on the hcp domains of the coincidence cell, which show up with bright contrast under the selected experimental conditions. Particularly attractive binding sites for the molecules are those hcp domains that are situated directly next to a rising step edge. A statistical evaluation of dozens of STM images revealed that roughly 84% of the MgPc bind to hcp domains, while only 14% and 2% attach to top and fcc regions, respectively (Fig. 11.19b) (Lin and Nilius, 2008). Assuming a Boltzmann distribution according to the MgPc binding energy, adsorption to the FeO hcp domain is preferred with 90 meV over the fcc and with 46 meV over the top region. This result demonstrates the crucial importance of polarization interactions between MgPc molecules and the dipole field of the polar oxide. It should be noted that an electrostatic coupling to the vertical FeO dipole requires the induction of a dipole moment in the initially planar MgPc molecule, for instance via a small vertical displacement of the central Mgδ + ion against the Pc-cage (Ruan et al., 1999; Janczak and Kubiak, 2001).

Fig. 11.19 (a) Topographic image of MgPc molecules on FeO/Pt(111) adsorbed at 300 K (35 × 35 nm2). The coincidence cell is indicated by a rhomboid, the arrows mark the three rotational orientations of the molecules. (b) Relative occurrence of MgPc in different domains of the FeO coincidence cell. (c) Angular orientation of the MgPc symmetry axes with respect to a horizontal line. More than 100 molecules have been included in the statistics shown in (b) and (c). Reprinted with permission from Lin and Nilius (2008), Copyright (2010) by the American Chemical Society.
The binding preference to the FeO hcp domain is almost one order of magnitude larger for MgPc molecules than for Au adatoms (90 meV versus 10 meV) (Lin and Nilius, 2008; Nilius et al., 2005). This finding reflects the superior polarizability of the highly flexible, organic molecule with respect to a single atom. Furthermore, while polarization in the spatially modulated dipole field is the decisive interaction mechanism for MgPc, this contribution competes with true chemical bonding in the case of Au. Because the latter effect is less site-specific, the spatial modulations in the Au binding energy are weaker, and well-defined Au super-lattices only develop at cryogenic temperature. A self-assembly of the MgPc, on the other hand, is observed even at 300 K.
The ordering of MgPc on the FeO film affects not only the spatial distribution, but also the rotational alignment of the organic molecule (Lin and Nilius, 2008). The molecules always bind with one of their two equivalent axes oriented parallel to a close-packed FeO direction. Reflecting the hexagonal symmetry of the oxide support, three molecular orientations are distinguishable on the surface, separated by angles of 30° and 60° (Fig. 11.19c). A rotation by 90°, on the other hand, reproduces the initial binding situation of the fourfold symmetric adsorbate. The self assembly of MgPc on the FeO/Pt(111) system therefore has two aspects: while the spatial distribution is governed by the modulated surface potential within the coincidence cell, the angular alignment is fixed by the interaction of the molecule with the atomic FeO lattice. In general, the adsorption of MgPc to the polar FeO film is a rare example, where self-assembly is not induced by inter-molecular coupling (see, for instance, Dmitriev et al, 2003; Barth et al., 2005), but by a template effect of the oxide support.
11.5 Conclusion and future trends
The adsorption properties of polar oxide surfaces have been discussed for atomic and molecular adsorbates on the FeO/Pt(111) film. In both examples, the uncompensated surface dipole of the oxide film influences considerably the binding behaviour, predominantly by inducing polarization and electrostatic interactions between the ad-species and the oxide support. The binding occurs preferentially in regions with large dipole strength, triggering the formation of long-range ordered adsorbate structures on the oxide surface. Similar behaviour has been reported for comparable systems, e.g. for Cr and Fe aggregates on Fe3O4/Pt(111) and RhO2/Rh(111) films (Berdunov et al., 2006; Gustafson et al., 2004). For many other polar oxides, elucidation of their adsorption behaviour including potential self-assembly effects is still lacking.
In conclusion, polar materials have a number of interesting morphological, electronic and chemical properties that arise from the electrostatic energy stored in those systems. As demonstrated in this chapter, the adsorption behaviour of polar oxides strongly deviates from that of non-polar systems, as the ad-species are partly involved in quenching the energetically unfavourable surface dipole. The resulting adsorption characteristics can be exploited in various technologically relevant applications. The strong adhesion between polar supports and metal adsorbates might be used, for example, to produce ultrathin, homogeneous metal coatings for optical and electronic devices. The observed self-assembly effects on polar surfaces are an interesting starting point to produce ordered arrangements of single atoms, molecules and metal particles. The fabrication of regular arrays of defined entities is highly desirable for applications in molecular electronics, heterogeneous catalysis and chemical sensing. However, the role of the oxide polarity in triggering such ordering phenomena needs to be explored in more detail. Another potential interest in polar systems arises from their unusual chemical properties, which originate from the high surface free energy of such structures. This energy contribution might be temporally released by restructuring the surface during a chemical reaction and can be transferred to the reactants. In a recent study, the polar FeO film was found to be 50 times more reactive than the widely-used Pt catalyst in CO oxidation reactions (Sun et al., 2009). The understanding of the interplay between polarity and chemical properties is, however, just at the beginning and more work is required in the future. However, thin films with polar character will certainly remain in the focus of research in the next few years.
11.7 Acknowledgements
My special thanks go to Hans-Joachim Freund for his constant support and to the members of my group that have contributed to this work: Emile Rienks, Xiao Lin and Philipp Myrach. I am grateful to Gianfranco Pacchioni, Livia Giordano and Jacek Goniakowski for their theoretical insights into polar materials.
11.8 References
Arita, R., Tanida, Y., Entani, S., Kiguchi, M., Saiki, K., Aoki, H. Polar surface engineering in ultrathin MgO(111)/Ag(111): possibility of a metal-insulator transition and magnetism. Phys Rev B. 2004; 69:235423.
Barbier, A., Renaud, G. Structural investigation of the NiO(111) single crystal surface. Surf Sci. 1997; 392:L15–L20.
Barbier, A., Renaud, G., Mocuta, C., Stierle, A. Structural investigation of the dynamics of the NiO(111) surface by GIXS. Surf Sci. 1999; 433:761.
Barbier, A., Mocuta, C., Kuhlenbeck, H., Peters, K.F., Richter, B., Renaud, G. Atomic structure of the polar NiO(111)-p(2 × 2) surface. Phys Rev Lett. 2000; 84:2897–2900.
Barth, J.V., Costantini, G., Kern, K. Engineering atomic and molecular nanostructures at surfaces. Nature. 2005; 437:671–679.
Bäumer, M., Freund, H.J. ‘Metal deposits on well-ordered oxide films’, Prog. Surf Sci. 1999; 61:127–198.
Becker, R.S., Golovchenko, J.A., Swartzentruber, B.S. Electron interferometry at crystal-surfaces. Phys Rev Lett. 1985; 55:987–990.
Berdunov, N., Mariotto, G., Balakrishnan, K., Murphy, S., Shvets, I.V. Oxide templates for self-assembling arrays of metal nanoclusters. Surf Sci. 2006; 600:L287–L290.
Binnig, G., Rohrer, H., Gerber, C., Weibel, E. Tunneling through a controllable vacuum gap. Appl Phys Lett. 1982; 40:178–180.
Bottin, F., Finocchi, F., Noguera, C. Stability and electronic structure of the (1 × 1) SrTiO3(110) polar surfaces by first-principles calculations. Phys Rev B. 2003; 68:035418.
Chen, J.C. Introduction Into Scanning Tunneling Microscopy. New York: Oxford University Press; 1993.
Dmitriev, A., Spillmann, H., Lin, N., Barth, J.V., Kern, K. Modular assembly of two-dimensional metal-organic coordination networks at a metal surface. Angew Chem Int Ed. 2003; 42:2670–2673.
Dulub, O., Diebold, U., Kresse, G. Novel stabilization mechanism on polar surfaces: ZnO(0001)-Zn. Phys Rev Lett. 2003; 90:016102.
Dulub, O., Batzill, M., Diebold, U. Growth of copper on single crystalline ZnO: Surface study of a model catalyst. Top Catal. 2005; 36:65–76.
Finocchi, F., Barbier, A., Jupille, J., Noguera, C. Stability of rocksalt (111) polar surfaces: beyond the octopole. Phys Rev Lett. 2004; 92:136101.
Galloway, H.C., Sautet, P., Salmeron, M. Structure and contrast in scanning tunneling microscopy of oxides: FeO monolayer on Pt(111). Phys Rev B. 1996; 54:11145–11148.
Giordano, L., Martinez, U., Sicolo, S., Pacchioni, G. Observable consequences of formation of Au anions from deposition of Au atoms on ultrathin oxide films. J Chem Phys. 2007; 127:144713.
Giordano, L., Pacchioni, G., Goniakowski, J., Nilius, N., Rienks, E.D.L., Freund, H.J. Interplay between structural, magnetic, and electronic properties in a FeO/Pt(111) ultrathin film. Phys Rev B. 2007; 76:075416.
Giordano, L., Pacchioni, G., Goniakowski, J., Nilius, N., Rienks, E.D.L., Freund, H.J. Charging of metal adatoms on ultrathin oxide films: Au and Pd on FeO/Pt(111). Phys Rev Lett. 2008; 101:026102.
Giovanardi, C., Hammer, L., Heinz, K. Ultrathin cobalt oxide films on Ir(100)-(1 × 1). Phys Rev B. 2006; 74:125429.
Goniakowski, J., Noguera, C. Microscopic mechanisms of stabilization of polar oxide surfaces: transition metals on the MgO(111) surface. Phys Rev B. 2002; 66:085417.
Goniakowski, J., Noguera, C. Polarization and rumpling in oxide monolayers deposited on metallic substrates. Phys Rev B. 2009; 79:155433.
Goniakowski, J., Noguera, C., Giordano, L. Prediction of uncompensated polarity in ultrathin films. Phys Rev Lett. 2007; 98:205701.
Goniakowski, J., Finocchi, F., Noguera, C. Polarity of oxide surfaces and nanostructures. Rep Progr Phys. 2008; 71:016501.
Goniakowski, J., Noguera, C., Giordano, L., Pacchioni, G. Adsorption of metal adatoms on FeO(111) and MgO(111) monolayers: effects of charge state of adsorbate on rumpling of supported oxide film. Phys Rev B. 2009; 80:125403.
Gustafson, J., Mikkelsen, A., Borg, M., Lundgren, E., Kohler, L., Kresse, G., Schmid, M., Varga, P., Yuhara, J., Torrelles, X., Quiros, C., Andersen, J.N. Self-limited growth of a thin oxide layer on Rh(111). Phys Rev Lett. 2004; 92:126102.
Hacquart, R., Jupille, J. Hydrated MgO smoke crystals from cubes to octahedra. Chem Phys Lett. 2007; 439:91–94.
Janczak, J., Kubiak, R. X-ray single crystal investigations of magnesium phthalocyanine. The 4 + 1 coordination of the Mg ion and its consequence. Polyhedron. 2001; 20:2901–2909.
Kiguchi, M., Entani, S., Saiki, K., Goto, T., Koma, A. Atomic and electronic structure of an unreconstructed polar MgO(111) thin film on Ag(111). Phys Rev B. 2003; 68:115402.
Kim, Y.J., Westphal, C., Ynzunza, R.X., Galloway, H.C., Salmeron, M., van Hove, M.A., Fadley, C.S. Interlayer interactions in epitaxial oxide growth: FeO on Pt(111). Phys Rev B. 1997; 55:13448–13451.
Kitakatsu, N., Maurice, V., Marcus, P. Local decomposition of NiO ultra-thin films formed on Ni(111). Surf Sci. 1998; 411:215–230.
Kittel, C. Introduction to Solid State Physics. New York: Wiley; 1996.
Knudsen, J., Merte, L.R., Grabow, L.C., Eichhorn, F.M., Porsgaard, S., Zeuthen, H., Vang, R.T., Lffigsgaard, E., Mavrikakis, M., Besenbacher, F. Reduction of FeO/Pt(111) thin films by exposure to atomic hydrogen. Surf Sci. 2010; 604:11–20.
Kolesnychenko, O.Y., Kolesnichenko, Y.A., Shklyarevskii, O., van Kempen, H. Field-emission resonance measurements with mechanically controlled break junctions. Physica B. 2000; 291:246–255.
Koplitz, L.V., Dulub, O., Diebold, U. STM study of copper growth on ZnO(0001)-Zn and ZnO(0001)-O surfaces. J Phys Chem B. 2003; 107:10583–10590.
Kresse, G., Dulub, O., Diebold, U. Competing stabilization mechanism for the polar ZnO(0001)-Zn surface. Phys Rev B. 2003; 68:245409.
Kroll, M., Köhler, U. Small Cu-clusters on ZnO(0001)-Zn: nucleation and annealing behavior. Surf Sci. 2007; 601:2182.
Kulawik, M., Rust, H.P., Heyde, M., Nilius, N., Mantooth, B.A., Weiss, P.S., Freund, H.J. Interaction of CO molecules with surface state electrons on Ag(111). Surf Sci. 2005; 590:L253–L258.
Lin, X., Nilius, N. Self-assembly of MgPc molecules on polar FeO thin films. J Phys Chem C. 2008; 112:15325–15328.
Mantilla, M., Jedrecy, N., Lazzari, R., Jupille, J. Oxidation of Mg/Ag(111) investigated using scanning tunneling microscopy: towards atomically smooth MgO nanostructures. Surf Sci. 2008; 602:3089–3094.
Maurice, V., Cadot, S., Marcus, P. Hydroxylation of ultra-thin films of alpha-Cr2O3(0001) formed on Cr(110). Surf Sci. 2001; 471:43–58.
Merte, L.R., Knudsen, J., Grabow, L.C., Vang, R.T., Laegsgaard, E., Mavrikakis, M., Besenbacher, F. Correlating STM contrast and atomic-scale structure by chemical modification: vacancy dislocation loops on FeO/Pt(111). Surf Sci. 2009; 603:L15–L18.
Meyer, B., Marx, D. Density-functional study of Cu atoms, monolayers, films, and coadsorbates on polar ZnO surfaces. Phys Rev B. 2004; 69:235420.
Myrach, P., Benedetti, S., Valeri, S., Nilius, N., Freund, H.J. Investigating polarity healing mechanisms at the atomic scale: MgO on Au(111, 2011. [forthcoming].
Nilius, N. Properties of oxide thin films and their adsorption behavior studied by scanning tunneling microscopy and conductance spectroscopy. Surf Sci Rep. 2009; 64:595–659.
Nilius, N., Rienks, E.D.L., Rust, H.P., Freund, H.J. Self-organization of gold atoms on a polar FeO(111) surface. Phys Rev Lett. 2005; 95:066101.
Noguera, C. Physics and Chemistry at Oxide Surfaces. Cambridge: Cambridge University Press; 1996.
Olesen, L., Brandbyge, M., Sorensen, M.R., Jacobsen, K.W., Laegsgaard, E., Stensgaard, I., Besenbacher, F. Apparent barrier height in scanning tunneling microscopy revisited. Phys Rev Lett. 1996; 76:1485–1488.
Ostendorf, F., Torbrugge, S., Reichling, M. Atomic scale evidence for faceting stabilization of a polar oxide surface. Phys Rev B. 77, 2008. [R041405].
Pacchioni, G., Giordano, L., Baistrocchi, M. Charging of metal atoms on ultrathin MgO/Mo(100) films. Phys Rev Lett. 2005; 94:226104.
Parker, T.M., Condon, N.G., Lindsay, R., Leibsle, F.M., Thornton, G. Imaging the polar (0001) and non-polar (1010) surfaces of ZnO with STM. Surf Sci. 1998; 415:L1046–L1050.
Parteder, G., Allegretti, F., Surnev, S., Netzer, F.P. Growth of cobalt on a VO(111) surface: template, surfactant or encapsulant role of the oxide nanolayer? Surf Sci. 2008; 602:2666–2674.
Persson, M. Adsorption-induced constraint on delocalization of electron states in an Au chain on NiAl(110). Phys Rev B. 72, 2005. [R081404].
Pojani, A., Finocchi, F., Goniakowski, J., Noguera, C. A theoretical study of the stability and electronic structure of the polar 111 face of MgO. Surf Sci. 1997; 387:354–370.
Poon, H.C., Hu, X.F., Chamberlin, S.E., Saldin, D.K., Hirschmugl, C.J. Structure of the hydrogen stabilized MgO(111)-(1 X 1) surface from low energy electron diffraction (LEED). Surf Sci. 2006; 600:2505–2509.
Rienks, E.D.L., Nilius, N., Rust, H.P., Freund, H.J. Surface potential of a polar oxide film: FeO on Pt(111). Phys Rev B. 2005; 71:241404.
Rienks, E.D.L., Nilius, N., Giordano, L., Goniakowski, J., Pacchioni, G., Felicissimo, M.P., Risse, T., Rust, H.P., Freund, H.J. Local zero-bias anomaly in tunneling spectra of a transition-metal oxide thin film. Phys Rev B. 2007; 75:205443.
Ritter, M., Ranke, W., Weiss, W. Growth and structure of ultrathin FeO films on Pt(111) studied by STM and LEED. Phys Rev B. 1998; 57:7240–7251.
Rohr, F., Wirth, K., Libuda, J., Cappus, D., Baumer, M., Freund, H.J. Hydroxyl driven reconstruction of the polar NiO(111) surface. Surf Sci. 1994; 315:L977–L982.
Ruan, C.Y., Mastryukov, V., Fink, M. Electron diffraction studies of metal phthalocyanines, MPc, where M = Sn, Mg, and Zn (reinvestigation). J Chem Phys. 1999; 111:3035–3041.
Schoiswohl, J., Surnev, S., Sock, M., Eck, S., Ramsey, M.G., Netzer, F.P., Kresse, G. Reduction of vanadium-oxide monolayer structures. Phys Rev B. 2005; 71:165437.
Sedona, F., Rizzi, G.A., Agnoli, S., Xamena, F., Papageorgiou, A., Ostermann, D., Sambi, M., Finetti, P., Schierbaum, K., Granozzi, G. Ultrathin TiOx films on Pt(111): a LEED, XPS, and STM investigation. J Phys Chem B. 2005; 109:24411–24426.
Silly, F., Pivetta, M., Ternes, M., Patthey, F., Pelz, J.P., Schneider, W.D. Creation of an atomic superlattice by immersing metallic adatoms in a two-dimensional electron sea. Phys Rev Lett. 2004; 92:016101.
Sun, Y.N., Qin, Z.H., Lewandowski, M., Carrasco, E., Sterrer, M., Shaikhutdinov, S., Freund, H.J. Monolayer iron oxide film on platinum promotes low temperature CO oxidation. J Catal. 2009; 266:359–368.
Tasker, P.W. Stability of ionic-crystal surfaces. J Phys C. 1979; 12:4977–4984.
Tusche, C., Meyerheim, H.L., Kirschner, J. Observation of depolarized ZnO(0001) monolayers: formation of unreconstructed planar sheets. Phys Rev Lett. 2007; 99:026102.
Vurens, G.H., Salmeron, M., Somorjai, G.A. Structure, composition and chemisorption studies of thin ordered iron-oxide films on platinum(111). Surf Sci. 1988; 201:129–144.
Wang, X.G., Chaka, A., Scheffler, M. Effect of the environment on alpha-Al2O3 (0001) surface structures. Phys Rev Lett. 2000; 84:3650–3653.
Wang, Y. High resolution electron energy loss spectroscopy on perfect and defective oxide surfaces. Z Phys Chem. 2008; 222:927–964.
Wang, Y., Meyer, B., Yin, X., Kunat, M., Langenberg, D., Träger, F., Birkner, A., Wöll, C. Hydrogen induced metallicity on the ZnO(1010) surface. Phys Rev Lett. 2005; 95:266104.
Witte, G., Wöll, C. Growth of aromatic molecules on solid substrates for applications in organic electronics. J Mater Res. 2004; 19:1889–1916.
Wolf, D. Reconstruction of NaCl surfaces from a dipolar solution to the madelung problem. Phys Rev Lett. 1992; 68:3315–3318.
Yin, X.L., Birkner, A., Hanel, K., Lober, T., Kohler, U., Wöll, C. Adsorption of atomic hydrogen on ZnO(1010): STM study. Phys Chem Chem Phys. 2006; 8:1477–1481.
11.6 Sources of further information and advice
For more detailed information on the topic, the reader is referred to the books and review articles listed below:
Noguera C (1996), Physics and Chemistry at Oxide Surfaces, Cambridge University Press.
Noguera C (2000), ‘Polar oxide surfaces’, Journal of Physics – Condensed Matter 31, R367.
Goniakowski J, Finocchi F and Noguera C (2008), ‘Polarity of oxide surfaces and nanostructures’, Reports on Progress in Physics 71, 016501.
Dillmann B, Rohr F, Seiferth O, Klivenyi G, Bender M, Homann K, Yakovkin IN, Ehrlich D, Bäumer M, Kuhlenbeck H and Freund H-J (1996), ‘Adsorption on a polar oxide surface: Cr2O3(0001)/Cr(110)’, Faraday Discussion 105, 295.