
Destinations
LEARNING OBJECTIVES
After studying this chapter, you should be able to:
describe and explain the relative status of the advanced economies and emerging economies as tourist destination regions
identify the major generic factors that attract or ‘pull’ visitors to tourist destinations
discuss the extent to which destination managers and other tourism stakeholders can influence these pull factors
describe and explain the status of tourism in each of the world’s major regions, and assess the pull factors that have contributed to these patterns
account for the tendency of tourism at all scales to develop in a spatially uneven pattern and discuss the implications of this tendency
identify and account for the basic pattern of inbound and domestic tourism within Australia.
84
 INTRODUCTION
Chapter 3 described the remarkable growth of contemporary international and domestic tourism from a demand perspective, without reference to the destinations that are the focus of this growth. This chapter addresses the supply perspective by considering the spatial variations in the growth and distribution of tourism among and within the world’s major regions, and the factors that underlie these patterns. The following section examines these variations at the most basic level by describing the global inequality in tourism that exists between advanced and emerging economies. The major factors that have stimulated or hindered the development of tourism in each of these two ‘macro-regions’ are also discussed in this section, but the ‘Pull factors influencing a destination’ section considers the generic factors that draw tourists to destinations in general. The ‘Regional destination patterns’ section describes the tourism situation in each of the world’s major geographical regions and examines the pull factors (or lack thereof) that apply in each case. The spatial characteristics of tourism within individual countries are outlined in the final section.
GLOBAL DESTINATION PATTERNS: ADVANCED AND EMERGING ECONOMIES
The world is roughly divided into two ‘macro-regions’ based on relative levels of economic development and associated sociodemographic characteristics such as social structure and fertility rates. The advanced economies (collectively constituting the ‘more developed world’) correspond with Burton’s late Phase Three and Phase Four countries (see chapter 3). Classified as such by the International Monetary Fund (IMF), they include Australia, New Zealand, the United States, Canada, Israel, Japan, South Korea, Hong Kong, Macao, Taiwan, Singapore and Western European countries. Several Eastern European countries (e.g. Czech Republic, Estonia, Slovakia and Slovenia) are also included because of their rapid economic growth since the collapse of the Soviet Union and its orbit of client states.
The emerging economies (or cumulatively the ‘less developed world’) are synonymous with those still situated in Burton’s Phase Two and early Phase Three. The major less developed regions are Latin America and the Caribbean, most of Asia (including China), Africa and the islands of the Pacific and Indian oceans. Wealthy Middle Eastern oil-producing states, including Libya, Kuwait and Saudi Arabia, are included in this category despite their high per capita incomes. This is in part because of highly skewed economies (i.e. fossil fuels account for almost all export earnings) and social indicators (such as higher fertility and infant mortality rates) that suggest residual Phase Two dynamics. The designation of countries into either category, by convention and perception, remained remarkably stable during the latter half of the twentieth century except for Eastern Europe and the ‘tiger’ economies of Hong Kong, Taiwan, Singapore and South Korea. Any such country-wide designations, however, should be qualified by the presence of emerging spaces within advanced economies (e.g. Indigenous reserves in Australia) and vice versa.
Tourism market share and growth
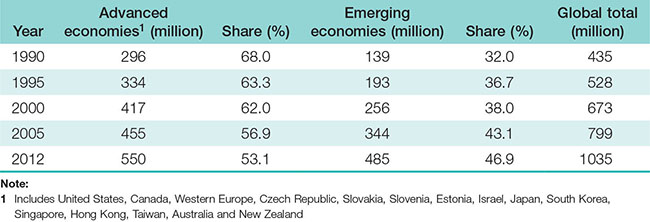
Table 4.1 depicts the status of the advanced and emerging economies as recipients of inbound tourism for selected years in the period between 1990 and 2012. As of 2012, the advanced economies accounted for a bare majority of international stayover arrivals, having experienced continuous erosion of such arrivals since 1990. By comparison, the 85share of this region prior to 1970 was approximately 90 per cent. What will probably arrest this decline in coming decades is the anticipated transformation of countries such as China, Turkey and Brazil from emerging to advanced status.
TABLE 4.1 International stayover arrivals by advanced and emerging economies, 1990–2012
Source: UNWTO (2012a)
Reasons for the proliferation of the emerging economies as destinations
Many factors have combined to elevate the emerging economies into the position of an increasingly prominent destination macro-region. However, particularly important are changing consumer preferences in the major international tourist markets, and economic growth within the emerging economies themselves.
Demand for 3S tourism: the emergence of the pleasure periphery
Seaside resorts were already established as tourist destinations in the era of the Roman Empire, but became especially important within Europe, North America and Australia in conjunction with the Industrial Revolution (see chapter 3). Nineteenth-century limitations in technology as well as discretionary income and time restricted the development of these resorts to domestic coastal locations close to expanding urban markets. However, dramatic twentieth-century advances in air transportation technology have combined with the overall development process and changing social perceptions to greatly extend the distribution, scale, and market range of seaside resorts. This modern phase of expansion in 3S tourism (i.e. sea, sand and sun) initially affected the warmer coastal regions of the more developed countries. Among the destination regions spawned by this trend were the French, Italian and Spanish Rivieras, the east coast of Florida (and the American sunbelt in general), the southern coast of Brazil, Australia’s Gold Coast and Japan’s Okinawa Island. Tourism development subsequently spread into adjacent parts of the Mediterranean, Caribbean, Atlantic, South Pacific and Indian Ocean basins.
The expansion of 3S tourism occurred at such a rate and extent that it was possible by the mid-1970s to discern the emergence of a pan-global pleasure periphery (Turner & Ash 1975). ‘Pleasure’ captures the hedonistic nature of the 3S product, while ‘periphery’ alludes to the marginal geographic and economic status of its constituent subregions, which straddle the advanced and emerging economies (figure 4.1). The Mediterranean basin is the oldest and largest (in terms of visitation) subcomponent, followed by the Caribbean basin. Less geographically coherent is a band of more recently developed 3S destinations extending from the South Pacific through 86South-East Asia, coastal Australia and the Indian Ocean basin. Notable among these are the southern Chinese island-province of Hainan and the south-western Indian state of Kerala, where 3S tourism development is progressing rapidly but primarily in response to the explosive growth in the domestic rather than inbound tourism market. Domestic dynamics are also driving the rapid development of Brazil’s coastal pleasure periphery (see the case study at the end of this chapter).
FIGURE 4.1 The pleasure periphery
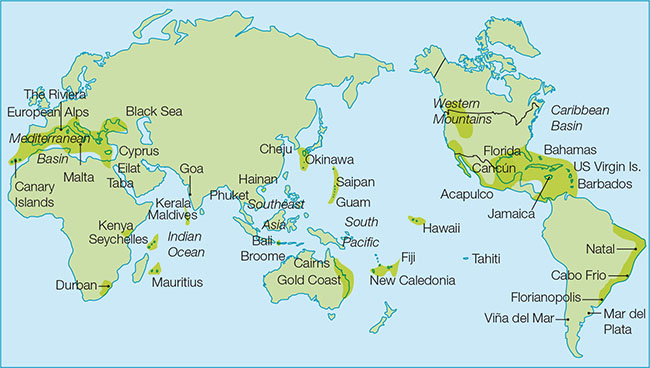
Market preferences for 3S tourism in the advanced economies have led to the disproportionate importance of small island states or dependencies (SISODs), such as Fiji, Barbados and the Seychelles, as pleasure periphery destinations (Carlsen & Butler 2011). Specifically, the world’s 67 SISODs account for only 0.3 per cent of the global population and a miniscule percentage of the world’s land area, but around 5 per cent of total international stayover arrivals.
Although best known for its 3S opportunities, the pleasure periphery has expanded to incorporate other types of tourism product. Skiing and other alpine-based winter sporting activities are now widespread in the North American Rockies, European Alps and the southern Andes, while wildlife-based activities are becoming increasingly important in destinations such as Kenya, Australia, New Zealand, Thailand and Costa Rica (see chapter 11).
Growth of emerging economies
Inbound tourist traffic into the emerging economies, and into the pleasure periphery in particular, traditionally occurred as a north–south flow involving North American, European and Japanese travellers. For Australians and New Zealanders the direction of flow is reversed, although the labels are still valid to the extent that the advanced economies together are sometimes symbolically referred to as the ‘North’. This pattern, however, is now eroding due to accelerated economic growth within the emerging economies, which is generating a significant outbound tourist market among its emergent middle and upper classes, and creating greater complexity in the global tourism system. As noted in 87chapter 3, the middle classes in Phase Three societies tend to visit nearby countries but begin to extend their visits to more prestigious long-haul destinations, often within the more developed world. The net result is that much of the inbound tourism growth in the emerging economies is accounted for by arrivals from other (usually nearby) emerging economies. In effect, the stereotype of the Australian tourist in Bali, or the Japanese tourist in Thailand is being challenged by the Brazilian tourist in Argentina, the Indian tourist in Dubai, the Chinese tourist in Malaysia and the Zambian tourist in Mozambique.
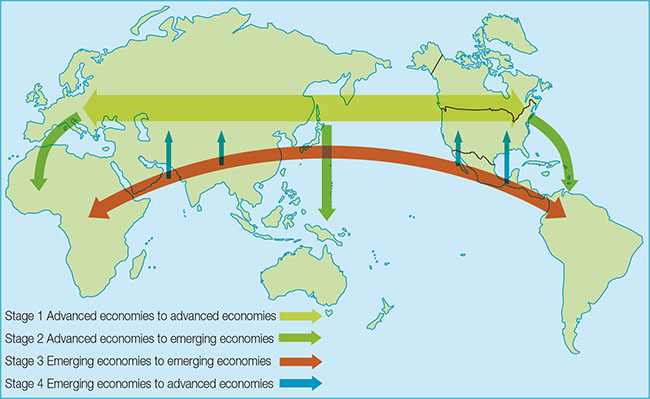
This movement of international tourists within the less developed world may be characterised as the third geographical stage of international tourism in the contemporary era. The stages are as follows:
The first stage, involving the movement of international tourists within the more developed world, emerged in the post–World War II period and still accounts for perhaps half of all traffic (i.e. the 52 per cent share indicated in table 4.1 minus the approximately 2 per cent who are residents of emerging economies travelling to advanced economies — see figure 4.2).
The second stage, largely associated with the emergence of the pleasure periphery after the late 1960s, involves movements of people from advanced economies to emerging economies. Approximately 25 per cent of international stayover traffic presently falls into this category.
The third stage, involving traffic from one emerging economy to another, accounts for perhaps 20 per cent of all tourism but has the greatest growth potential. The realisation of this potential, however, will mean that many of these countries will have been reclassified as advanced economies.
An emergent fourth stage, accounting for about 2 per cent of international tourism flows, involves residents of emerging economies visiting the advanced economies. Examples include the rapidly increasing growth in Chinese visitors to Australia and New Zealand.
FIGURE 4.2 Four stages of contemporary international tourist flows
88
PULL FACTORS INFLUENCING A DESTINATION
Two of the major forces (i.e. the fashionability of 3S tourism, and internal economic development) that have stimulated growth in the less developed world’s share of the inbound tourist market have been explored. Consideration will now be given to the general factors that can potentially encourage or discourage tourist traffic to any particular destination. These pull factors differ from the push factors outlined in chapter 3 in being focused on the supply side of tourism (i.e. product or destination-based forces) rather than on tourist demand (i.e. market or origin-based forces). As with the push factors, the use of the term ‘pull’ is metaphorical rather than literal.
One important implication of this geographical differentiation between supply and demand is that destinations are better positioned to exert influence over the pull factors than they are over the push factors. For example, a destination does not normally influence whether another country evolves into a significant tourist-generating market, but it can take tangible measures to develop its supply of attractions and create a welcoming environment to attract potential visitors from that market. This issue of control will be considered in the discussion of each individual factor. No priority is intended in the order that these factors are presented, since the combination and relative importance of individual factors will vary between destinations.
Geographical proximity to markets
Controlling for all other factors, an inverse relationship is likely to exist between the volume of traffic flowing from an origin region to a destination region and the distance separating the two. That is, the number of visitors from origin X to destination Y will decrease as distance increases between X and Y, owing to higher transportation costs and longer travel times. This is known as a distance–decay effect (Lee et al. 2012). The volume of traffic will also be proportional to the size and prosperity of the origin region market, with large and wealthy markets from advanced economies generating larger potential flows (see Managing tourism: Visiting the neighbours).
managing tourism
 VISITING THE NEIGHBOURS

Enthusiasm about the burgeoning Chinese outbound market in countries such as Australia is warranted, but should be tempered by the consideration that most such tourists remain very close to home. In 2011, 28.3 million visits were made from China to Hong Kong and 19.8 million to Macau, together accounting for 68 per cent of all outbound trips from China. South Korea was a distant third with 2.37 million visits, a 3.4 per cent share (COTRI 2012). Attractive because of their proximity and Chinese cultural affinities, Hong Kong and Macau were the first ‘foreign’ destinations to be opened to Chinese 89 tour groups in the early 1980s, and the first to have the Individual Visit Scheme (IVS) introduced in 2003, which allows visits from free and independent travellers (FITs). For both Hong Kong and Macau, the Chinese outbound market accounts for two-thirds or more of all arrivals, indicating a very high level of dependency. Visitation to Taiwan, however, is more embryonic since although it is also close by and Chinese in culture, matters are complicated by political tensions with a mainland government that regards it as a renegade province. Nevertheless, geopolitical pragmatism on the part of both governments led to Taiwan’s emergence in 2011 as the fourth largest destination, with 1.85 million visits and a 2.5 per cent share of the market (TravelChinaGuide.com 2012). For the mainland Chinese government, mass contact between the two peoples represents a normalisation of relations that will facilitate eventual reunion. For the Taiwanese, Chinese tourism is a lucrative source of revenue and provides an opportunity to showcase the prosperity and independence of their island. Many mainland Chinese, for example, visit the mausoleum of Chiang Kai-Shek, the founder of the renegade Taiwan state, and are encouraged to show respect (Mishkin 2012). At popular tourist hotspots such as Sun Moon Lake, Chinese tourists are greeted by protesters waving the flag of independent Tibet — a criminal act on the mainland. China will continue to encourage visits to Taiwan, however, as long as it is perceived as a force for domestic stability and eventual reunification.
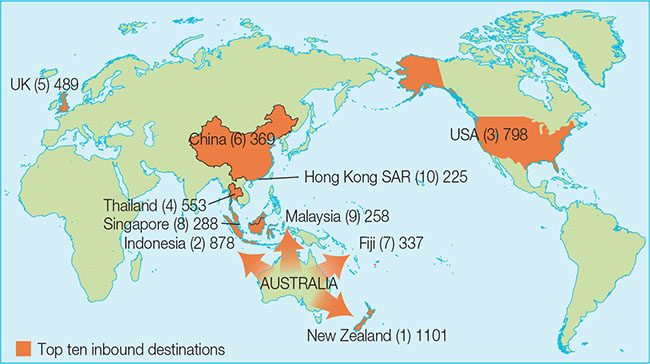
These basic relationships are discernible throughout the world. The Caribbean, Mediterranean and South-East Asian subregions of the pleasure periphery, for example, have traditionally been dominated respectively by American, European and Japanese outbound tourists. A distance–decay relationship is evident as well in the pattern of Australian outbound travel, with eight of the top ten destinations in both 2007 and 2011 being located in Oceania or Asia (figures 4.3 and 4.4). The changes in the rankings during this five-year interval also attest to the volatility of such patterns, as evidenced by the removal of Japan from the top ten in 2011, the addition of Fiji and the climbing rank of Indonesia. Although not apparent in either figure, the distance–decay effect also influences Australian outbound travel to the United States, where most visits are concentrated in the Pacific and western states of Hawaii, California and Nevada (the state where Las Vegas is located). Destination managers cannot alter the location of their city or country relative to the market, but distance can serve as an incentive (or disincentive if the distance is short) to pursue strategies such as more aggressive marketing that will help to compensate for this effect. These strategies may include attempts to reduce the psychological distance between the destination and target origin regions. Geographical proximity, however, is likely to become an increasingly important pull factor if energy costs continue to increase.
Accessibility to markets
The effects of distance can also be reduced by initiatives that make destinations more accessible to origin regions. Structural accessibility refers to the availability and quality of transportation linkages such as air routes, highways and ferry links within transit regions, and of gateway facilities such as seaports and airports within the destination and origin regions. The level of structural accessibility in a destination depends on many factors, including the availability of funds, physical barriers (including distance itself) and cooperation with other destinations as well as intervening jurisdictions in the transit region to establish effective air, land and/or water linkages.
90FIGURE 4.3 Main destinations for Australian outbound tourists, 2007 (year ending March)
Notes:
1 Rank of countries in parentheses.
2 Number beside country equals number of Australian outbound tourists received (in thousands).
Source: Data derived from TRA 2007a
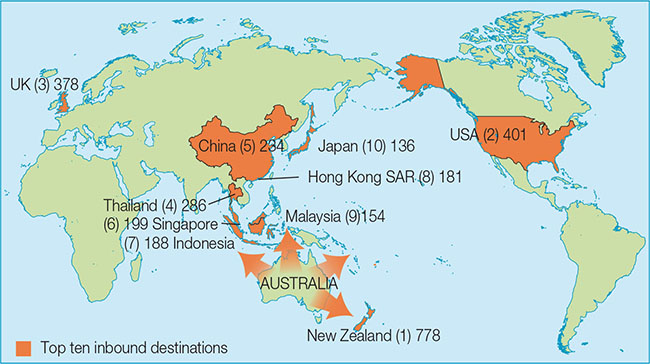
FIGURE 4.4 Main destinations for Australian outbound tourists, 2011
Notes:
1 Rank of countries in parentheses.
2 Number beside country equals number of Australian outbound tourists received (in thousands).
Source: Data derived from TRA 2012
Political accessibility refers to the conditions under which visitors are allowed entry into a destination. Except in totalitarian states such as North Korea, where severe restrictions on internal travel are imposed, political access is not a significant issue in domestic tourism. However, it is critical in international tourism. The right to allow or deny entry to potential arrivals from other countries is a basic sovereign prerogative 91of all states, as discussed in chapter 2. In some cases this right has been eroded or conceded altogether through bilateral or multilateral treaties. Citizens and permanent residents of Australia and New Zealand, for example, share a reciprocal right to reside in each other’s country for an indefinite period of time, conditional upon good behaviour. On a larger scale, the opening of boundaries between the countries of the European Union has meant that travel between Sweden and Finland or the United Kingdom and France is no longer mediated by any border formalities, and is therefore equivalent in effect to domestic tourism (Prokkola 2010). Such initiatives in border liberalisation, however, became subject to new scrutiny and criticism following the New York terrorist attacks of 11 September 2001, given their effect of expediting the movements of individuals involved with terrorism. There is now a greater possibility, for example, that a ‘Fortress Europe’ will emerge wherein internal border liberalisation will be accompanied by the tightening of borders with adjacent countries in Eastern Europe and North Africa. Borders, therefore, remain a potentially formidable barrier to international tourist movements, and political access remains one of the pull factors over which destination countries (though not subnational destinations) can exercise a high level of control (Timothy 2012).
Government and the tourism industry often differ in their perceptions of the degree to which borders should be opened to inbound tourism. The immigration and security arms of national governments tend to favour stricter border controls (especially since September 2001), on the assumption that some international visitors may attempt to gain illegal entry or constitute a potential threat to the state in terrorism-related or other ways. In contrast, the business sector views tourists as potential customers, and is therefore supportive of more open borders and an internationally recognised right to travel. This view is usually shared by government departments responsible for the development and promotion of the tourism sector, if such bodies exist within that state. Most destination countries compromise between completely closed and completely open borders by requiring visitors to produce passports or visas and, in some cases, evidence of a local address and return fare.
Availability of services
The availability of hotels, restaurants, visitor bureaus and other specialised services and facilities is a type of structural accessibility, though sufficiently distinct from transportation-related phenomena to warrant separate consideration. Most tourists will avoid attractions if affiliated services are unavailable, overpriced or of poor quality. At a broader destination level, the presence of basic services non-specific to tourism — such as policing and medical facilities — is also essential. The private sector usually provides the tourism-related elements (except for visitor bureaus), while general services are provided by local governments (e.g. policing) or the private sector (e.g. banks). In general, the advanced economies are able to offer a superior level of general service provision because of their greater wealth and higher level of physical development.
Availability of attractions
A detailed discussion of tourist attractions is provided in chapter 5, but several introductory comments are appropriate here in relation to their pull effect and the question of control. There is widespread agreement among tourism researchers that attractions, because of their crucial role in drawing tourists, are the most important component of the tourism system, and a major factor around which the development of a destination will depend (Goeldner & Ritchie 2012). Attractions include specific features such as 92theme parks and battlefields, and generic or non-specific features such as scenery and climate that cover a much larger territory. The presence of friends and relatives as well as business opportunities, which foster VFR (visits to friends and relatives) and business-related tourist flows respectively, are not normally included in the scope of ‘attractions’ although in a literal sense they do attract certain types of tourist, and facilitate interaction with other attractions (e.g. friends taking a visitor to a local theme park). The ability of attractions to draw visitors depends among other factors on their quality, quantity, diversity, uniqueness, carrying capacity, market image and accessibility (see chapter 5).
Pre-existing and created attractions
With regard to the issue of the control that a destination has over its tourism assets, attractions range from those that are ‘pre-existing’ to those that are entirely ‘created’. Examples of the former include climate and spectacular topographical or hydrological features (e.g. Uluru or Niagara Falls), or significant historical sites (e.g. the Hastings or Waterloo battlefields). Such features already exist independent of any tourism context, and it is really only a question of the extent to which tourism managers and planners exploit the available opportunities that they present. On the other hand, destinations usually possess a great deal of latitude for creating attractions to induce a tourist flow or augment the pre-existing attractions. Examples of augmentation can be found on the Gold Coast, where outstanding inherent natural attractions are supplemented by theme parks, shopping opportunities and other ‘built’ attractions that contribute to experience diversity. In some cases a locality with no significant inherent attractions may emerge as a major destination through the effective introduction of such ‘built’ opportunities. High profile examples from the United States include Disney World, established in the midst of a nondescript scrub pine and pasture landscape in central Florida, and Las Vegas, the well-known gambling, convention and entertainment venue in the Nevada desert. On a much smaller scale, certain Australian towns and cities have become known among tourists for their larger-than-life models of local symbols, including the Big Banana at Coffs Harbour, Nambour’s Big Pineapple and Ballina’s Big Prawn. Communities also have considerable scope for establishing events and festivals, usually on an annual basis, that may or may not focus on the local culture, economy or climate.
A final point to be made here about attractions is their susceptibility to fashion and social change, suggesting again that the ability of a destination to attract tourists is always subject to demand-side factors beyond its control. For instance, the emergence of the pleasure periphery was in large part a consequence of the high value assigned to sun exposure by Western societies during the latter half of the twentieth century, which converted beaches and warm climates into tourism resources. Throughout most of human history, the idea of lying on a beach to gain a suntan would have been considered ludicrous. Should sun exposure once again become unpopular due to concerns over its relationship to skin cancer and accelerated skin ageing, then the implications for 3S destinations such as the Gold Coast, and Australia in general, could be ominous as tourism managers are forced to reinvent or abandon their product base. This might, for example, require 3S destinations to place more emphasis on contrived cultural attractions or wildlife-based tourism (see chapter 11).
Cultural and spiritual links
A desire to seek out exotic and unfamiliar venues has been an important motivating force for tourism throughout history. However, similarities in culture, language and religion also exert a powerful ‘pull’ influence in some types of tourism. This is partly 93because of the increased likelihood that people will migrate to culturally familiar countries (e.g. Finnish people to Sweden, British people to Australia) and subsequently foster VFR tourist flows between their old and new countries. Close cultural links are the main factor underlying the status of the distant United Kingdom as an important destination for outbound Australian tourists (figures 4.3 and 4.4).
Immigration aside, religious links have generated significant spiritually motivated tourist flows, as illustrated by robust movements of American Jews to Israel, Muslim pilgrims to Saudi Arabia, Iranian Shi’ite visitors to Iraq, and Roman Catholics to Rome and Vatican City. In addition, the tendency of destinations to attract culturally similar markets attests to the importance of the convenience and risk-minimisation factors in tourism. Simply put, many tourists feel insecure or inconvenienced by having to cope with unfamiliar languages and social norms, and therefore prefer destinations similar to their own origin areas (see chapter 6). Every tourist, in effect, has to negotiate their own individual middle ground between the acceptance and avoidance of risk.
Affordability
All other factors being equal, reductions in cost generate increased tourist traffic to a destination, as demonstrated by the effect of distance on transportation costs. The cost of living in a destination region relative to an origin area is one important component, since a high proportion of total trip costs are normally incurred within the destination through food and accommodation expenditures. Many travellers from the more affluent countries are attracted to emerging economies such as Indonesia, Thailand or Costa Rica because of the low relative costs of locally denominated goods and services. However, this advantage may be lost in situations where accommodation and other tourist-related goods and services are priced in American dollars or other nonlocal currencies. Tourist flows, nevertheless, are sensitive to significant exchange rate fluctuations, as demonstrated by dramatic increases in the number of outbound Australians during the mid-2000s and concomitant stagnation in international tourist arrivals associated with the strong Australian dollar.
Destination managers can do little to influence cost of living differentials, given that these result from macrolevel forces such as the development process and global or regional economic dynamics, including the rapid economic growth of China and India. The situation is somewhat different with respect to exchange rates, as national governments can and do intervene in the money markets, or announce radical currency revaluations, when such actions are deemed to be in the national interest. Destinations within a currency bloc (such as most of the European Union), or within a country, however, have no such power. When a high national or bloc currency places the industry at a disadvantage, managers at the provincial or local level can attempt to offset its potentially negative effects through the implementation of price reductions and other incentives. For example, when the Canadian dollar was worth substantially less than the US dollar, American businesses commonly accepted the lower Canadian dollar at par to attract Canadian tourists. Alternatively, managers may restructure their marketing campaigns to attract higher-end markets that are less sensitive to price.
Peace, stability and safety
The tourist market is sensitive to any suggestion of social or political instability within a destination, given the in situ or ‘on site’ nature of consumption inherent to tourism — that is, consumers must travel to the product in order to engage in its ‘consumption’. Accordingly, and not surprisingly, significant declines in tourist arrivals occur during 94periods of warfare or other conflicts. In Israel, inbound arrivals during the first six months of 2001 were 53 per cent lower than during the comparable period one year earlier, due to the escalation in violence between the Israelis and Palestinians during the Second Intifada. One consequence was that the proportion of domestic guests in Israeli hotels increased from 53 per cent in September 2000 to 86 per cent in March 2002 (Israeli & Reichel 2003). Inbound arrivals in Lebanon, similarly, tend to fluctuate in concert with outbreaks of internal sectarian conflict (Issa & Altinay 2006).
The negative effect of war on tourism, moreover, is not necessarily confined to the actual war zone or period of conflict. The small decline in cumulative international stayover arrivals during 2003 (see table 3.1), for example, was due in large part to global uncertainty associated with both the prelude and aftermath of the invasion of Iraq by the United States.
Tourism-directed terrorism
The deliberate targeting of tourists and tourism facilities by terrorists is an increasingly disturbing trend that has resulted from several factors (Larsen 2011; Smith, V. 2004). Among these is the knowledge that the disruption of tourist flows can have severe economic and sociopolitical repercussions in countries where this sector makes a significant contribution to GNP. This was the main intent of the radical Islamic groups that launched a series of attacks on foreign tourists in Egypt during the 1990s. Similarly, the bombings of two nightclubs in Bali by Muslim radicals in 2002, which killed 200 people and injured another 300, had the desired effect of temporarily reducing hotel occupancy rates from 75 to 10 per cent in some parts of the island (Henderson 2003). A bomb attack in Bulgaria on 18 July 2012 killed five Israeli tourists, and normal levels of Israel tourism to the country were re-established one month later only because of high level intervention by both governments to restore visitor confidence (Novinite.com 2012). Non-visitation following such incidents is interesting given the extremely small risk of being personally killed or injured by a terrorist attack, whereas the much greater probability of suffering serious injuries or death from car accidents has had little dissuasive effect on holiday travel decisions in countries such as Australia (Larsen 2011). These attacks on foreigners (and wealthy, white foreigners in particular) are guaranteed to generate the publicity and media coverage sought by terrorist groups, while tourists and tourism facilities make easy and ‘cost-effective’ targets compared with military and political sites that are better secured against terrorist attacks.
An extremely important factor is the expansion of tourism into some remote areas of the pleasure periphery where insurgent and terrorist groups are already established and where it is difficult to ensure the security of visitors. On occasion, tourists have become attractive targets for kidnappers because of the ransom payments they generate. The kidnapping and subsequent release of 9 foreign tourists in Colombia’s Tayrona National Park by leftist guerillas in 2003 is illustrative (Ospina 2006). As of 2013, the Sahel and Sahara regions of Africa were also areas where foreign tourists were exposed to a high risk of attack and abduction by Islamic extremists.
Other personal safety issues
Beyond the macro-level forces of war, unrest and terrorism, destination viability is affected by the extent to which tourists perceive a place to offer a high level of personal safety in terms of everyday health and wellbeing. Dissuasive factors include high crime levels (see chapter 9), susceptibility to natural disasters such as earthquakes and hurricanes, unsafe drinking water and food, and the prevalence of diseases such as malaria and AIDS. In the aftermath of the 2004 Indian Ocean tsunami, hotel managers 95in Thailand have had to find a balance between providing sufficient warning and safety facilities, and avoiding a pervasive sense of unease among guests as to the attendant levels of risk. Notably, the 2011 tsunami in Fukushima, Japan, generated elevated levels of risk concern among hotel guests in Thailand despite the geographical distance between the two locations (Rittichainuwat 2013). Tourist deaths and injuries associated with traffic-related and other accidents can also generate negative market perceptions, prompting some destinations to pursue strategies that attempt to minimise their occurrence. The Commonwealth and state governments of Australia, for example, have collaborated to publish the National Visitor Safety Handbook to warn inbound tourism of risks such as riptides, sunstroke and marine stingers (National Visitor Safety Program 2008).
Positive market image
Image is the sum of beliefs, attitudes and impressions held by a person or group of people towards some phenomenon (Lee, C-K. et al. 2012). Generally speaking, images can be either descriptive (e.g. the objective perception that the Gold Coast is a seaside resort) or evaluative (the subjective perception that the Gold Coast is tacky and overdeveloped). Destination images are often an amalgam of assessments related to previously described pull factors such as accessibility, attractions, cultural links, affordability, stability and safety. Such images are immensely important in discretionary forms of tourism such as recreational vacations where the destination is not predetermined by business or social considerations. This, again, is because the product, at least for first-time visitors, is an intangible one that cannot be directly experienced prior to its consumption (i.e. prior to the actual visit).
FIGURE 4.5 Gold Coast — Famous for Fun

In such cases, potential visitors rely on their images in deciding to patronise one destination over another. Accordingly, image research within tourism studies has traditionally focused on the market awareness and evaluation of destinations and their products as a means of informing the marketing effort. The outcomes of this research often lead destination managers to manipulate their public symbols and promotion in order to improve their market image. This is illustrated by Australia’s Gold Coast, where the ‘Green Behind the Gold’ campaign of the late 1990s tried to capitalise on the proximity of the rainforest to the beach. This gave way in the early 2000s to the ‘Very GC’ campaign, which at first attempted to convey a cool, sophisticated and upmarket image to recruit new markets, and later adopted a more family-oriented set of images to reinforce traditional markets. In 2013, the ‘Famous for Fun’ campaign focused on the traditional strength of the core hedonistic attractions, and was intended to evoke a sense of excitement, boundless energy, fun and joy (Tourism Queensland 2013) (see figure 4.5).
To eventuate in an actual visit, the potential tourist must first be aware that a destination exists. This is seldom a problem for high-profile destination countries such as the United States, France, China or Australia, but a major problem for more obscure countries such as Namibia, Suriname or Qatar, or for less known places within individual countries. Next, it is vital that the awareness of the potential destination is positive. The continuing unrest in Syria, for example, has made this relatively obscure country familiar 96to potential tourists in Australia and other emerging economies. However, the negative nature of this awareness ensures that most travellers will still avoid it. As described earlier, it is often a question of ‘guilt by association’, as the tourist market extends what is happening in Syria to the entire Middle East. Similarly, the unsophisticated would-be tourist may apply a national stereotype to all destinations within a particular country, perceiving for example all Swiss localities in tired alpine/lederhosen terms, or all Californian cities as ‘free-fire’ zones dominated by street gangs. These stereotypes complicate the ability of tourist destination managers and marketers to disseminate a positive image to the tourism market. A discussion of tourism marketing, which includes the attempt to manipulate destination image within particular tourist markets, is provided in chapter 7.
Pro-tourism policies
Beyond the effect of political accessibility as described earlier, the pull effect of a destination can be positively influenced by the introduction and reinforcement of pro-tourism policies. Governments, for example, can and often do employ awareness campaigns among the resident population to promote a welcoming attitude towards visitors, in order to foster a positive market image. However, because such campaigns depend on widespread social engineering, and because their effects can be counteracted by random or deliberate acts of violence, positive outcomes cannot be guaranteed. Furthermore, it is the behaviour of some tourists, and the structure and development of tourism itself, that often generate negative attitudes within the host community (see chapter 9). This implies that major structural changes to tourism itself, rather than awareness campaigns, may be required to foster a welcoming attitude.
In contrast, more control is possible at the micro-level, as when employers encourage and reward the pro-tourist behaviour of individual hotel employees, travel guides and customs officials. Other pro-tourism measures available to governments include the creation of trans-boundary parks that encourage the cross-border flow of tourists. The reduction or elimination of tourism-related taxes and duties is another option. The willingness of government to initiate financial incentives, however, is usually limited by its concurrent desire to maximise the revenues obtained from the tourism sector (see chapter 8).
REGIONAL DESTINATION PATTERNS
The uneven distribution and growth of the global tourism sector is evident dualistically in the changing balance of stayovers between the advanced and emerging economies. International tourist destination patterns will now be examined from a regional perspective, along with the combinations of factors that have given rise to these patterns. The regions are outlined below in their order of importance as recipients of tourist arrivals. Table 4.2 provides stayover and population data (actual numbers and percentage shares) by major global regions and subregions, as defined by the World Tourism Organization (UNWTO). Data for the individual countries that comprise each region and subregion are provided in appendix 2. It must be emphasised that these and all other stayover statistics in this book are impeded (as a basis for comparing the level of tourist activity between destinations) by their failure to take into account the average length of stay. For example, a destination receiving 100 000 stayovers per year with an average stay of ten nights (one million visitor nights) probably has a greater level of tourism intensity than a destination that receives 200 000 stayovers per year with an average stay of just three nights (600 000 visitor nights).97
TABLE 4.2 International stayover arrivals by UNWTO region and subregion, 2010
Source: Population Reference Bureau (2011), UNWTO (2012b)
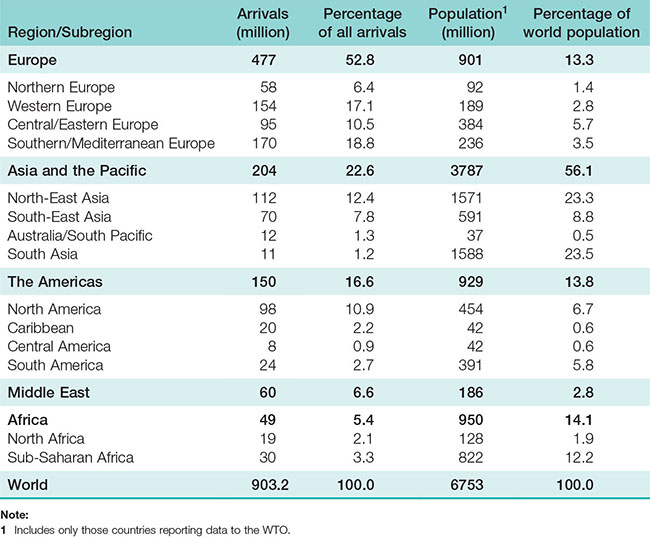
Europe
Europe remains by far the most overrepresented destination region relative to population, its mix of advanced and emerging economies accommodating 13 per cent of the world’s population but 54 per cent of all stayovers in 2010. This dominant position is further indicated by the fact that six of the top ten destination countries, and 11 of the top 20 (including Turkey), were European (see table 4.3). The push and pull factors discussed in chapter 3 and earlier in this chapter, respectively, are all well-articulated in this region. For example, densely populated and prosperous states usually share several common land borders (9 in the case of Germany), making international travel convenient and affordable. Excellent land and air infrastructure facilitates traffic through increasingly open borders, while the widespread adoption of the euro as a common regional currency eliminates the need to obtain foreign notes or allow for exchange rate differentials in trip budgeting. Tourist and nontourist services are generally excellent, and attractions range from outstanding and diverse historical and cultural opportunities to the natural attributes of the Mediterranean coast, the boreal forests of Scandinavia and the Alps. Since 1950, the western half of Europe has experienced a high level of political and economic stability, while the disintegration of the former Soviet Union eliminated most of the political uncertainty fostered by the Cold War. All these factors have contributed to a market image of ‘Europe’ as a safe and rewarding destination brand that has not yet been seriously undermined by occasional terrorist attacks or residual ethnic conflict in regions such as the Balkans or the Caucasus.98
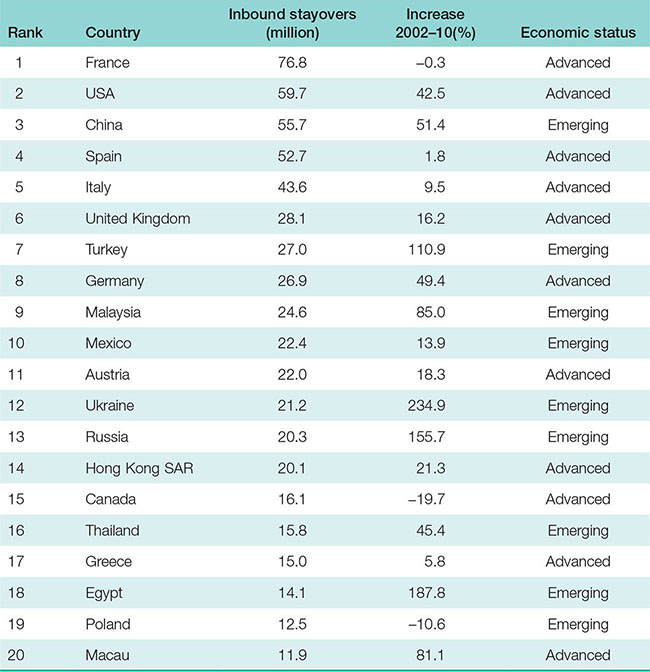
Geographically, these qualities, and hence intensity of tourism activity, are most evident in western Europe. Eastern Europe is more complex, with former Soviet bloc states such as Poland, the Czech Republic and Hungary already tourism-intensive because of their proximity to western Europe and their systematic incorporation into the European Union (Hall, Marciszweska & Smith 2006). This saturation effect, and the accompanying erosion of the novelty factor, together help to account for Poland’s poor performance in attracting tourist arrivals between 2002 and 2010 (see table 4.3). Concurrently exceptional growth rates for Russia and Ukraine indicate that Western Europeans are seeking out more novel tourist experiences in the eastern periphery of Europe. These more easterly countries, however, continue to experience problems with accessibility and services, as well as residual post–Cold War tensions.
Asia–Pacific
The Asia–Pacific region represents the reverse situation to Europe with respect to relative share of population and stayover totals. However, its size and diversity warrant analysis at the subregional level.
99
North-East Asia
North-East Asia has a large subregional tourism sector in absolute numbers, but this pales in comparison with its one-quarter share of the global population. With almost three-quarters of the intake, China and Hong Kong together dominate the market. To place China’s current status as the world’s number three destination in perspective, it is interesting to note that only 303 foreign visitors were allowed to enter the country in 1968 (Zhang, Pine & Zhang 2000). Since the 1970s, the Chinese government has expanded inbound tourism through a policy of incremental access that has seen the number of cities open to inbound tourists increase from 60 in 1979 to 1068 by 1994. Most of China is now accessible to foreign tourists, except for some areas near international borders and military sites, as well as parts of Tibet and Xinjiang where ethnic tensions have increased in recent years. Nevertheless, inbound tourism remains concentrated in eastern cities such as Shanghai, Beijing and Shenzhen. China is unique in that a high proportion of inbound tourists are ‘compatriots’, or ethnic Chinese residents of Taiwan, Hong Kong SAR and Macau SAR.
South-East Asia
Next in relative importance on a subregional basis is South-East Asia, where the proportional share of population does not as dramatically exceed its share of stayovers as in North-East Asia. The internal subregional pattern is diverse, with Malaysia, Singapore and Thailand displaying the most developed and diversified tourism sectors, while Cambodia and Laos remain in an incipient phase (see Technology and tourism: Getting mended in Malaysia). The former three countries have benefited from the presence of major transit hubs, good infrastructure, prolonged political and social stability, a diverse array of high-quality attractions, favourable exchange rates relative to major tourist markets, a mostly positive market image and the pursuit of pro-tourism policies by government. Large and prosperous ethnic Chinese populations also engage in extensive travel between these countries. The emergence of Indonesia as an important destination country has been curtailed since the late 1990s by political and social instability, which culminated in the Bali bombings of 2002.
technology and tourism
 GETTING MENDED IN MALAYSIA

Medical tourism as a niche subsector has increased dramatically in Malaysia, growing from 39 000 foreign patients in 1998 to 341 000 in 2007. The reason for this growth is partly related to the country’s upper middle income status, which makes available state-of-the-art medical technology in specialised facilities at a relatively low cost compared with more developed destinations such as Singapore. A specific stimulus was the Asian financial crisis of the late 1990s, which forced many private paying patients into the public healthcare system, and therefore forced private providers to cultivate new markets. Certain hospitals are now certified providers of medical tourism services. A recent survey of 470 outpatients at these facilities revealed the dominance of the Indonesian and Singaporean markets, which accounted for 72 per cent and 23 per cent respectively (Yeoh, Othman & Ahmad 2013). Aside from the matter of geographical accessibility, it may be that 100Indonesians are attracted in particular by the technology, while Singaporeans favour the cheaper costs. Most declared procedures involved a one-week stay and were related to bones (8.9 per cent), eyes (8.2 per cent) and heart (7.4 per cent). Over 60 per cent were repeat medical visitors to Malaysia. Most medical tourists originally found out about these options through referrals from friends (44 per cent) and family (38 per cent) and only rarely from hospital websites (5 per cent). The former sources probably provide a necessary level of trust and confidence for making a decision that has important personal health implications, and this is likely to reinforce the Indonesian and Singaporean connections. The rapidly ageing demography of Singapore also ensures robust long-term demand. One disadvantage for Malaysia is the continuing dependency on just two markets (i.e. Singapore and Indonesia). This, however, is somewhat offset by the reduced need to recruit new customers, which can cost five times more per capita than retaining existing ones.
Australia/South Pacific (Oceania)
International tourism in Oceania is impeded by the relative remoteness of this region from major market sources, but facilitated by high-profile natural attractions. The regional image, however, has been harmed by instability in Fiji and the Solomon Islands as well as persistently high crime in parts of Papua New Guinea. As is the Caribbean, the South Pacific islands are overrepresented as a tourist destination, accounting for about 0.5 per cent of the global population, but 1.2 per cent of stayovers (see table 4.2). To an even higher degree than in the Caribbean, tourism in the region is unevenly distributed, with just two of 22 destination states or dependencies (Guam and the Northern Mariana Islands, both US dependencies) accounting for almost two-thirds of all stayovers. Also similarly to the Caribbean, Oceania is a subregion of the pleasure periphery where historic and contemporary political and economic linkages largely dictate the nature of local tourism systems. Guam, for example, is dominated by Japanese and American tourists, New Caledonia by French visitors, and the Cook Islands by New Zealanders. Australia, influential in the tourism systems of several Oceanic destinations, including Papua New Guinea, Fiji and Vanuatu, is considered as a specific destination country under a separate subsection later in this chapter.
South Asia
South Asia is the most underrepresented inbound tourism region relative to population, with almost one-quarter of the world’s people but just over one per cent of its inbound tourists. A negative regional destination image, a rudimentary network of services and facilities, widespread poverty and distance from major markets are all factors that have contributed to this deficit. Recent events and issues that have exacerbated the negative image of the region include the ongoing conflict in Afghanistan, the acquisition of nuclear technology by Pakistan and ongoing sectarian violence in that country, the Maoist insurgency in Nepal and parts of India, the rogue state status of Iran and rising tensions with the United States, and the Indian Ocean tsunami of 2004. Nevertheless, pleasure periphery enclaves flourish in the Maldives as well as in the Indian states of Goa and Kerala.
The Americas
The Americas are overrepresented as a regional tourist destination relative to their population, although only marginally. However, as in Asia, this status disguises significant variations in the relative importance of tourism at the subregional level.101
North America
North America accounts for about 7 per cent of the global population, but 11 per cent of all stayovers. Consisting of only three countries (the United States, Mexico and Canada), North America accommodates two of the world’s largest bilateral tourist flows: United States – Canada, and United States – Mexico. Some 80 per cent of all inbound tourists to Canada are from the United States, while Canadians account for at least one-third of all arrivals to the United States. Proximity is the primary factor accounting for these flows, given that more than 90 per cent of Canadians reside within a one-day drive to the United States. Other factors include strong cultural affinities, the complementarity of attractions (i.e. Americans seeking the open spaces of Canada, and Canadians travelling to the American Sunbelt during winter), good two-way infrastructural and political accessibility (i.e. through the North American Free Trade Agreement (NAFTA)), and a highly stable political and social situation in both countries. A somewhat less open border has been evident since the 2001 terrorist attacks on the United States; in Mexico’s case, this has been exacerbated by the issues of illegal migrants and drug trafficking.
The Caribbean
Owing to its endowment of 3S resources and its accessibility and proximity to the United States, the Caribbean has emerged as one of the world’s most tourism-intensive subregions, with 0.6 per cent of the world’s population but 2.2 per cent of its stayovers. The Caribbean is also the single most important region for the cruise ship industry and the region in which the cruise ship industry has the greatest presence relative to tourism as a whole (Dowling 2006). This general level of overrepresentation, however, disguises major internal variations. Haiti and the Republic of Trinidad & Tobago both have relatively weak tourism sectors, which belie the region’s image as the personification of the pleasure periphery. In the former case this is due to chronic political instability and extreme poverty, and in the latter case due to an economy sustained by oil wealth and manufacturing. Cuba’s potential, as described in chapter 2, has been hindered by the imposition of restrictions by the US government. In contrast, Caribbean SISODs such as the Bahamas, Antigua and Saint Lucia are among the world’s most tourism-dependent countries. Jamaica is also a tourism-intensive destination but has a destination image that is suffering due to rising levels of serious crime (Altinay et al. 2007).
South and Central America
South and Central America, unlike North America, are underrepresented as international tourist destinations. Spatially, the highest levels of international tourist traffic occur in the southern destinations of Argentina, Uruguay, Brazil and Chile, which each had at least 1.7 million tourist arrivals during 2010. Most of this traffic is from other subregional countries, given the isolation from major international markets. Factors that account for the overall underrepresentation of South America include isolation from the major origin regions of North America and Europe, poor accessibility and a general lack of international standard tourism services. Residual market negativity also persists as a consequence of historical experiences with political instability, hyperinflation and economic uncertainty.
The Middle East
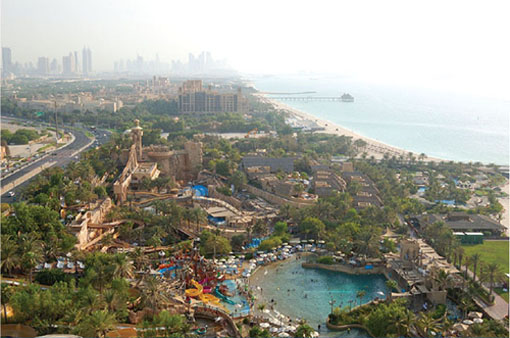
The Middle East is overrepresented as a destination region. However, as we have seen with all the other regions, this fact obscures a pattern of dramatic internal variability. For example, Egypt and Jordan have relatively strong tourism industries, while Saudi 102Arabia’s robust tourism sector consists almost entirely of Muslim pilgrims visiting Mecca and other holy sites associated with Islam. In contrast, international leisure tourism is embryonic in Yemen and Libya, and almost non-existent in Iraq or Syria. The Middle East, as a Muslim-dominated region, has been disproportionately harmed by the terrorism of September 2001 and the subsequent ‘war on terrorism’, although this has not negatively affected the growth of innovative destinations such as Dubai and Abu Dhabi in the United Arab Emirates, and Doha in Qatar.
Wild Wadi Water Park, Dubai
Africa
Africa as a region displays a high discrepancy between population share and stayover share. This underrepresentation can be accounted for by the persistently negative image of Africa in the tourist market, foreign exchange constraints, chronic political instability, insufficient skilled labour to develop the industry, and weak institutional frameworks that inhibit effective tourism planning and management. Other factors include widespread corruption, distance from the major markets, competition from more stable intervening opportunities, rudimentary infrastructure and concerns over personal safety due to high crime rates and widespread infectious diseases such as HIV/AIDS.
Africa, similarly to South and Central America, is characterised by a skewed pattern of spatial distribution that favours the extreme north (e.g. Tunisia and Morocco) and the extreme south (e.g. South Africa and Botswana), although chronic political instability in Zimbabwe has continued to threaten the relatively positive market image of southern Africa as of 2013. Tourism in the north is fuelled by 3S-motivated tourists from Europe, while intra-regional sources dominate the south. Middle and West Africa are minor destinations for international tourist arrivals that embody the dissuasive factors outlined earlier, although some of these countries are displaying evidence of tourism growth (see Breakthrough tourism: Rwanda on the threshold?). The largest African state in terms of inbound stayovers, South Africa, managed a global ranking of only thirtieth place in 2010, based on just over 8 million arrivals.
breakthrough tourism
 RWANDA ON THE THRESHOLD?

During the 1990s, Rwanda symbolised all the perceived problems of sub-Saharan Africa. Intertribal genocide in 1994 claimed the lives of almost one million Rwandans and cast a pall over the small country, adding to an existing negative image of poverty, overcrowding, political instability and environmental degradation. Rwanda’s support of any kind of tourism was, for the most part, based on small VFR flows and a few adventure tourists seeking encounters with the mountain gorillas of remote Volcanoes National Park. Given this history, many are surprised to learn that Rwanda now has one of the fastest growing tourism industries in Africa. In 2010, 666 000 international tourists visited the country, and the US$200 million they injected into the national economy represented 103a 14 per cent increase over 2009. About 95 per cent of visitors are VFR or business travellers mostly from within Africa and the Rwandan diaspora. The leisure component, while comprising only about 5 per cent, consists of high-yield Europeans and Americans. This economically vital component has been steadily increasing since the government designated tourism as a strategic priority, became engaged in more aggressive publicity campaigns, and created a more business-friendly investment environment. Many international tour operators continue to spread a negative image, but those who actually visited Rwanda in the early 2000s reported high satisfaction due to their experience of the country as safe, stable, friendly, scenic and clean (Grosspietsch 2006). Kigali, the capital city, has excellent facilities and services, and therefore provides a positive initial ‘gateway’ experience for international arrivals. Kigali hotel owners, who are mainly Rwandan, echo a sense of optimism but cite skill deficits, low service standards, poor access to financing, inadequate infrastructure and over-reliance on gorilla tourism as obstacles that need to be overcome before Rwanda can be considered a fully ‘normal’ country for tourism and a role model for other sub-Saharan destinations (Gatsinzi & Donaldson 2010).
Australia
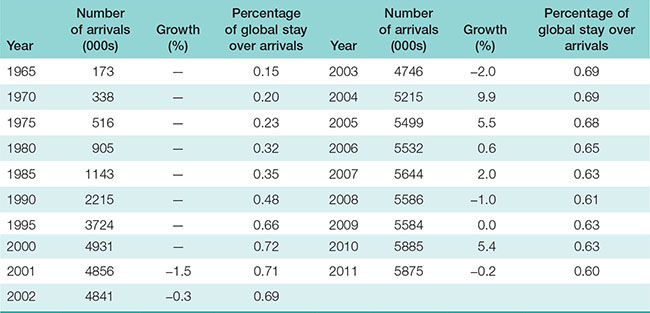
Australia’s share of the global inbound market steadily increased from 0.15 per cent in 1965 to a peak of 0.72 in 2000 before declining slightly but steadily since then (see table 4.4). It ranked in the thirty-seventh position in 2010, up from fortieth in 2007, but down from the thirty-fourth position in 2002. High growth in the late 1980s represented not only good conditions in major market economies, but also the staging of high-profile events such as the 1988 bicentennial of European settlement and the international exposition in Brisbane that same year. Subsequent decline, accordingly, should be interpreted at least in part as a correction or normalisation of visitor intakes following these major events. The same effect occurred in the wake of the 2000 Sydney Olympics, while subsequent fluctuations reflect its vulnerability as a long-haul destination with a volatile currency.
TABLE 4.4 International stayover arrivals in Australia, 1965–2011
Source: ABS (2001, 2005 and 2008); ONT (1998); WTO (1998a); TRA (2012a)
104
TABLE 4.5 Australian 2011 top ten inbound countries, 1995–2011
Source: Data derived from ABS (2003), TRA (2012a)
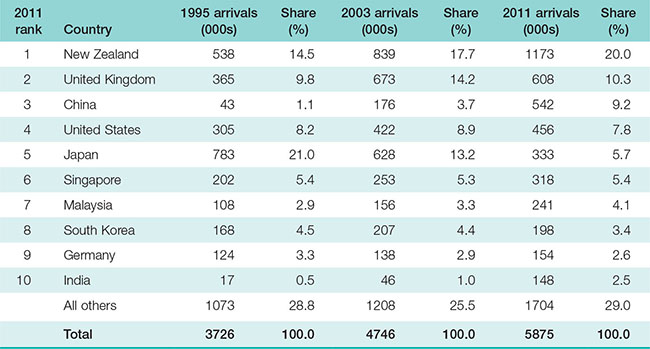
Australia’s inbound traffic is diverse, and this is a characteristic deliberately cultivated by the federal and state governments in order to avoid dependency on one or two primary markets. As shown in table 4.5, New Zealand retains a dominant and growing share of the market despite its small population, while the decline of Japan and the concomitant ascent of China is another notable pattern. Also sustaining Australia’s inbound tourism industry is a low profile but stable group of Asian countries that includes Singapore, Malaysia and South Korea.
INTERNAL DESTINATION PATTERNS
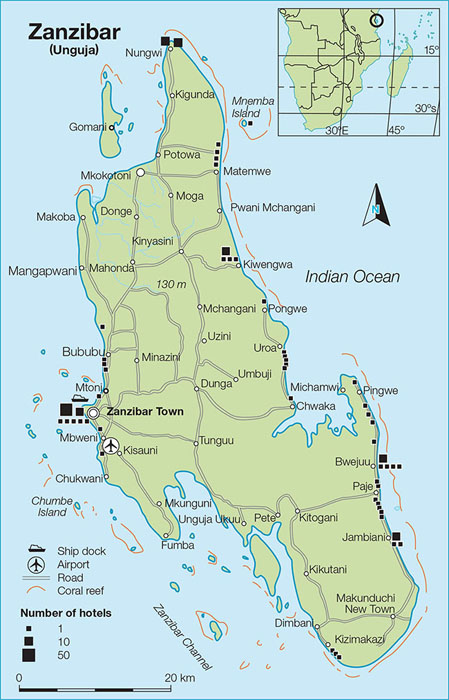
The consideration of destinations has thus far been directed towards the global and regional levels, with individual countries, for the sake of simplicity, being treated as uniform entities. In reality, the spatial distribution of tourism within countries also tends to be uneven. This subnational inequality is evident even in small pleasure periphery destinations such as Zanzibar (Tanzania), where tourism accommodations are concentrated at seaside locations or in the capital city (figure 4.6). In general, water-focused resources such as coastlines, lakes, rivers and waterfalls are considered potentially attractive as tourist venues in most destinations, and therefore help to promote a spatially uneven pattern of tourism development.
Large urban concentrations also tend to harbour a significant portion of a country’s tourism sector. This is because of their status as international gateways, the high level of accommodation and other tourism-related services that they provide, the availability of important urban tourist attractions, and their status as prominent venues for business and VFR tourism. Within these cities the pattern of tourism distribution is 106also uneven, being highly concentrated in downtown districts where accommodation, restaurants and attractions are usually clustered. The management implications of spatial concentration are compounded in many destinations by the concurrent presence of temporal concentrations, or the tendency of tourism activity to be focused on particular times of the year. The issue of seasonality is addressed more thoroughly in chapter 8.
Urban–rural fringe
Adding to the complexity of internal distribution patterns is the increasing concentration of tourism activity in the transitional urban–rural fringe (or exurbs) that combines urban and rural characteristics and benefits from proximity to each. There is increasing evidence that tourism in such areas has at least three distinctive characteristics that require special management considerations (Weaver 2005).
It has a distinct combination of products that may include theme and amusement parks, tourist shopping villages (small towns such as Tamborine Mountain and Maleny (Queensland) where the downtown is dominated by tourist-oriented businesses), factory outlet malls and golf courses (see Contemporary issue: What makes a successful tourist shopping village?).
Distinct market characteristics are evident in the preponderance of excursionists who use overnight accommodation in nearby urban areas, and in the presence of hyperdestinations, usually tourist shopping villages, where tourist arrivals dramatically outnumber local residents. In the case of Tamborine Mountain, 7000 residents host each year approximately 500 000 visitors. A high proportion of these visitors, moreover, are residents of nearby urban areas who may or may not meet the travel distance thresholds associated with domestic tourism. This all suggests that revenues derived largely from the use of overnight accommodation are minimal and might not compensate for the congestion and utility use generated by large numbers of visitors.
Management of exurban tourism is complicated by the fact this zone is inherently unstable, in transition and characterised by conflict among the diverse users of this exceptionally complex space.
contemporary issue
 WHAT MAKES A SUCCESSFUL TOURIST SHOPPING VILLAGE?

With extremely high tourist-to-host ratios and locations within the transitioning rural–urban fringe, tourist shopping villages appear to be at risk of severely negative environmental and social impacts. These include periodic congestion, invasion of residents’ privacy and rampant development. Research has demonstrated, however, that such communities can thrive under the right circumstances. Murphy and colleagues (2012) identified the factors that made for successful tourist shopping villages in Australia, New Zealand and Canada. Most of the Australian examples were located in the rural–urban fringe and included Mount Tamborine and Montville (Qld), Hahndorf (SA), Leura (NSW) and Healesville (Vic.). One of the most important factors was the ability to preserve a definable heritage theme, 107especially along the main shopping street, thereby providing an attractive landscape and unique sense of place. Hahndorf, for example, has successfully preserved and projected a traditional German theme. A variety of unique, high-quality and ‘authentic’ local food and other goods serves as a necessary complement, with the food available as part of an onsite dining experience. Here again, Hahndorf is noted for its diversity of food and shopping opportunities. The retail district in a successful tourist shopping village is concentrated and well served by adjacent tourist facilities such as toilets and parking areas. These should be in locations that do not detract from the aesthetic amenity of the main shopping street, but are still convenient, safe and efficient. Extensive pedestrian-friendly streetscaping adds to an attractive appearance and enjoyable experience, while abundant but unobtrusive signage efficiently directs visitors to their desired destinations. Finally, formal planning structures are required to ensure that these characteristics are achieved in an integrated, efficient manner that pleases the visitors but does not inconvenience local residents, even as exurbanisation brings about rapid change in the surrounding area.
The Australian pattern
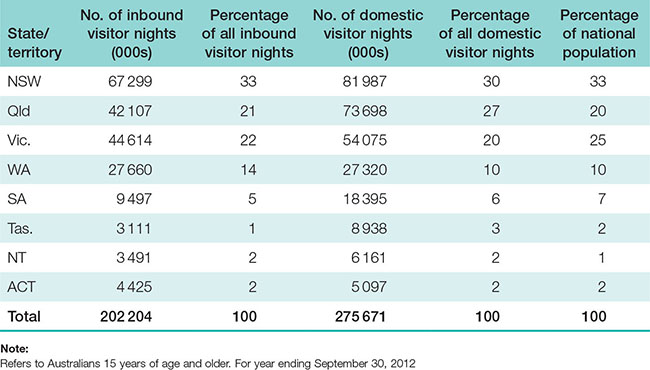
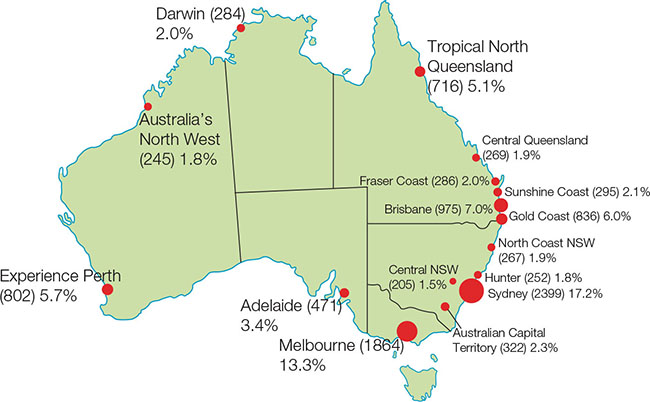
Australia is no exception to the universal pattern of spatial concentration. At the state level, New South Wales, Queensland and Victoria together account for three quarters of all domestic and inbound visitor-nights, with a somewhat greater dispersal evident in the domestic sector due to the higher incidence of business and VFR traffic (see table 4.6). However, if considered at the level of Australia’s 76 official tourism regions, the true extent of concentration becomes more evident. As shown in figure 4.7, the top 16 regions accounted for 75 per cent of all accommodation room-nights in Australia (domestic and inbound combined) during the 2012 September quarter. Moreover, only two of these top regions (Australian Capital Territory and Central New South Wales) are non-coastal. Sydney and Melbourne together accounted for almost one in three occupied rooms during that period.
TABLE 4.6 Distribution of domestic and inbound visitor-nights in Australia by destination state or territory, 2011–12
Source: TRA (2012b, 2012c)
108
FIGURE 4.7 Top 16 tourism regions in Australia by number and percentage of all accommodation room-nights, 2011
Source: ABS (2012)
109
CHAPTER REVIEW
Most inbound tourism still accrues to the advanced economies. However, the share of the emerging economies is steadily increasing due firstly to the emergence of 3S tourism as a major form of activity after 1950. Furthermore, economic growth and the appearance of a substantial middle class within the emerging economies are promoting increased inbound travel between the emerging economies as well as to the advanced economies. The formation of a pleasure periphery at the interface of the advanced and emerging economies is indicative of tourism’s increasing status as a global economic activity and agent of landscape change. Europe, North America, Oceania, the Middle East and the Caribbean are all overrepresented as destination regions relative to their resident populations. In contrast, South America, Africa and Asia are all underrepresented. The pattern of uneven distribution is also apparent within each of these regions and within individual countries such as Australia, where coastal areas and metropolitan area cores and exurbs account for most inbound and domestic tourism activity.
Tourism’s uneven pattern of distribution reflects differences in the influence of the ‘pull’ factors that encourage tourism in particular locations, and hence help to determine the global pattern of tourism systems. These pull factors include the geographical proximity of destinations to markets, structural and political accessibility, the availability of sufficient attractions and services, cultural links between origin and destination regions, affordability, political and social stability at the local, national and regional levels, perceived personal safety, market image, and the mobilisation of pro-tourism policies. Central to the management of tourism destinations is how much managers and planners are able to influence these forces. Nothing can be done, for example, to change the actual geographical distance of a destination from a market, or to modify the destination’s primary physical features. Similarly, little can be done, especially at the subnational scale, to influence exchange rates or the level of sociopolitical stability. However, the negative effects of these factors, where they exist, can be counteracted at least to some extent through effective image manipulation, the implementation of pro-tourism policies, the establishment of compelling ‘created’ attractions, and the provision of political and infrastructural access to target markets.
SUMMARY OF KEY TERMS
Advanced economies a designation by the International Monetary Fund (IMF) of countries that are characterised by a high level of economic development and accompanying social indicators; these countries continue to account for most outbound and inbound international tourism activity
3S tourism a tourism product based on the provision of sea, sand and sun; that is, focusing on beach resorts
Distance–decay in tourism, the tendency of inbound flows to decline as origin regions become more distant from the destination
Emerging economies a designation by the International Monetary Fund (IMF) of countries that are characterised by a lower level of economic development and accompanying social indicators; cumulatively, these countries are accounting for a growing share of outbound and inbound international tourism activity
Global inequality in tourism a fundamental distinction pertaining to the relative spatial distribution of tourism at a global level110
Hyperdestinations destinations where the annual intake of visitors dramatically outnumbers the permanent resident population; often characteristic of tourist shopping villages
Image in tourism, the sum of the beliefs, attitudes and impressions that individuals or groups hold towards tourist destinations or aspects of destinations. Destination image is a critical factor in attracting or repelling visitors.
Incremental access a policy, practised most notably in China, whereby new destinations within a country are gradually opened up to international (and possibly domestic) tourists
North–south flow a common term used to describe the dominant pattern of international tourist traffic from the advanced economies (located mainly in the northern latitudes, except for Australia and New Zealand) to the emerging economies (located mainly to the south of the advanced economies)
Pleasure periphery those less economically developed regions of the globe that are being increasingly mobilised to provide 3S and alpine tourism products
Political accessibility the extent to which visitors are allowed entry into a destination by a governing authority
Pull factors that help to stimulate a tourism product by ‘pulling’ consumers towards particular destinations
Small island states or dependencies (SISODs) geopolitical entities with a population of less than three million permanent residents and a land mass of less than 28 000 km2. SISODs are overrepresented as tourist destinations because of their ample 3S tourism resources.
Structural accessibility the extent to which a destination is physically accessible to markets by air routes, highways, ferry links etc., and through entry/exit facilities such as seaports and airports
Subnational inequality the tendency of tourism within countries, states and individual cities to be spatially concentrated
Sunbelt the name frequently applied to the 3S-oriented American portion of the pleasure periphery. Well-known destinations within the sunbelt include Hawaii, southern California, Las Vegas (Nevada), Arizona, Texas and Florida.
Tourist shopping villages small towns where the downtown is dominated by tourism-related businesses such as boutiques, antique shops and cafés; they are also usually hyperdestinations
Urban–rural fringe (or exurbs) a transitional zone surrounding larger urban areas that combines urban and rural characteristics and benefits from proximity to each
QUESTIONS
How much is spatial imbalance evident in tourism at the international, national, subnational and local level?
Why does this imbalance occur?
What are the managerial implications of this imbalance at all four levels cited in (a)?
How do each of the ‘pull’ factors discussed in this chapter apply to Australia and New Zealand?
Is it justifiable for governments to implement security procedures for visitors that cause significant inconvenience and aggravation?
How could a better compromise between open borders and adequate security be attained?
To what extent can the tourism experience of Rwanda be replicated in other countries in sub-Saharan Africa?
What strategies could be implemented in order to increase Australia’s share of global stayover tourism to 1 per cent of the total (that is, about 10 million tourists per year)? Take into account the data provided in table 4.5.
What lessons for other emerging tourist destinations can be learned from the experience of Malaysian medical tourism?
What specific managerial challenges are associated with tourism in the urban–rural fringe?
What is the best way of addressing these challenges?
EXERCISES
Rank the following ten destination countries beginning with the one that you would most like to visit for a one-month vacation, and ending with the one that you would be least interested in visiting for a one-month vacation.
Zimbabwe
United States
United Kingdom
Fiji
France
Russia
Mexico
Dubai
China
IndiaIndicate the reasons for your rankings, referring in each case to each of the pull factors discussed in this chapter.
Assigning a value of ‘5’ for each first choice, ‘4’ for each second choice, and so on, add up the class responses for each of the five destinations.
Identify the overall class rankings.
Do any consistent patterns emerge as to the reasons given for these rankings?
Figures 4.3 and 4.4 depict the top ten destinations for Australian outbound tourists in 2007 and 2011. Write a 500-word report in which you:
describe the differences between the two profiles
list the factors that help to explain these differences
predict what the pattern might look like in 2020.
FURTHER READING
Carlsen, J. (Ed.) 2011. Island Tourism: Sustainable Perspectives. Wallingford: CABI. Sustainable island futures are the focus of this textbook, which combines issues such as climate change, host–guest interactions and product rejuvenation.
Duval, T. (Ed.) 2004. Tourism in the Caribbean: Trends, Development, Prospects. London: Routledge. The Caribbean is arguably the most tourism-intensive of the world’s regions, and this edited volume considers relevant issues such as the role of hedonism in developing the product, cruise ships, ecotourism, postcolonialism, and community and small business perspectives.
Lohman, G. & Dredge, D. (Eds) 2012. Tourism in Brazil: Environment, Management and Segments. London: Routledge. This is the first English language text to provide a detailed analysis of domestic and international tourism in Brazil, the dominant tourism destination of South America and host of mega-events in 2014 and 2016.112
Murphy, L., Benckendorff, P., Moscardo, G. & Pearce, P. 2012. Tourist Shopping Villages: Forms and Functions. London: Routledge. Parameters of successful tourist shopping villages are analysed using case studies from Australia, New Zealand, Canada, United States, United Kingdom and Ireland.
Timothy, D. 2012. Tourism and Political Boundaries. London: Routledge. The persisting importance of international boundaries as a control mechanism on tourist movements is a central theme of this text, which adopts macro-themes of geopolitics and globalisation.
case study
 THE DOMESTIC PLEASURE PERIPHERY IN BRAZIL

Brazil, more than any other emerging economy, best illustrates the dynamics of a domestically-driven coastal pleasure periphery (Pegas, Weaver & Castley in press). By way of context, Brazil is an upper-middle income country with a 2010 per capita GDP of almost US$11 000 — eighty-second among 227 monitored countries (World Bank 2011). However, this relative prosperity masks high levels of internal inequality, with the richest and poorest 10 per cent of families respectively accounting for 42.5 per cent and 1.2 per cent of total consumption (CIA 2011). This inequality is geographically reflected in a sharp divide between the wealthier South and the poorer North, with the richest state (São Paulo) having a per capita income six times higher than the poorest state (Maranhão) (Silveiro-Neto & Azzoni 2006).
Since at least the 1970s, Brazilian federal governments have implemented policies that have attempted to redress the economic imbalance between the North and North-East states on one hand and the South and South-East states on the other. Tourism, in particular, has been regarded as an activity with the capacity for developing the economy along the North-East’s coastline. Unlike the classic pleasure periphery model where foreign corporations (with assistance from destination governments) dominate the development process, the growth of Brazil’s north-eastern coastal pleasure periphery has been largely instigated and funded by the Brazilian federal government itself through the Tourism Development Program (PRODETUR) it established in 1991. Representing collaboration between all levels of government and various financial and tourism agencies, PRODETUR has made strategic investments in construction (e.g. infrastructure) and airports within places and regions that have been identified as being economically deprived but rich in tourism potential (e.g. beaches, cultural heritage). With such infrastructure in place, the risks to private enterprise are reduced and it can proceed with resort or hotel investment accordingly. Of all private tourism investment in Brazil between 2006 and 2012, 85 per cent was allocated to the North-East, along with 91 per cent of all jobs (or 55 600 of 61 300). The vast majority of this investment has been made by Brazilian corporations.
The contemporary coastal pleasure periphery of Brazil reflects this combination of domestic private and public investment. Using Google Earth and various secondary Brazilian sources, 195 tourism cities (i.e. at least 10 000 residents) were identified within a 10 km distance from the coast (Pegas, Weaver & Castley in press). Notably, the tourism cities in the North-East are to a large extent ‘induced’ in the sense that their growth and livelihood has been based on PRODETUR and other government investments that in turn attracted private investment in accommodation. In contrast, tourism cities in the South-East (including Rio de Janeiro) are mostly ‘organic’ in that private investment was not generally predicated on similar kinds of public investment. Prosperous and close-by domestic markets, instead, have ensured that hotel investments would not involve high levels of financial risk. Southern tourism cities also contain a large number of second houses and apartments, mostly maintained by residents living in areas far removed from the beach. One feature common to North-East and Southern states is the presence of ‘beachfront metropolises’, or large urban municipalities where tourism is locally important but represents only a small proportion of all economic activity. The classic example is Rio de Janeiro, which is internationally known for its iconic Copacabana and Ipanema beaches. Examples in the North-East include Salvador and Recife.
The identity of the Brazilian coastal pleasure periphery extends to the domestic market. Many of the nine million international tourists who arrived in 2011 were attracted by the beachfront metropolises and coastal tourism cities, but their numbers are dwarfed by the domestic traffic, estimated nation-wide at 156 million in 2007. Another prevalent pattern is the dominance of intrastate traffic, which accounts for 50–90 per cent of all tourism activity depending on the state. In most cases, this intrastate traffic consists of residents driving from their residences in beachfront metropolises and other large cities to nearby coastal tourism cities for their annual vacation and on other holiday occasions. Inter-state travel is less common, and mostly involves people from the South travelling to the North-East. Transfers of wealth within Brazil, accordingly, are related more to investment than actual tourist expenditures.
Continued growth of Brazil’s coastal pleasure periphery is all but assured by an expanding population, increasing prosperity, and the status of beaches as a core element of the national identity (Kane 2010) and a central focus on international marketing (Bandyopadhyay & Nascimento 2010). Hosting international mega-events in 2014 (World Cup) and 2016 (Summer Olympics) have also raised Brazil’s profile as an inbound destination. Yet, despite a high level of government intervention, problems are evident that may reduce the capacity of the pleasure periphery to achieve positive economic and social outcomes for Brazil. One environmental concern is the periphery’s location within the endangered Atlantic rainforest, remnants of which could still be destroyed to make way for future direct and indirect tourism development. A more positive alternative is to preserve such remnants as part of a competitive advantage that offers high quality beach and rainforest experiences in the same day. On a larger scale, there are also fears of ‘Floridisation’, or the emergence of continuous resort and urban development across hundreds of kilometres of coastline, as has occurred in Florida in the United States.
At a social level, opportunities to enjoy the best areas of the beach are still largely denied to many poor Brazilians who face a sort of informal beach 114apartheid. Destabilisation is also evident in some north-eastern communities, with local residents blaming rapid tourism development and an influx of workers from other parts of Brazil for higher costs of living and increased violence and drug use (Pegas & Stronza 2010). Several tourism cities in the North-East continue to suffer economic deprivation, with 40 per cent or more of residents living below the poverty line. Such emerging and persistent problems bring home the point that a dominantly domestic pattern of stakeholder involvement and control is no guarantee of economically, environmentally or socially sustainable outcomes.
QUESTIONS
Write a 1000-word report in which you describe the extent to which the development of the Brazilian coastal pleasure periphery has been assisted by each of the pull factors outlined earlier in this chapter.
Using Google Earth (or a similar map resource), identify one coastal tourism city in Brazil’s North-East, and one in the Southern region.
Write a 500-word report in which you describe how these two cities differ, based only on this mapping data.
In this report, describe subsequent research that would be necessary to clarify the apparent differences and similarities between these two cities.
REFERENCES
ABS 2018. 2001 Year Book Australia. Canberra: Australian Bureau of Statistics.
ABS 2003. Family Characteristics, Australia. Catalogue No. 4442.0. www.abs.gov.au. Canberra: Australian Bureau of Statistics.
ABS 2005. Overseas Arrivals and Departures. Catalogue No. 3401.0. www.abs.gov.au. Canberra: Australian Bureau of Statistics.
ABS 2008. Overseas Arrivals and Departures. Catalogue No. 3401.0. www.abs.gov.au. Canberra: Australian Bureau of Statistics.
ABS 2012. ‘Tourism Region Maps and Correspondence File, Australia, 2012’. Catalogue No. 9503.0.55.001. www.abs.gov.au. Canberra: Australian Bureau of Statistics.
Altinay, L., Var, T., Hines, S. & Hussain, K. 2007. ‘Barriers to Sustainable Tourism Development in Jamaica’. Tourism Analysis 12: 1–13.
Banyopadhyay, R. & Nascimento, K. 2010. ‘Where Fantasy Becomes Reality: How Tourism Forces Made Brazil a Sexual Playground’. Journal of Sustainable Tourism 18: 933–49.
Carlsen, J. & Butler, R. (Eds) 2011. Island Tourism: Sustainable Perspectives. Wallingford: CABI.
CIA 2011. ‘Factbook: Brazil’. www.cia.gov/library/publications/the-world-factbook/geos/br.html.
COTRI 2012. ‘Current Situation of China’s Outbound Tourism’. China Outbound Tourism Research Institute. www.slideshare.net/COTRI_Outbound/current-situation-of-chinese-outbound-tourism-13932993.
Dowling, R. (Ed.) 2006. Cruise Ship Tourism. Wallingford, UK: CABI.
Gatsinzi, J. & Donaldson, R. 2010. ‘Investment Challenges in the Hotel Industry in Kigali, Rwanda: Hotel Managers’ Perspectives’. Development Southern Africa 27: 225–40.
Goeldner, C. & Ritchie, J. 2012. Tourism: Principles, Practices, Philosophies. Twelfth Edition. Hoboken, New Jersey, USA: John Wiley.115
Grosspietsch, M. 2006. ‘Perceived and Projected Images of Rwanda: Visitor and International Tour Operator Perspectives’. Tourism Management 27: 225–34.
Hall, D., Marciszweska, B. & Smith, M. 2006. Tourism in the New Europe: The Challenges and Opportunities of EU Enlargement. Wallingford: CABI.
Henderson, J. 2003. ‘Terrorism and Tourism: Managing the Consequences of the Bali Bombings’. Journal of Travel & Tourism Marketing 15: 41–58.
Israeli, A. & Reichel, A. 2003. ‘Hospitality Crisis Management Practices: The Israeli Case’. International Journal of Hospitality Management 22: 353–72.
Issa, I. & Altinay, L. 2006. ‘Impacts of Political Instability on Tourism Planning and Development: The Case of Lebanon’. Tourism Economics 12: 361–81.
Larsen, S. 2011. ‘Tourism in a Decade of Terrorism, Disasters and Threats — Some Lessons Learned’. Scandinavian Journal of Hospitality and Tourism 11: 215–23.
Lee, C-K., Kang, S., Reisinger, Y. & Kim, N. 2012. ‘Incongruence in Destination Image: Central Asia Region’. Tourism Geographies 14: 599–624.
Lee, H., Guillet, B., Law, R. & Leung, R. 2012. ‘Robustness of Distance Decay for International Pleasure Travelers: A Longitudinal Approach’. International Journal of Tourism Research 14: 409–20.
Mishkin, S. 2012. ‘Chinese Tourists Boost Taiwan’s Economy’. Washington Post. 30 August. http://articles.washingtonpost.com.
Murphy, L., Benckendorff, P., Moscardo, G. & Pearce, P. 2012. Tourist Shopping Villages: Forms and Functions. London: Routledge.
National Visitor Safety Program 2008. ‘National Visitor Safety Handbook’. Tourism Australia. www.tourism.australia.com.
Novinite.com 2012. ‘Tourists [sic] flows from Israel back to normal — Bulgarian minister’. 25 August. www.novinite.com.
ONT 1998. A Monthly Facts Sheet on the Economic Impact of Tourism and the Latest Visitor Arrival Trends. Canberra: Office of National Tourism. August.
Ospina, G. 2006. ‘War and Ecotourism in the National Parks of Colombia: Some Reflections on the Public Risk and Adventure’. International Journal of Tourism Research 8: 241–46.
Pegas, F. & Stronza, A. 2010. ‘Ecotourism and Sea Turtle Conservation in Praia do Forte, Brazil’. Conservation and Society 8: 15–25.
Population Reference Bureau. 2011. ‘2010 World Population Data Sheet’. www.prb.org.
Prokkola, E. 2010. ‘Borders in Tourism: The Transformation of the Swedish-Finnish Border Landscape’. Current Issues in Tourism 13: 223–38.
Rittichainuwat, B. 2013. ‘Tourists’ and ‘tourism suppliers’ perceptions toward crisis management on tsunami. Tourism Management 34: 112–21.
Silveiro-Neto, R., & Azzoni, C. 2006. ‘Location and Regional Income Disparity Dynamics: The Brazilian Case’. Papers in Regional Science 85: 599–613.
Smith, V. L. 2004. ‘Tourism and Terrorism: The “New War” ’. In Aramberri, J. and Butler, R. (Eds) Tourism Development: Issues for a Vulnerable Industry. Clevedon, UK: Channel View, pp. 275–90.
Timothy, D. 2012. Tourism and Political Boundaries. London: Routledge.
Tourism Queensland 2013. ‘Gold Coast, Famous for Fun’. www.tq.com.au/tqcorp_06/destinations/gold-coast-and-hinterland-zone/gold-coast/marketing/gold-coast-brand/gold-coast-famous-for-fun.cfm.
TRA 2007a. ‘Outbound Trips: Domestic Market Tourism Facts, Year Ending March 2007’. www.tra.australia.com.
TRA 2007b. ‘Travel by Australians, December 2007: Quarterly Results of the National Visitation Survey’. www.tra.australia.com.116
TRA 2008. ‘International Visitors in Australia, March 2008: Quarterly Results of the International Visitation Survey’. www.tra.australia.com.
TRA 2012a. ‘Tourism Industry Facts & Figures At a Glance’. September. www.ret.gov.au.
TRA 2012b. ‘Travel by Australians, September 2012: Quarterly Results of the National Visitor Survey’. www.ret.gov.au.
TRA 2012c. ‘International Visitors in Australia, September 2012: Quarterly Results of the International Visitor Survey’. www.ret.gov.au.
TravelChinaGuide.com 2012. ‘China outbound tourism in 2011’. www.travelchinaguide.com.
Turner, L. & Ash, J. 1975. The Golden Hordes: International Tourism and the Pleasure Periphery. London: Constable.
UNWTO 2012a. ‘UNWTO Tourism Highlights: 2012 Edition’. http://mkt.unwto.org.
UNWTO 2012b. Compendium of Tourism Statistics: Data 2006–2010. Madrid: UNWTO.
Weaver, D. 2005. The distinctive dynamics of exurban tourism. International Journal of Tourism Research, 7, 23–33.
World Bank 2011. ‘Data: Brazil’. http://data.worldbank.org/country/brazil.
Yeoh, E., Othman, K. & Ahmad, H. 2013. ‘Understanding Medical Tourists: Word-of-mouth and Viral Marketing as Potent Marketing Tools’. Tourism Management 34: 196–201.
Zhang, G., Pine, R. & Zhang, H. 2000. ‘China’s International Tourism Development: Present and Future’. International Journal of Contemporary Hospitality Management 12: 282–90.
..................Content has been hidden....................
You can't read the all page of ebook, please click here login for view all page.