
Economic impacts of tourism
LEARNING OBJECTIVES
After studying this chapter, you should be able to:
name the top destination countries in terms of tourism revenue earnings, compare these with the top stayover-receiving countries, and explain any discrepancies
outline the main positive and negative economic impacts of tourism and describe how each negative impact acts as a counterpoint to one or more of the positive impacts
explain the concept of the tourism multiplier effect and describe the circumstances under which a high or low multiplier effect is likely to occur
describe how tourism can function as a propulsive activity within a growth pole strategy
differentiate between the informal and formal sectors and describe the positive and negative implications of each for destination management
identify the circumstances under which a destination is more likely to experience negative rather than positive economic impacts from tourism
discuss the negative consequences of revenue leakages for a destination and explain where and why they occur226
explain the fluctuating patterns of demand that characterise tourism and the economic implications of these fluctuations for destinations
indicate the circumstances under which tourism can move from a competitive relationship with agriculture to a complementary one
discuss employment-related problems that are associated with tourism.
 INTRODUCTION
Marketing, as discussed in chapter 7, is a pervasive process which includes attempts to attract and retain a customer base for individual tourism-related businesses or entire destinations. Once the customer–product link is established, however, a range of potential positive and negative impacts is possible and these must be taken into account in the strategic management and planning undertaken by destination managers. It is common in the tourism literature to distinguish between economic, sociocultural and environmental impacts. This tendency to use discrete categories, however, should not distract from the fact that impacts are often closely interrelated. For example, negative social reactions to tourism could result from residents’ perceptions of accompanying economic and environmental costs. The placement of economic impacts as the first topic of discussion in this chapter does not imply that these are inherently any more important than the sociocultural or environmental dimension. Rather, this reflects the primary importance that destination managers and politicians have tended to place on economic benefits as a primary rationale for pursuing tourism. The structure of this chapter is straightforward, with the following section examining the potential economic benefits of tourism and the final one considering the potential economic costs.
ECONOMIC BENEFITS
When tourism emerged as a significant economic sector in the decades after 1950, most researchers and government administrators assumed its growth to be an inherently positive and desirable process. Conspicuous by its absence through the 1950s and 1960s was any concerted critique of tourism, prompting the description of this period as the era of the advocacy platform (see chapter 1). It is essentially this perspective that is conveyed in the following discussion of economic benefits.
Direct revenue
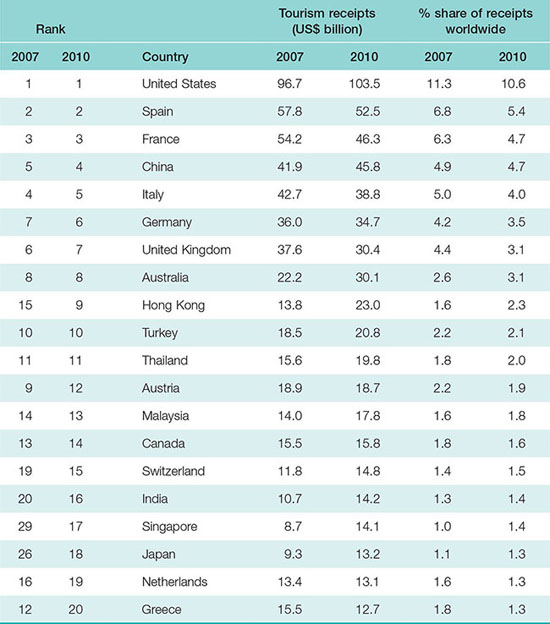
The prospect of substantial tourism-derived direct revenue has long been the most compelling incentive for destinations to attract and support tourism activity. Fuelling this incentive are the global tourism revenue figures reported since 1950. International tourism receipts are defined by the UNWTO (2013) as encompassing all consumption expenditure, or payments for goods and services, made for (or during) trips by international tourists (stayovers and excursionists) for their own use or to give away. Due largely to inflationary effects, these receipts have increased at a substantially higher rate than the actual global intake of international stayovers, and exceeded one trillion US dollars in 2012 (see table 3.1). In 2010, the top 20 revenue-generating countries each gained at least US$12 billion in receipts from international tourism (see table 8.1).227
TABLE 8.1 World’s top 20 tourism earners, 2007 and 2010
Source: UNWTO (2008, 2011a)
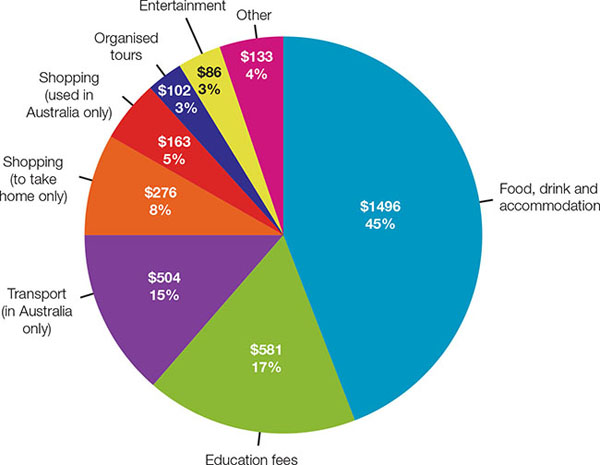
These figures do not reflect all expenses that are incurred by tourists, but only those that accrue to the destination itself. The first component of these accruing expenditures involves those paid in advance in the origin region, as through a package tour arrangement with an Australian tour operator, while the other component involves money spent in the actual destination. The latter is usually characterised by a diverse array of expenditure categories. In the Australian inbound context, food, drink, accommodation, transport and shopping are revealed as major areas of expenditure (see figure 8.1). These proportions are usually calculated based on exit surveys subject to a high margin of error; however, emerging technologies have the potential to reduce this error through more accurate expenditure monitoring of an increasing array of goods (see Technology and tourism: Brave New World of RFID). Education fees are also extremely important with regard to average expenditures, but skew the overall pattern because they pertain only to the relatively small cohort of inbound tourists who are international students.
228FIGURE 8.1 Average expenditure for all visitors to Australia by expenditure category, year ending September 2012
Source: TRA 2012
technology and tourism
 BRAVE NEW WORLD OF RFID

RFID (Radio Frequency IDentification) is a technology that involves devices attached to or embedded within an object or person to facilitate tracking and monitoring. Such devices have existed since the 1960s, but in the 2000s they became sufficiently inexpensive and sophisticated to warrant large-scale application. Common uses of this technology include inventory and supply chain management, and placement in animals to locate lost pets or stolen livestock. In tourism, RFID has the potential to greatly improve calculations of economic impact by its capacity to track all movements and expenditures of enabled tourists within a designated area (e.g. a hotel or a municipality). Information that can be collected includes the description of the good or service, its price, location and time of purchase. Cumulatively, this would yield extremely accurate information that would help to justify further tourism investments and identify ‘hotspots’ of direct economic impact. Also, demographic and other information about the purchaser can be correlated with purchasing information to facilitate market segmentation and target marketing. Other tourism-related applications include control of tourist access to areas (e.g. via wristbands 229worn by passengers on cruise ships), service customisation through database marketing, and devices that give users information about nearby attractions and services (Öztayşi, Baysan & Akpinar 2009). Currently, RFID has not yet been widely adopted in the tourism sector. However, as such applications expand, concerns are being raised. For some, greater convenience and more accurate accounting are offset by the invasion of privacy. To what extent do companies and governments have the right to monitor the behaviour of people and collect personal data without their knowledge or permission? The Orwellian scenario sees RFID embedded in all people so that the Big Brother state can monitor and control all activity — creating the ultimate surveillance system. This perhaps is not a far-fetched possibility, given widespread fears of terrorism and crime, and the subsequent willingness of many people to sacrifice much of their personal freedom to feel more secure.
Taxation revenue
Subsumed under the umbrella of tourism receipts are government levies such as the Australian passenger movement charge (PMC) — a departure tax that comprises a $55 fee (as of 2013) paid by all departing inbound visitors and outbound Australians. Governments regard taxes as an attractive form of revenue generation, and one that costs little to collect. Taxes are often hidden as part of a package tour arrangement, as part of an airline ticket price (in the case of the PMC) or within the overall cost of a good or service, so that the consumer is unaware of their existence. In addition, taxes can be increased substantially without bringing about a significant negative response from the tourist market. This is because taxes usually comprise only a very small portion of the overall trip expenditure. For example, a 100 per cent increase in a $10 departure tax will not add significant costs to a $3000 trip. Governments, on the other hand, stand to gain a substantial increase in revenue from the cumulative intake of such a doubled levy (e.g. 500 000 inbound tourists paying a departure tax of $20 each instead of $10 equates to added revenue of $5 million). Nevertheless, the Tourism and Transport Forum (TTF), a major Australian industry lobby group, estimates that the PMC reduces inbound visitor expenditures by $814 million per year (Creedy 2012).
Common examples of tourism-related taxation include airport departure taxes (e.g. the PMC), bed (or hotel room) taxes, permits for entry to public attractions such as national parks, entry or transit visas, and gaming licences. Tourists also generate taxation revenue through the purchase of goods and services subject to sales tax (e.g. Australia’s GST) and other levies, although some of this can be recovered by departing tourists taking advantage of tax rebate programs such as Australia’s Tourist Refund Scheme. Bed and sales taxes are examples of ad valorem taxes (that is, they are set as a percentage of price), while departure taxes and visas are specific (that is, they are set at a given price for each tourist). More unusual are taxes directed at the outbound tourist flow, which are usually implemented to reduce the loss of foreign exchange.
Influence of other government departments
One potentially frustrating aspect of taxation from the destination manager or tourism department’s perspective is the control exercised by destination government departments not directly related to tourism, which may not always be sympathetic to the interests of the tourism sector. For example, the Department of Immigration and Citizenship (DIAC) is the Australian federal body responsible for issuing and pricing visas and for establishing qualification requirements. A possible decision to ease or 230tighten these requirements, to greatly increase the visa costs or to take more time in processing applications could thus create a major deterrent to travel that the tourism stakeholders have little power to control, except perhaps through the lobbying of groups such as the TTF. Conversely, the introduction of the Electronic Travel Authority (ETA) in 1996 and the more recent eVisitor program for European visitors illustrates how agencies such as DIAC can facilitate tourism by expediting application procedures. The ETA can be obtained by potential visitors from qualifying countries (e.g. major markets such as the United States, Canada, Japan, Singapore, Hong Kong and South Korea) in just a few minutes from the agency website for a small fee ($20 in 2013). It replaces the visa stamp normally affixed to the traveller’s passport, and when the tourist arrives at the airport to board their flight to Australia, check-in staff can quickly confirm electronically whether they are ETA approved. In general, however, concerns continue to be expressed within the tourism industry in Australia and elsewhere over the increasing tendency of governments to regard tourism as a revenue-generating ‘cash cow’, with little of the revenue typically re-invested within the tourism industry itself.
Strategies to increase direct revenue
Tourism receipts (taxes aside), can be expanded by increasing:
the number of visitors
their average length of stay
their average daily expenditure (see figure 8.2).
FIGURE 8.2 Factors influencing tourism revenue in a destination
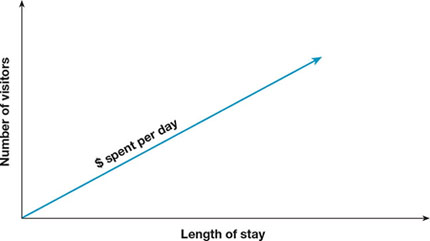
Most basic is the visitor intake, and it is the fluctuation in this statistic that usually attracts the greatest attention. However, it is the average length of stay and the amount spent per day that determine the amount of revenue generated by these tourists. The impact of these factors among different market segments is demonstrated by the contrasting length of stay and spending patterns of Japanese and Chinese inbound tourists to Australia. As depicted in table 6.1, Chinese visitors spend less per day, but more overall due to their much longer stay. Accordingly, many destinations devise strategies that encourage longer vacations and high-spending (or ‘high yield’) market segments (see Contemporary issue: Making South Australia a lifestyle destination). In some cases, a ‘quality’ over ‘quantity’ approach is deliberately implemented to reduce the social and environmental impacts of high visitation levels (see chapter 9).231
contemporary issue
 MAKING SOUTH AUSTRALIA A LIFESTYLE DESTINATION

South Australia has long been disadvantaged in the competition with other states for tourists by the lack of large gateway cities, an exceptionally dry climate, and a poorly articulated destination image. In response, government marketing strategies have recently focused on the culinary based lifestyle tourism that is supported by the excellent food and wine produced in the state’s regions that share a southern Mediterranean climate. A recent marketing campaign, ‘South Australia. A brilliant blend’, captures this culinary focus and suggests a complementary combination of different types of attractions or ‘ingredients’ (South Australia 2012). This culinary focus not only capitalises on a competitive advantage, but cultivates a high-yield market that is deemed to have high destination loyalty and fewer proclivities to confine visits to a particular season. A survey of 476 tourists collected in Adelaide, Barossa Valley, Flinders Range, Kangaroo Island, McLaren Vale and the Fleurieu Peninsula supported this assumption (Gross, Brien & Brown 2008). The majority of survey respondents were domestic; however, the international component was dominated by high-spending Europeans. Most arrived in South Australia by car, over one-half had a university degree, and their mean annual income was higher than the Australian average. The survey found that tourism was an important part of their lives that facilitated self-expression. South Australia’s food and wine provided a desired kind of experience that entailed high levels of involvement and authenticity, and led to expressions of place identity and loyalty. This suggests a higher probability of longer trips and repeat visits, perhaps even in off-season times when different food and wine products might be available. Occupancy rates in 2011 for hotels, motels and serviced apartments with at least 15 rooms indicate relatively minor seasonality effects, ranging from just under 60 per cent in July to just over 70 per cent in October (SATC 2012).
Contribution of tourism to GDP
Tourism receipts, while a crucial indicator of the sector’s size, cannot be used on their own to compare tourism’s relative importance from one destination to another or within the overall economy of a particular destination. To facilitate such comparisons, the value of international tourism receipts is commonly calculated for a one-year period as a percentage of a country’s gross domestic product (GDP) (see appendix 2). There is no definitive percentage threshold that differentiates the countries where tourism is a critical component of the economy. However, a 5 per cent figure can be taken to indicate a highly significant contribution in the absence of more sophisticated techniques, such as the Tourism Satellite Account (TSA), that more accurately measure tourism’s economic contribution but are just starting to be widely adopted.
The most recent statistics on the contribution of international tourism receipts to GDP, available for 155 countries or dependencies, are shown in appendix 2. Of these, at least 52 (or 34 per cent) met or exceeded the 5 per cent criterion. However, about one-half of these destinations are pleasure periphery SISODs (see chapter 4), some of which display a pattern of ‘hyperdependency’ on tourism. Extreme cases included Macau (98.9 per cent), Anguilla (44.4 per cent), Aruba (51.6 per cent), Maldives (33.8 per cent) and St Lucia (33.5 per cent). Notably, many destination countries with large absolute 232tourism receipts, such as the United States and France, had a relatively small GDP contribution from tourism (1.1 per cent and 1.8 per cent, respectively). This apparent anomaly reflects the immense and highly diverse economies of these countries, wherein even a very large tourism industry still represents only a small portion of overall economic output. This also applies to Australia, which derived 2.8 per cent of its GDP from international tourism receipts in 2011–12 (ABS 2013a). Such statistics are critical in determining the allocation of government resources to the tourism sector, and therefore any policies or initiatives that reduce the percentage contribution to GDP constitute a serious threat to destinations.
Indirect revenue
The economic impact of tourist expenditures on a destination does not end once the tourists have paid their money directly to the supplier of a commercial tourist product. Rather, indirect revenues continue to be generated by the ongoing circulation of these expenditures within the economy of the destination (Cooper et al. 2008). This multiplier effect has both an indirect and induced component that come into play once the direct (or primary) impact, that is the actual spending of money by the tourist, has taken place (see (a) of figure 8.3). The first-round indirect impacts, (b), occurs when the business (e.g. a hotel) uses a portion of these direct expenditures to purchase goods (e.g. food, pool-cleaning equipment) and pay wages to its employees. Second-round indirect impacts, (c), then occur when the suppliers of these goods and services use a portion of revenues received from the hotel to buy goods and services for their own use. This process continues into subsequent rounds, (d), although the revenues involved by this time are substantially diminished and often very difficult to trace.
FIGURE 8.3 The multiplier effect in tourism: a simplified example
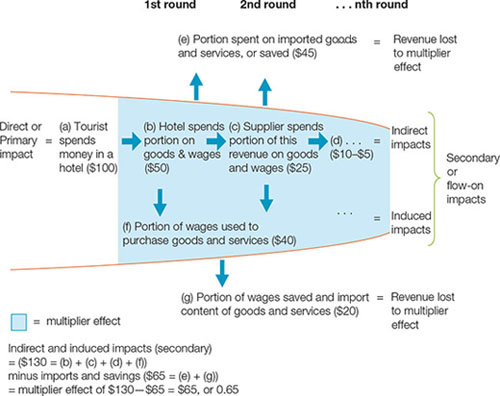
Through each round of indirect impact, revenues are lost to the destination multiplier effect due to the purchase of imported goods and services, and the allocation of money to savings, (e). If the initial hotel purchases in stage (a) are all allocated to imported goods and services, then essentially no multiplier effect takes place (i.e. there is no circulation of any portion of the revenue within the destination). Also in each indirect impact round, the multiplier effect is increased by induced impacts that take place when wages paid by the hotels and their suppliers are used by employees to purchase goods and services such as televisions, food, cars and haircuts, (f). However, as in (e), the multiplier effect of these wages is also eroded by savings, and by the import component of the goods and services they purchase, (g). In simple terms (since its actual calculation is complicated), the multiplier effect is obtained by adding together the sequential rounds of the indirect and induced impacts (i.e. secondary (or flow-on) impacts), and subtracting the revenue that is lost through allocations to imports and savings. The hypothetical $100 initial expenditure shown in figure 8.3 thereby produces an additional multiplier effect of $65, or 0.65.
Higher multiplier effects as a general rule are associated with larger and more diverse destination economies, since these have the capacity to provide the array and magnitude of goods and services consumed by tourists, and hence allow for the sustained internal circulation of direct tourism revenue. An analysis of multiplier effect studies by Cooper et al. (2008) revealed a multiplier value range of 2.00–3.40 for medium to large industrialised destinations, but only 1.12–1.35 for rural economies. Relatively low figures, however, may be elevated and attained sooner through strategies that emphasise the consumption of local goods and services (see Breakthrough tourism: Faster multiplier effects through slow tourism).
breakthrough tourism
 FASTER MULTIPLIER EFFECTS THROUGH SLOW TOURISM
The concept of slow tourism emerged as a reaction to the perceived economic, social and environmental costs of conventional mass tourism. Like its ‘slow food’ predecessor, slow tourism seeks to counter the fast-paced, homogenised, pleasure-seeking character of mass tourism with high quality, lingering experiences that feature the local sense of place, foster discovery and learning, and benefit the local community (Heitmann, Robinson & Povey 2011). Destinations, accordingly, are situated as ‘places’ rather than ‘resorts’ or ‘holiday spots’. The primary way through which community benefits are obtained is through the consumption of local goods and services that are unique to that area. Thus, tourists consciously seek out distinctive local foods, accommodation and cultural performances, and in so doing keep these products viable while providing an incentive for increasing their supply and quality. Conway and Timms (2010) advocate slow tourism as an appropriate alternative for remote Caribbean destinations which lack the resources or desire to pursue conventional 3S resort tourism. They suggest further that the Caribbean diaspora in North America and the United Kingdom could make a valuable contribution as tourists and as returning entrepreneurs. The south-west coast of Jamaica, north-eastern Trinidad and central Barbados are identified as regions that, because they were left behind by conventional tourism development, can serve as potential slow tourism prototypes. However, as the concept begins to acquire traction, more questions emerge. 234For example, is slow tourism a substitute for mass tourism, more suitable for areas where the latter is not practical (Dodds 2012)? Also, if a destination’s slow tourism practices become popular, is there a risk that it will transform into mass tourism as more efforts are made to cater to a larger number of visitors? If so, would this be a negative development? It may be the case that most local people actually prefer mass tourism because of the larger gross economic benefits that it provides. These issues need to be considered as slow tourism moves to a more prominent aspirational position in tourism planning and management.
Economic integration and diversification
The multiplier effect is closely linked to the idea of backward linkages, which encompass the goods and services that ‘feed into’ the tourism industry through the indirect impacts described earlier. The link occurs when these goods and services are obtained from within the destination rather than through imports. The sectors that typically account for most of the backward linkages in tourism include agriculture and commercial fisheries, transportation, entertainment, construction and manufacturing. The full list of backward linkages in tourism is extensive and complex, attesting to tourism’s great potential to stimulate local economic integration and diversification, provided that these goods and services can be supplied from within the destination. For example, the manufacturing component in tourism ranges from the furniture and appliances used in resort hotels, to pool-cleaning equipment, kitchen utensils and bathroom sinks. In Australia, tourism accounted for about 3 per cent of the gross value added in the manufacturing sector, and about 2 per cent of agriculture, forestry and fishing during the early 2000s (TTF 2008a).
Employment (direct and indirect)
From the perspective of the destination community, the creation of jobs is an especially relevant reason for a destination to promote its tourism sector. Just how much employment tourism generates, however, is a subject of controversy. The World Travel and Tourism Council (WTTC) estimated a figure of 255 million jobs worldwide for 2012 (WTTC 2012), but such an impressive figure is only credible if calculated as the full-time equivalent of all tourism employment; that is, by combining the cumulative hours of several part-time and contractual employees to generate one full-time job equivalent and then adding all of these together to the actual full-time jobs. In 2010–11, there were 289 000 full-time and 224 000 part-time jobs in Australia directly associated with tourism (ABS 2011). Earlier research revealed that perhaps another 350 000 or more full-time job equivalents are indirectly associated with tourism, represented, for example, by the hours spent by construction workers building hotels, or by surgeons occasionally performing emergency operations on tourists (TTF 2008b). Both examples illustrate the multiplier effect that pertains to employment.
Regional development
Proponents of the advocacy platform, and other stakeholders, emphasise the effectiveness of tourism in stimulating the development of regions where economic options are otherwise constrained. The classic example is 3S (sea, sand, sun) tourism, wherein ‘unspoiled’ natural sites and regions possessing little value for most conventional economic activities have been redefined as valuable resources for the tourism industry. 235Environmental consequences aside, the rapid physical development of the European Riviera, the small islands of the Caribbean, Australia’s Gold and Sunshine coasts and other parts of the pleasure periphery is fundamentally an outcome of the sustained global demand for 3S tourism. A similar effect is evident in the ecotourism sector, which places a high value on rainforests, national parks and other natural settings as tourism venues (see chapter 11).
Other types of tourism product suited to marginal settings include the farm tourism sector (Ollenburg 2008) and ‘industrial tourism’ that valorises manufacturing relics of the past. Skiing and other winter sports have a substantial economic impact on Australia’s small alpine region and other peripheral mountain regions. Casinos, as noted in chapter 5, contribute substantially to the economic development of economically underdeveloped locations such as Native American reservations in the United States. In the Australian and New Zealand context, nature-based and cultural tourism are providing a stimulus for the economic development of historically marginalised indigenous communities as well as rural areas traditionally dependent on vulnerable primary sector activities such as forestry and fishing (see the case study at the end of this chapter).
Growth pole strategy
In most cases, the development of tourism in a peripheral area occurs as a spontaneous, market-driven process. However, there are countries where tourism is deliberately mobilised as a propulsive activity in a so-called growth pole strategy. Examples are found in Mexico (e.g. Cancún) and Indonesia (e.g. Bintan). In essence, this involves the establishment of resorts at a strategically selected location (i.e. the growth pole) as a way of stimulating economic development in the region. A growth pole strategy in tourism entails a sequence of stages along the following lines.
An appropriate site (the growth pole) is identified by government, usually in an economically marginal area that is deemed suitable for sustaining some predetermined form of tourism development such as 3S resorts.
Through government initiative and incentives, public and private investment is injected into this area, commonly in the form of subsidised facilities and infrastructure. These incentives reduce financial risk for investors.
This investment attracts employees, supportive services and other tourism facilities, often induced by continuing government incentives.
Economic growth eventually becomes self-sustaining and independent of tourism in a direct sense when a critical mass of residential population is attained (i.e. new investment and settlement is attracted by the large local market rather than by tourism opportunities per se). At this point, government incentives are normally withdrawn. At the same time, the developmental benefits of tourism ‘trickle down’ from the growth pole into the surrounding region.
The growth pole principle can also be applied at a local or micro-scale, for example by fostering the development of a single attraction to serve as a nucleus to attract additional investment and employment.
Formal and informal sectors
Managers and governments within most destinations usually assume that economic benefits are most efficiently achieved through a strong formal sector — that is, the component of the economy that is subject to official systems of regulation and taxation. Because the formal sector includes the largest and most technologically sophisticated 236businesses, it is seen as the primary generator of wealth and indicator of economic development.
In contrast, the informal sector is unregulated and external to the formal institutions of society. Participating businesses generally:
operate beyond the legal system
are not subject to formal quality control measures
are not registered or enumerated
do not provide regular working hours for their employees, and
do not officially pay any regular wages or taxes (Smith & Henderson 2008).
Because the informal sector cannot be measured or regulated easily, and because it does not generate tax revenue for government, public officials often try to suppress, or at best ignore, this element. A large informal sector, in addition, is psychologically perceived as an indicator of economic underdevelopment, and its incorporation into or replacement by the formal sector is therefore generally seen as a prerequisite for attaining Phase Four status as per Burton’s model (see table 3.2).
FIGURE 8.4 Souvenir vendors at the Great Wall

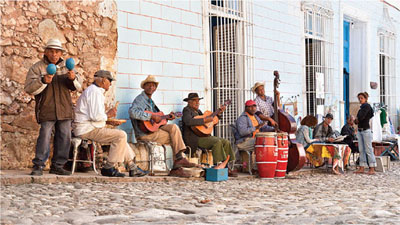
Within the tourism industry, the informal sector is often criticised by the formal sector and government for its ‘harassing’ and ‘unprofessional’ attitude towards tourists, who are thought to be offended by the often aggressive behaviour of souvenir hawkers and other itinerant businesspeople. This argument relates directly to the concept of inseparability, and the consequent importance of service quality control, as discussed in chapter 7. However, the formal sector also opposes the informal sector because it captures a significant portion of tourist expenditures and may be perceived by many tourists as a more authentic form of host–guest encounter. This is a valid argument in many emerging economies, where a substantial and highly visible informal sector paralleling the mainstream tourism system is evident in tourism subsectors such as guest houses, services and crafts-related activities, souvenir vending (see figure 8.4), prostitution, guiding, pedicab driving, markets, beach hawking and food stalls.
Government authorities often harass and discourage such operations, and only in a few isolated instances — such as the Indonesian city of Yogyakarta (Dahles 2001) — have they attempted to work out a mutually-beneficial strategy of peaceful coexistence or cooperation. In the case of Yogyakarta, the positive attitude was prompted by the realisation that street vendors are a major tourist attraction in their own right, as well as a major employer that forms robust backward linkages with local industry and has great resilience in adapting to changing conditions. This resilience was demonstrated during the post-tsunami recovery of tourism in Phuket, Thailand (see the case study at the end of chapter 2). The informal tourism sector also exists within many MDCs, but is less visible and less of a ‘problem’ because of the overwhelming dominance of formal sector businesses.
ECONOMIC COSTS
As the size and scope of the global tourism industry continued to increase through the late 1960s and 1970s, evidence accumulated that the economic benefits of the sector were accompanied by various costs. It was in response to this evidence that the 237cautionary platform emerged within the field of tourism studies to argue that the economic, sociocultural and environmental costs of unregulated tourism tend to outweigh its benefits. Destination managers, they argued, should therefore be extremely cautious about pursuing tourism in an uncritical way (see chapter 1). This section considers the major economic costs that are potentially incurred by tourist destinations, and is thus essentially a summary of the cautionary platform’s economic critique.
Direct financial costs
Proper assessments of revenue intake from tourism should first of all take into account the direct financial costs that are necessarily incurred by the public sector to generate and sustain this intake in order to avoid market failure. To point out these particular costs is not to be critical, but merely to indicate that tourism, as with any other economic activity, requires financial investments to realise financial benefits. The situation in Australia illustrates the nature and magnitude of these costs. In the 2012–13 fiscal year, the federal Department of Resources, Energy and Tourism (DRET), the agency responsible for tourism during that period, committed about $168 million to tourism promotion and development. As depicted in table 8.2, the largest single allocation involved advertising through Tourism Australia.
TABLE 8.2 DRET funding allocations to tourism 2012–13
Source: Data derived from DRET (2012), Tourism Australia (2012)
| Funding area | Amount ($000) |
|
Tourism Australia Major items ($000): Advertising Promotion and publicity Wages and salaries Research, service fees & travel Other |
69039 22324 21364 10289 7162 |
Subtotal |
130178 |
Departmental expenses |
21173 |
Asia Marketing Fund |
8500 |
T-QUAL Grants |
8309 |
National Tourism Accreditation |
50 |
Total |
168210 |
To these amounts should be added a similar spectrum of cost allocations incurred at the state and territory level. For example, Tourism Queensland, which is similar to Tourism Australia in its mandate and responsibilities, reported expenses of $66.5 million in 2011–12 (Tourism Queensland 2012).
Direct incentives, usually disbursed by nontourism agencies within government, constitute a distinct set of costs in the development of the tourism sector (Wanhill 2005). Potential entrepreneurs are usually willing to commit their own resources into a project in anticipation of strong profits. However, in more uncertain situations, destination governments may have to entice these entrepreneurs with capital grants, labour and training subsidies or the provision of infrastructure at public expense (as demonstrated in growth pole strategies). Incentives are more likely to be necessary 238when several destinations offer a similar product, such as a generic 3S experience, and therefore must compete with each other for investment. In such a situation, the entrepreneur will usually locate within the destination that offers the most lucrative incentive package, all other things being equal. Where a destination, in contrast, is in a monopolistic situation of offering iconic attractions (as with Niagara Falls, Uluru, the Sydney Opera House or the Eiffel Tower), the level of anticipated long-term demand is more likely to attract entrepreneurs even without the offer of incentives.
Indirect financial costs
A major thrust of the cautionary platform was its emphasis on the substantial indirect financial costs that are incurred by tourism in a destination. The best-known are the costs subsumed under the category of revenue leakages. Some or all of the following leakages may curtail the circulation of tourist receipts in the destination economy as depicted in segment (e) of figure 8.3, and thereby erode the multiplier effect:
imported current goods and services that are required by tourists or the tourist industry (e.g. petrol, food)
imported capital goods and services required by the tourist industry (e.g. hotel furnishings, taxis, architect’s fees)
factor payments abroad, including repatriated profits, wages and hotel management fees
imports for government expenditure (airport, road and port equipment)
induced imports for domestic producers who supply the tourist industry (e.g. fertiliser to grow the food consumed by tourists).
Serious revenue leakages, as suggested earlier, are more likely to occur in small and specialised economies, given their lack of capacity to supply the goods and services required by the local tourism industry. In addition, the relatively small populations of these destinations cannot normally supply sufficient investment capital to sustain desired levels of tourism development. Severe revenue leakages are associated with enclave resort situations, or self-contained facilities where patrons are discouraged from spending their money outside of the operation’s confines, and where most of the goods are imported from beyond the local community (Anderson 2011). More broadly, the term enclave tourism has been used to describe formal sector tourism industries in particular regions, such as the Okavango Delta of Botswana that are controlled by foreign interests, include enclave resorts, and have weak linkages with the local economy (Mbaiwa 2005). They may also be induced more indirectly by the demonstration effect of tourism, where for status or role-model reasons, locals seek to emulate the behaviour of tourists by consuming the imported goods favoured by the tourists (Huybers 2007).
Problems with revenue leakage
Revenue leakages are regarded as insidious for several reasons, particularly when the leakages accrue to a different country rather than another region within the same country.
They siphon away circulation effects (i.e. the multiplier effect) that could benefit the economy of the destination.
The cumulative indirect component is less tangible and harder to measure than direct expenses, and therefore more difficult to quantify as a first step towards addressing the problem.239
Even if they can be measured, their existence usually reflects basic shortcomings in the economic structure of the destination that are extremely difficult — if not impossible — to resolve.
Imports not only dissuade local entrepreneurs from supplying similar goods, but they may displace existing local (i.e. small-scale) producers who cannot match the quality, price or quantity provided by the exporter.
The presence of leakages implies, to a greater or lesser extent, an economic dependency of the destination on the exporter, which constrains the ability of destination stakeholders to manage their own affairs. This is especially problematic when businesses are dominated by expatriate managers and investors.
For all these reasons, integrated and long-term tourism management strategies should strive to build linkages between tourism and the destination economy, so as to reduce the potential for revenue leakage and maximise the multiplier effect.
Indirect incentives
Augmenting the direct incentives outlined in the ‘Direct financial costs’ section are various indirect incentives. These include preferential or reduced interest rates, the provision of land for sale or lease on favourable terms, depreciation allowances, tariff and quota exemptions on tourism-related imports, and tax holidays. An example of the latter is the ten-year tax-free period commonly offered to developers who construct hotels of a certain size in the Caribbean. Other indirect incentives include loan guarantees and special depreciation allowances on tourism-related capital goods. Such provisions are often more popular in governments than direct incentives because they do not involve the direct outlay of money. Rather, governments obtain less revenue than they would if the incentives were not offered (e.g. the interest realised at full market rates rather than at reduced interest rates).
Fluctuations in intake
A stable and predictable flow of inputs and outputs in many industries contributes to financial stability and facilitates the management process, as enormous investments in time and energy are not required to gauge and prepare for continual changes in the supply/demand equation (see chapter 7). The dairy industry is an example of a sector with low demand uncertainty. Demand in this sector is not significantly influenced by weather or other changeable factors, nor is the market likely to suddenly stop purchasing dairy products. In addition, since consumers in countries such as Australia consider dairy products to be a basic necessity, consumption patterns will not be seriously affected by a downturn in the economy.
Supply-side factors
Tourism is an example of an activity that is frequently at the opposite end of the spectrum to the dairy industry, being highly vulnerable in some manifestations to changes in weather, fashion and sociopolitical conditions. It is worth re-emphasising that the in situ nature of consumption inherent in tourism is one reason for this uncertainty in demand. Tourists must travel to the place of ‘production’ (i.e. the destination), whereas dairy products exhibit the opposite tendency; they travel from the place of production to the homes of consumers. Supply-side disruptions within the destination, such as political uncertainty or a disruption of infrastructure, thus have a major and sometimes overwhelming bearing on visitor intakes (see chapter 4). Factors that are not specific to particular destinations can also be influential, as indicated by 240the 12–14 per cent decrease in global travel reservations that followed the terrorism actions of September 2001, and the 26 per cent decrease in the number of inbound tourists to Thailand in January 2005 (i.e. the month following the tsunami) over the same month in 2004 (ILO 2005). More recently, the 2011 Tōhoku tsunami and Fukushima Daiichi nuclear disaster contributed to a 24 per cent drop in foreign tourists to Japan for the year compared with 2010, aided by the stronger Japanese yen (Demetriou 2012).
Demand-side factors
Also by way of reiteration, demand-side factors such as the availability of discretionary income have a particularly harsh effect on tourism, given its status as an essentially luxury or discretionary product. Most consumers will direct their first cutbacks towards their tourism activities rather than basic food products should disruptions in the economy reduce their discretionary income or generate feelings of financial insecurity. As noted in chapter 7, tourism suffers an additional liability in that the products cannot be stockpiled — an empty hotel room produces no economic value, but is a fixed cost that still requires maintenance, mortgage repayment etc.
These cautionary comments about the instability of tourism demand and supply do not contradict earlier information in this textbook that claims a positive global outlook for the tourism sector. Rather, problems can arise for managers when the patterns and underlying factors that apply at the global level are assumed to be valid for individual destinations as well. In other words, the steady growth experienced worldwide represents a pattern of cumulative behaviour that does not necessarily indicate the performance of specific destinations, which varies greatly. For any individual destination country, a similar analysis of arrival trends since 1950 would likely reveal a much higher level of fluctuation.
Seasonality
The tendency to report destination arrival data for an entire year (as in table 3.1) is misleading for similar reasons, since such statistics usually disguise significant variations in intake that affect the supply/demand equilibrium over the course of the year. These temporal variations are caused partially by predictable demand-side factors such as holiday time availability in the origin markets (e.g. summer holidays, winter break). However, equally or more influential are supply-side factors such as changing opportunities in attractions and activities and how much the destination is dependent on these changeable products. Resorts that are dependent on winter sports or 3S-based activities readily come to mind as tourism products that are subject to obvious and significant seasonal variations in demand.
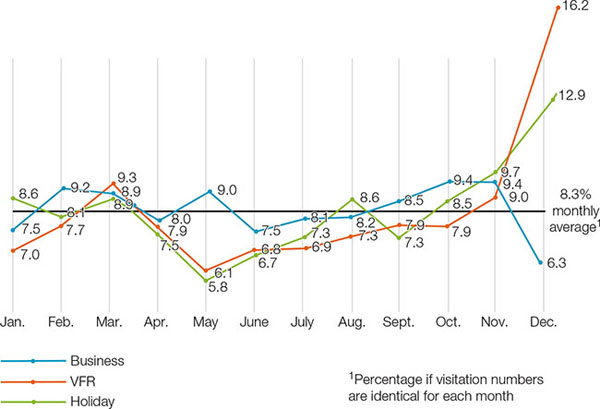
Australia is not plagued by seasonality to the same extent as pleasure periphery destinations such as the Caribbean, partly because of the diversity of major market sources and variations in their peak periods of outbound travel. Substantial variations in climatic conditions within Australia at any given time mean additionally that there is no particular season in which the country can be uniformly characterised as ‘hot’ or ‘cold’. Yet, as depicted in figure 8.5, diverse seasonality effects are still evident within the inbound business, VFR and holiday segments. During May 2012, holiday and VFR visitors were at their lowest level of the year while business travel was above average. The opposite effect is evident in December, when holiday and VFR traffic was at its greatest level by far due to the Christmas and New Year holiday time. The three markets, in contrast, experience an almost identical pattern during March and November.
241Where strong seasonal variations are part of the normal annual tourism cycle of a destination, a large amount of economic and social disruption can occur if appropriate compensating measures are not taken by tourism managers. The problem can be described as one of undercapacity and overcapacity, or to use an analogy from the farming sector, a ‘drought-flood’ cycle. In the context of the supply/demand matching strategies outlined in chapter 7, the off-season is a period when supply exceeds demand, while the high season is characterised by an excess of demand over supply. During the off-season, low occupancy rates result in reduced business, which subsequently reverberates in a negative way throughout the economy and labour force in a sort of reverse multiplier effect. In contrast, the high season is often characterised by overbookings, stress on infrastructure, overcrowding, and shortages of goods and services (which may in turn give rise to inflation).
FIGURE 8.5 Seasonality in selected Australian inbound tourist segments in 2012 (Percentage distribution by month)
Source: Data derived from ABS (2013b)
Strategies that individual companies can adopt to address seasonal and other demand fluctuations have been outlined in chapter 7. Destination managers, however, are more constrained in their options, because they can only influence the strategies and tactics of the businesses that dominate the tourism sector, while controlling only a portion of the sector themselves. One option for destination governments is to stimulate alternative but complementary economic activities such as hi-tech industries, so that the off-season effect in tourism is offset by the continuing and more stable output from these other sectors.
Within tourism itself, local governments can withdraw or restrict certain variable cost services, such as beach patrolling and garbage collection. They can also promote their destination to markets that have unconventional or more evenly distributed patterns of seasonal travel. VFR tourists are an excellent example of a market that is not as susceptible to seasonality effects (Backer 2012). From the perspective of geographical 242segmentation, Gold Coast tourism managers actively market in the United Arab Emirates and other Middle Eastern countries, recognising that their residents are more likely to visit Australia in the winter off-season when temperatures in the Middle East are at their highest. Other strategies include the development of attractions and activities that will draw visitors during the off-season. An example of off-season adaptation of infrastructure is found at the Australian ski resort of Thredbo, where otherwise unused ski lifts provide scenic rides to summer visitors as well as access to walking tracks in the high meadows around Mt Kosciuszko.
Fashion
Much less predictable than the seasonal variations are the effects of fashion. As discussed in chapter 4, this is demonstrated by the shifting perceptions in ‘Western’ societies towards sunbathing, beaches and water sports, which became popular during the Industrial Revolution but may eventually fall out of general favour due to concerns about skin cancer. This would force 3S destinations to develop and promote alternative tourism products.
Another perspective on fashion is the rise and fall of specific destinations. Places often become fashionable due to novelty and curiosity, but are soon superseded by newer destinations offering a similar (i.e. easily substitutable) product. Thus, St Lucia may have the status of being the ‘in’ Caribbean destination one particular year, only to be replaced, in turn, by Anguilla, St Martin and Grenada. This effect is experienced in many other industries, but one dilemma for tourism is the tendency in destinations to acquire an accommodation inventory commensurate with the level of near-peak demand. When visitor arrivals decline because of the fashion factor (as opposed to the cyclic seasonal effect), the specialised nature of hotels means that they are difficult to convert permanently to other uses when high fixed costs become too much of a burden. The fashion effect is closely associated with the resort cycle concept, which is discussed in chapter 10.
Vulnerability to instability
More uncertain and potentially harmful than the vagaries of fashion are the effects of social and political instability within or in the vicinity of a destination. This characteristic of tourism cannot be overstated. Especially insidious is the potential for just one random and completely unpredictable act of terrorism or sabotage to cripple a destination’s tourism industry, as demonstrated by the September 11 terrorist attacks on the United States, as well as those on Bali and Mumbai in 2002 and 2008 respectively. Even though little can be done to prevent such occurrences, tourism managers need to be aware of this vulnerability, and of the possibility that very positive growth performance can be reversed in an instant. Accordingly, a holistic and resilience-focused strategy of broader economic diversification — both internal and external to tourism — would help to cushion such impacts, as it would with seasonal variations.
Competition with other sectors
The multiplier effect is attractive because it stimulates a diverse local, regional or national economy through the generation of significant linkages within the destination. In some cases, however, a competitive rather than a complementary relationship evolves between tourism and other sectors in the local economy. It was noted earlier, for example, that tourism-induced food imports may displace or dissuade local production if the scale economies of the exporter and the bilateral trade environment 243are such that a cheaper, reliable and better quality non-local product can be offered to the hotels.
Further marginalisation of agriculture occurs because of tourism’s status as a more competitive bidder for land. A golf course or resort hotel, for instance, represents a far more lucrative use of prime agricultural land than a sugar cane plantation. Where farming is already a marginal activity, as the sugar industry was on the Caribbean island of Antigua in the 1960s, tourism serves to accelerate its decline by offering strategically located land owners a viable alternative land use. Finally, the opportunity cost of using a resource for tourism over some other activity should be taken into consideration. Money or space allocated to tourism, in effect, is money or land denied to agriculture or other alternative sectors, which thus represents a forgone (and possibly better) opportunity for the destination. This effect has been noted along the coast of Kenya, where the protection of coral reefs for the benefit of high-yield foreign tourists has resulted in the loss of fishing opportunities for the local community as well as the loss of local knowledge and interest in managing this resource for such a purpose (Hicks et al. 2009).
Employment problems
It cannot be denied that tourism is an efficient generator of direct and indirect employment, but the nature of this employment may not always be conducive to the comprehensive economic development of the destination or the material wellbeing of its residents. Wages in the tourism sector tend to be low compared with other sectors, with ‘accommodation and food services’ workers in Australia earning average weekly wages of $539 in May 2012 compared with the national average of $1123, and $2388 in the mining sector (ABS 2013c). Several interrelated factors account for this wage differential and the resultant high turnover:
the unskilled nature of most tourism jobs, with relatively few opportunities for upward mobility and few training opportunities
the tendency of employers to treat jobs requiring higher levels of skill (as in the emotional labour component of customer service) as unskilled
the weakness or absence of unionisation and collective bargaining arrangements
the tendency of many employers to flout minimum wage regulations, sometimes through the employment of new or undocumented migrants (see Managing tourism: A magnet for migrants?)
where there are few or no alternatives to tourism, local wages may be depressed because of the lack of competition for workers.
Because of the seasonal and cyclical nature of tourism, the sector is also characterised by a high incidence of seasonal, part-time and casual employment, thereby further contributing to the discrepancy between the actual number of people employed and the actual hours and wages achieved. Tourism in Australia and elsewhere has additionally been criticised, like certain other sectors, for fostering a ghetto-like environment that provides women with lower pay (ABS 2006b, Thrane 2008), poorer working conditions, less career mobility, less access to training programs and less effective trade union support. Ironically, the advocacy platform has interpreted many of these alleged shortcomings as advantages, in that low wages mean that more workers can be hired, and unskilled workers can find employment opportunities more readily. Furthermore, this platform contends that part-time and seasonal jobs may be more desirable among certain segments in the workforce, such as single mothers and international students (Barron 2007).244
managing tourism
 A MAGNET FOR MIGRANTS?

Economic analyses of tourism usually consider employment benefits in relation to existing resident populations, but less often they examine how tourism can alter those same populations and anticipated employment benefits through changed migration patterns. In the current era of globalisation, national boundaries are eroding as barriers to human movement, and tourism is attracting not just those seeking natural and cultural attractions, but also those looking for employment opportunities that local residents often shun. Most Chinese inbound tourism in Europe, for example, appears to be mediated by travel agencies and inbound tour operators — many of which are in the informal sector — that employ migrant Chinese workers (Leung 2009). This may say something about the reputation of the Chinese for travelling in a tourist bubble; that is, in a sheltered environment mediated by other Chinese. An irony is that many of these participants arrive on tourist-type visas that may or may not sanction employment in the destination country (Leung 2009). More commonly, migrant involvement in tourism is not so obviously linked to culturally similar markets. In the United Kingdom, a large portion of the hospitality workforce is foreign born, with people from Poland being especially prominent. Local residents often perceive the Poles as an economic and cultural threat who take local jobs, depress wages and deliberately remain apart in their ethnic enclaves. In the workplace, there are fears that substandard English-language skills could also lead to service failure, while dissonant destination images may result when a Chinese or American tourist meets a ‘British’ host who happens to be Polish. It is counter-argued that Poles occupy jobs that local residents avoid, and that they are innovative and hardworking, sometimes establishing businesses that go on to employ local residents. Tourism also provides unique opportunities for cultural integration because of the exposure of frontline staff to British and other non-Polish tourists (Janta et al. 2011).
CHAPTER REVIEW
This chapter has considered the potential economic costs and benefits of tourism for a destination. The main argument for tourism, as expounded by supporters of the advocacy platform, is the generation of earnings through direct tourist expenditures and related taxation. Another important economic benefit is the generation of indirect local revenue through the multiplier effect, and the concurrent diversification and integration of the local economy through the stimulation of backward linkages with agriculture and other sectors within the destination. Tourism is also an effective stimulant for direct and indirect employment, and a vehicle for regional development in economically marginal locations. This can occur as a result of spontaneous processes (such as the development of most farmstays or nature-based operations), or as the consequence of a deliberate growth pole strategy, as with the Mexican resort of Cancún. When considering the economic benefits of tourism, it is generally assumed (although not necessarily correctly) that a strong formal sector is the best engine for achieving these benefits, rather than the unregulated informal sector.
The cautionary platform, in contrast to the advocacy platform, holds that the positive economic impacts of tourism may be exaggerated by its supporters. First, the direct financial costs involved in maintaining an effective administrative bureaucracy, marketing activities and providing incentives are substantial. Second, revenue leakages, which result from a high import content, profit repatriation and other processes, can drastically reduce the multiplier effect. Tourism, moreover, engenders economic uncertainty because of its vulnerability to fluctuations in intake arising from seasonal variations, the effects of fashion and social or political unrest, in both the destination and source regions. Tourism also has the capacity to foster a competitive rather than a complementary relationship with agriculture and other local sectors, and a tendency to create part-time, low-wage and low-skill employment — especially for females. How much a destination derives net economic benefits or costs from tourism depends on the circumstances that pertain to each particular place. In general, destinations with large and diverse economies are most likely to benefit from tourism, since these can generate the backward linkages that give rise to a strong multiplier effect. In contrast, small destination economies, such as those found in the SISODs, are most likely to incur the economic costs described in this chapter. Essentially, and ironically, the destinations that are most desperate to obtain economic benefits from tourism and are most dependent on it are those that are also most likely to experience its negative economic impacts.
SUMMARY OF KEY TERMS
Backward linkages sectors of an economy that provide goods and services for the tourism sector; includes agriculture, fisheries and construction
Demonstration effect the tendency of a population, or some portion thereof, to imitate the consumption patterns and other behaviours of another group; this can result in increased importation of goods and services to meet these changing consumer demands
Direct financial costs direct expenses that are necessarily incurred to sustain the tourism sector; within the public sector, typical areas of outlay include administration and bureaucracy, marketing, research and direct incentives
Direct (or primary) impact expenditure or direct revenue obtained from tourists246
Direct revenue money that is obtained directly from tourists through advance or immediate expenditures in the destination and associated taxes
Enclave resort a self-contained resort complex; enclave resorts are associated with high revenue leakages because of their propensity to encourage internal spending on imported goods
Enclave tourism a mode of tourism characterised by external domination and weak linkages with the local economy
Formal sector the portion of a society’s economy that is subject to official systems of regulation and remuneration; formal sector businesses provide regular wage or salaried employment, and are subject to taxation by various levels of government; the formal sector dominates Phase Four societies
Growth pole strategy a strategy that uses tourism to stimulate economic development in a suitably located area (or growth pole), so that this growth will eventually become self-sustaining
Indirect financial costs costs that do not entail a direct outlay of funds, but indicate lost revenue
Indirect impacts revenues that are used by tourism businesses and their suppliers to purchase goods and services
Indirect revenues revenue obtained through the circulation of direct tourist expenditures within a destination
Induced impacts revenue circulation that results from the use of wages in tourism businesses and their suppliers to purchase goods and services
Informal sector the portion of a society’s economy that is external to the official systems of regulation and remuneration; dominant in many parts of the less developed world, informal sector businesses are characterised by small size, the absence of regular working hours or wage payments, family ownership and a lack of any regulating quality control
International tourism receipts all consumption expenditure, or payments for goods and services, made by international tourists (stayovers and excursionists) to use themselves or to give away
Multiplier effect a measure of the subsequent income generated in a destination’s economy by direct tourist expenditure
Opportunity cost the idea that the use of a resource for some activity (e.g. tourism) precludes its use for some other activity that may yield a better financial return (e.g. agriculture)
Propulsive activity an economic activity that is suited to a particular area and thus facilitates the growth pole strategy; in the case of Cancún and other subtropical or tropical coastal regions 3S tourism is an effective propulsive activity
RFID (Radio Frequency IDentification) miniature devices that allow tracking of a good or person; tourism applications include tracking of travellers and their expenditures
Revenue leakages a major category of indirect financial costs, entailing erosion in the multiplier effect due to the importation of goods and services that are required by tourists or the tourist industry, through factor payments abroad such as repatriated profits, and through imports required for government expenditure on tourism-related infrastructure such as airports, road and port equipment
Secondary (or ‘flow-on’) impacts the indirect and induced stages of money circulation in the multiplier effect that follows the actual tourist expenditure247
Slow tourism small-scale tourism that focuses on deep interaction with the authentic local culture of the destination; proposed as a more appropriate alternative to the fast-paced, homogenised, pleasure-seeking character of mass tourism
Tourist bubble the alleged tendency of some package tourists to travel in a way that keeps them sheltered from the destination and close to the culturally familiar elements of their home culture; it is a concept that is associated with high leakage effects
QUESTIONS
As per table 8.1, which countries respectively gained or lost share in international tourism receipts between 2007 and 2010?
What patterns are evident in this analysis?
What factors might account for these patterns?
Under what circumstances is a destination likely to have (i) a low income multiplier effect and (ii) a high income multiplier effect?
How can destinations with a low income multiplier effect increase this statistic?
What factors would limit the implementation of a growth pole strategy in Australia and New Zealand?
How else could tourism development be induced in peripheral areas of Australia and New Zealand?
Are governments in emerging economies such as Thailand and Indonesia justified in favouring the formal tourism sector over its informal sector counterpart? Explain your reasons.
In countries such as Australia and New Zealand, which kinds of destination should seriously consider slow tourism as a strategic tourism priority? Why?
What seasonal patterns are evident for the three target segments of Australian inbound tourism depicted in figure 8.5?
What factors might account for the differences within and between segments?
What is the typical employment structure of the tourism industry?
What are the positive and negative impacts of this structure?
How could this structure be made more positive from the perspective of the host community?
To what extent should universities accommodate tourism and hospitality students who are working part-time during their study semesters?
How does the tourist bubble effect contribute to a low multiplier effect?
How practical is it to modify the tourist bubble so that a higher multiplier effect results?
EXERCISES
On a base map of the world, colour in red all countries and dependencies in which tourism accounts for at least 5 per cent of GDP and colour in blue all countries and dependencies where tourism accounts for less than 1 per cent of GDP.
Write a 500-word report in which you describe and account for the spatial patterns that emerge.
Write a 1000-word report in which you compare the economic benefits and costs to a remote rural destination of, respectively, a typical inbound package holiday tourist and a typical domestic VFR tourist.
248
FURTHER READING
Cooper, C., Fletcher, J., Wanhill, S., Gilbert, D. & Fyall, A. 2008. Tourism Principles and Practice. Fourth Edition. London: Prentice Hall. The economic dimension of tourism is thoroughly covered in this general tourism textbook.
Dwyer, L., Forsyth, P. & Dwyer, W. 2010. Tourism Economics and Policy. Bristol: Channel View. The topics covered in this comprehensive text include demand forecasting, supply and pricing, tourism satellite accounts, cost–benefit analysis, taxation and destination competitiveness.
Gibson, C. & Connell, J. 2011. Festival Places: Revitalising Rural Australia. Bristol: Channel View. The role of festivals in contributing to the economic and social development of rural Australia is considered from a case study perspective.
Tribe, J. 2011. The Economics of Recreation, Leisure and Tourism. Fourth Edition. London: Routledge. Basic economic concepts and theories, as they apply to tourism and related activities, are discussed in this textbook using non-specialist language.
Wanhill, S. 2005. ‘Role of Government Incentives’. In Theobald, W. (Ed.) Global Tourism. Third Edition. Sydney: Elsevier, pp. 367–90. A comprehensive outline of government incentives to the tourism industry is provided in this chapter, which includes a short discussion of market failure.
case study
 A NATURAL ALTERNATIVE FOR TASMANIA?
The decline of traditional primary and secondary sector industries in Tasmania brings into sharp focus the potential role of tourism as the future mainstay of the state’s economy. In 2010 alone, major closures in the manufacturing sector included a shipbuilder (116 jobs lost), paper mills (over 400 jobs lost, leaving only one mill remaining), a vegetable processing plant (leading to a loss of 200 jobs) and a carpet manufacturer (accounting for 150 job losses) (Parliament of Tasmania 2011). Tasmania is already more dependent than any other Australian state on tourism, which in the year ending September 2010 directly accounted for just under 5 per cent of gross state product, and 8.5 per cent if indirect effects are included. This translated into 6.1 per cent and 11 per cent of all state employment respectively, as well as revenues of $1.53 billion from approximately one million visitors (Parliament of Tasmania 2011).
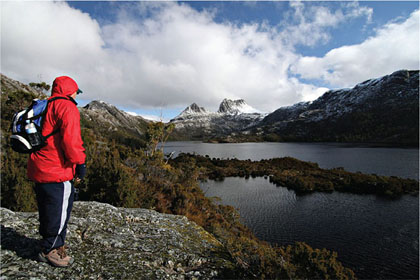
Characteristics of Tasmania that have helped to accelerate the demise of the traditional economy may help in turn to shape its status as a competitive nature-based tourist destination. These include an enormous area of temperate rainforest wilderness, most of which is designated as a World Heritage Area that covers 1.4 million hectares, or one-fifth of the state. Altogether, about 40 per cent of Tasmania is publicly protected land in which resource extraction is strictly 249regulated or prohibited altogether. This level of land protection is amongst the highest in the world. Iconic attractions that are very appealing to the ecotourist, adventure tourist and backpacker include Cradle Mountain, the Freycinet Peninsula and Cataract Gorge. The isolation imposed by being an island is another contributing factor to the demise of manufacturing and has also been cited as an impediment to tourism development (Parliament of Tasmania 2011). However, if appropriately marketed, insularity can also be presented as a competitive advantage that confers authenticity, uniqueness, pristine air and water, exoticness, and a sense of getting away from the rat-race.
A significant pre-1830 European settlement heritage and abundant high-quality fresh food augment the nature-based core of the Tasmanian tourism product and enhance the potential for high-quality and high-yield visitor experiences that are differentiated from other Australian states. Yet, visitation levels have been stagnant in recent years. In addition to the issue of accessibility, one major external impediment has been the persistently high Australian dollar, which has attracted fewer international visitors to Australia while diverting many domestic tourists to relatively cheap international destinations such as Bali and Thailand. Internal problems include a low level of internet use for marketing and booking, variable quality of service provision, and inconsistent and restricted operating hours. All three of these problems are associated with the prevalence of small businesses throughout the state. Of the 2000 private enterprises that comprise the state tourism industry, 85 per cent employ five or fewer people, and more than 70 per cent have an annual turnover of less than $250 000. High industry wages and payroll taxes discourage businesses from hiring more permanent employees (Parliament of Tasmania 2011).
There is particular interest in attracting international tourists, who accounted for about 14 per cent of all visitors in the year ending December 2011 (around 150 000 per year) but 18 per cent of expenditures ($254 million). Notably, expenditures per visitor-night are well below domestic levels ($89 versus $205), but the longer stay translates into marginally larger total expenditures ($1696 versus $1649) (Tourism Tasmania 2012). Europe and New Zealand are both regarded as high-yield markets that would be attracted by the nature-based tourism product of Tasmania, but there is also interest in China and other East-Asian countries because of their remarkable growth and potential (Parliament of Tasmania 2011). The unique attributes of Tasmania appear to favour a product development strategy based on the principles of slow tourism and its emphasis on a long stay, and authentic and unique experiences focused on immersion into the local natural environment and lifestyle. In this context, the pattern of small business ownership could be an asset that more closely connects visitors to local residents and the Tasmanian way of life.
The transition of Tasmania from the primary/secondary mix of forestry and manufacturing to the emphasis on tourism and other tertiary activities, however, has not been conflict-free or a foregone conclusion. Since the mid-1970s, major battles have been fought in Tasmania and elsewhere in Australia between industrial interests wanting access to forests for woodchip production and environmentalists wanting to preserve old-growth and other native forests for their ecological and aesthetic value. It is perhaps too simplistic to characterise this as a fundamental conflict between anthropocentric and biocentric ways of thinking, since environmentalists also consider the recreational and other benefits of natural habitat for humans, while industry appreciates the need to consider the integrity 250of the environment in the interests of their own long-term survival. Moreover, tourism and the forestry industry have a history of mutual reinforcement, with the latter earning substantial revenue from operating commercial attractions such as Air Walk, a treetop walkway. In turn, recreationalists rely on roads and bridges maintained by the industry for access to trekking paths and other recreational settings.
A mutually acceptable approach to the issue of resource access is evident in the Tasmanian Forests Intergovernmental Agreement signed in late 2012 which emphasised the need to develop a strong and sustainable forestry industry while protecting native forests. The agreement called for another 500 000 hectares of native forest (about one-half of the state’s old-growth forest) to be permanently protected and for the industry to move production to tree plantations. Immediate financial and other relief was provided for forestry workers and their families to help with their readjustment, while $120 million of mainly federal money would be allocated over 15 years to fund appropriate regional development projects that improve productivity and income-earning capacity in the state economy (Australian Government 2011). Through such spatial differentiation, it is hoped that Tasmania can sustain both a dominant nature-based tourism sector as well as a robust forestry sector.
QUESTIONS
Write a 1000-word report in which you describe:
the economic advantages of targeting New Zealand as a major potential inbound market
the economic disadvantages of such an approach.
Prepare a two-week Tasmanian itinerary, designed for an adventurous two-income German couple in their mid-30s, that will:
be highly satisfying to these visitors in terms of the experiences and services provided
maximise the state multiplier effect for Tasmania.
REFERENCES
ABS 2006. Australian and New Zealand Standard Industrial Classification (ANZSIC), 1993. Catalogue No. 1292.0. www.abs.gov.au. Canberra: Australian Bureau of Statistics.
ABS 2011. Tourism Satellite Account 2010–11. Catalogue No. 5249.0. www.abs.gov.au. Canberra: Australian Bureau of Statistics.
ABS 2013a. Australian National Accounts: Tourism Satellite Account, 2011–12. Catalogue No. 5249.0. www.abs.gov.au. Canberra: Australian Bureau of Statistics.
ABS 2013b. Overseas Arrivals and Departures. Catalogue No. 3401.0. www.abs.gov.au. Canberra: Australian Bureau of Statistics.
ABS 2013c. Employee Earnings and Hours, May 2012. Catalogue No. 6306.0. www.abs.gov.au. Canberra: Australian Bureau of Statistics.
Anderson, W. 2011. ‘Enclave Tourism and its Socio-economic Impact in Emerging Destinations’. Anatolia 22: 361–77.
Australian Government 2011. Tasmanian Forests Intergovernmental Agreement between the Commonwealth of Australia and the State of Tasmania. www.environment.gov.au.
Backer, E. 2012. ‘VFR Travel: It is Underestimated’. Tourism Management 33: 74–9.251
Barron, P. 2007. ‘Hospitality and Tourism Students’ Part-time Employment: Patterns, Benefits and Recognition’. Journal of Hospitality, Leisure, Sport & Tourism Education 6 (4): 40–54.
Conway, D. & Timms, B. 2010. ‘Re-branding Alternative Tourism in the Caribbean: The Case for ‘Slow Tourism’’. Tourism and Hospitality Research 10: 329–44.
Cooper, C., Fletcher, J., Fyall, A., Gilbert, D. & Wanhill, S. 2008. Tourism Principles and Practice. Fourth Edition. London: Prentice Hall.
Creedy, S. 2012. ‘Review of Passenger Movement Charge’. The Australian. 19 October. www.theaustralian.com.au.
Dahles, H. (Ed.) 2001. Tourism, Heritage and National Culture in Java: Dilemmas of a Local Community. Richmond, UK: Curzon Press.
Demetriou, D. 2012. ‘Japan Suffers Biggest Decline in Tourism Since 1950’. The Telegraph, January 19. www.telegraph.co.uk.
Discover Tasmania 2013. ‘Tasmania’s World Heritage Area’. www.discovertasmania.com.au.
Dodds, R. 2012. ‘Questioning Slow as Sustainable’. Tourism Recreation Research 37: 81–83.
DRET 2012. ‘Portfolio Budget Statements 2012–13’. Department of Resources, Energy and Tourism. www.ret.gov.au.
Heitmann, S., Robinson, P. & Povey, G. 2011. ‘Slow Food, Slow Cities and Slow Tourism’. In Robinson, P., Heitmann, S. & Dieke, P. (Eds). Research Themes for Tourism. Wallingford, UK: CABI, pp. 114–27.
Hicks, C., McClanahan, T., Cinner, J. & Hills, J. 2009. ‘Trade-offs in Values Assigned to Ecological Goods and Services Associated with Different Coral Reef Management Strategies’. Ecology and Society 14, Article 10.
Huybers, T. 2007. Tourism in Developing Countries. Cheltenham: Edward Elgar.
ILO 2005. ‘After the Tsunami: In Thailand, the Tourist Industry Fights Back’. International Labour Organization. www.ilo.org.
Janta, H., Brown, L., Lugosi, P. & Ladkin, A. 2011. ‘Migrant Relationships and Tourism Employment’. Annals of Tourism Research 38: 1322–43.
Leung, M. 2009. ‘Power of Borders and Spatiality of Transnationalism: A Study of Chinese-
operated Tourism Businesses in Europe’. Tijdschrift voor Economische en Sociale Geografie 100: 646–61.
Mbaiwa, J. 2005. ‘Enclave Tourism and its Socio-economic Impacts in the Okavango Delta, Botswana’. Tourism Management 26: 157–72.
Ollenburg, C. 2008. ‘Regional Signatures and Trends in the Farm Tourism Sector’. Tourism Recreation Research 33: 13–23.
Öztayşi, B., Baysan, S. & Akpinar, F. 2009. ‘Radio Frequency Identification (RFID) in Hospitality’. Technovation 29: 618–24.
Parliament of Tasmania 2011. ‘Tourism in Tasmania’. www.parliament.tas.gov.au.
SATC 2012. ‘State Tourism Profile: June 2010–2012’. South Australian Tourism Commission. www.tourism.sa.gov.au.
South Australia. 2012. ‘South Australia: A Brilliant Blend’. www.southaustralia.com.
Thrane, C. 2008. ‘Earnings Differentiation in the Tourism Industry: Gender, Human Capital and Socio-demographic Effects’. Tourism Management 29: 514–24.
Tourism Australia 2012. ‘Tourism Australia 2011–2012 Annual Report’. www.tourism.australia.com.
Tourism Queensland 2012. ‘Annual Report 2011–2012’. www.tq.com.au.
Tourism Tasmania 2012. ‘Tasmania Tourism Snapshot: Year Ending December 2011’. www.tourismtasmania.com.au.252
TRA 2012b. ‘International Visitors in Australia, September 2012: Quarterly Results of the International Visitor Survey’. Tourism Research Australia.
TTF 2008a. National Tourism Infrastructure Priorities. Sydney: Tourism & Transport Forum.
TTF 2008b. National Tourism Employment Atlas ’08. Sydney: Tourism & Transport Forum.
UNWTO 2008. ‘UNWTO Tourism Highlights: 2008 Edition’. World Tourism Organization. http://mkt.unwto.org.
UNWTO 2011. ‘UNWTO Tourism Highlights: 2011 Edition’. World Tourism Organization. http://mkt.unwto.org.
UNWTO 2013. ‘Understanding Tourism: Basic Glossary’. World Tourism Organization. http://media.unwto.org.
Wanhill, S. 2005. ‘Role of Government Incentives’ In Theobald, W. (Ed.) Global Tourism. Third Edition. Sydney: Elsevier, pp. 367–90.
WTTC 2012. Travel & Tourism Economic Impact 2012. World Travel and Tourism Council. www.wttc.org
..................Content has been hidden....................
You can't read the all page of ebook, please click here login for view all page.