CHAPTER 4
Adaptive Markets and Trend Following
Financial theorists and practitioners both agree that the classic efficient markets hypothesis (EMH) may often fall short of explaining certain aspects of dynamic trading strategies. The core issue with efficient market theory comes from the fact that it presents a somewhat static view of the behavior of markets. On the other hand, behavioral finance suggests that we systematically deviate from what most economists label rational expectations. In reality, markets are adaptive and market conditions continue to evolve over time as a function of the market environment and the composition and level of competition present in financial markets. The adaptive markets hypothesis (AMH) is a framework for explaining how markets behave using principles from evolutionary biology. In an adaptive markets framework, it is precisely the market players that are best able to adapt, which by the forces of natural selection are able to compete and survive to continue competing in highly competitive and dynamic financial markets.
adaptive markets hypothesis (AMH) an approach to understanding how markets evolve, how opportunities occur, and how market players succeed or fail based on principles of evolutionary biology.
In this chapter, as proposed by Andrew Lo (2004, 2005, 2006, 2012), the AMH is introduced to provide more detail into how to understand dynamic trading strategies. Using this framework, it is much easier to understand dynamic strategies, such as trend following, and the role of adaptation in success and survival over the long run. A discussion of the evolutionary origin of human behavior, when faced with sequential choices over time, leads to the definition of speculative risk premiums and speculative opportunities in financial markets. With an adaptive markets view, as opposed to a traditional efficient markets view, the competitive advantage and adaptive properties of trend following explain why the strategy works well during periods of market divergence and in particular during financial crisis. Financial crisis represents a time when market divergence, potential imbalances between supply and demand, and general price dislocation are often at their greatest. Put in traditional efficient market terms, these are often transitory moments where market efficiency may be put to the test.
speculative risk premium a premium that is earned by speculative strategies during moments when supply and demand takes time to correct prices.
To put crisis alpha and speculative risk premiums into an empirical perspective, the performance of trend following can be decomposed into three components: the risk-free rate, a speculative risk premium, and crisis alpha. The risk-free rate is the positive carry of collateral. The speculative risk premium is driven by skill at capturing premiums, such as hedging premiums, outside of crisis. Crisis alpha is driven by trend following’s ability to adapt and remain competitive during periods of market stress. Using common industry benchmarks, crisis alpha has provided a substantial portion of return for CTAs during the period of 2000 to 2013. Speculative risk premiums outside of crisis at the index level have been relatively low during this period. To provide further insight and perspective on the recent performance of trend following, the decomposition is also applied to 200 years of data from Chapter 1’s multicentennial analysis. The longer term perspective demonstrates that crisis alpha has always driven some of but not always most of trend following performance especially during recent times, from 2000 to 2013.
■ The Adaptive Market Hypothesis
The classic efficient markets hypothesis (EMH) is a framework for understanding how market prices behave. In its strongest form, it declares that all relevant information is incorporated into prices. Even in its weakest form, the EMH implies that all historical price information cannot be used to make profitable investments. Given that trend following is a method for systematically investing across asset classes following trends in historical prices, it is in direct conflict with even the weakest form of EMH. It comes, therefore, as no surprise that the strategy has often been somewhat ignored by academics and viewed with skepticism by most academically trained practitioners. In fact, until only recently, the strategy was often classified in the ranks of what some call “Voodoo” finance strategies such as technical analysis. Yet, recently, as more and more academics and practitioners have begun to discuss limitations of the EMH view of markets, trend following has started to be discussed in a more positive light.
The main problem with the EMH is that it is not dynamic, and given this framework, strategies such as trend following may seem counterintuitive. In 2004, Andrew Lo from MIT suggested an alternative to efficient market theory, which allows for a more dynamic and adaptive view of market behavior. The AMH is an approach for understanding how markets evolve, how opportunities occur, and how market players succeed or fail based on principles of evolutionary biology.1 This theory was put forth by Lo in 2004 and it attempts to reconcile the key issues related to the traditional EMH.2 According to the AMH, concepts central in evolutionary biology govern market dynamics via the forces of competition, mutation, reproduction, and natural selection.
Prices reflect as much information as dictated by the combination of environmental conditions and the number and nature of “species” in the economy, or … ecology. Species are defined as distinct groups of market participants: ex: pension funds, retail investors, hedge funds. (Lo 2004)
According to the AMH, profit opportunities exist when more resources are present and competition is lower. As competition increases, by natural selection, the players, who have competitive advantage over others, survive and adapt. Those who are not able to adapt disappear, reducing competition, starting the evolutionary cycle all over again. The waxing and waning of the hedge fund styles is an excellent example of this phenomenon at work. Figure 4.1 demonstrates the cycle of natural selection where the forces of competition and adaptation determine who succeeds and fails.
FIGURE 4.1 A schematic of natural selection with opportunities and competition.

When markets are viewed as ecologies, it is easy to see that both market efficiency and behavioral finance are justifiable theories. First, when competition is high, prices will be very efficient. When competition is low, prices may be less efficient, also consistent with EMH. Second, according to the AMH, markets are seen as ecologies made up of species. Just as in evolutionary biology, financial species survive based on the principles of natural selection. Neuroscientists, psychologists, and behavioral experts agree that humans adapt heuristics or simple rules to make decisions. If humans use heuristics to make decisions and they adapt them to survive, behavioral biases are simply a natural consequence of human heuristic-based decision making. For example, if one turns to fear and greed, they are two primal human emotions that are known to drive behavioral bias.3 Despite some of the mishaps of our behavioral based heuristics, it is precisely these heuristics that have helped humans to survive over the ages.4 There is a growing body of literature in the field of neuroscience, neuroeconomics (or even neurofinance), and psychology that supports the fact that heuristics (not utility optimization) are at the core of human decision making. Put simply, humans use heuristics that they adapt over time with experience. It is no surprise that from time to time, these simple heuristics can cause us to make financial decisions inconsistent with what might be considered rational decision making.5 A closer look at what factors affect a heuristic’s ability to adapt to changing financial environments will provide more insights into why and when heuristic approaches such as trend following may work. The next section dives deeper into factors that affect adaptation.
Factors That Affect Adaptation
For trading strategies, in particular dynamic trading strategies, the key to survival in highly competitive financial markets is adaptation. Adaptation is an evolutionary process whereby a species, or group of market participants, are able to adapt to changes in the market environment. The most extreme example of a drastic change in market environment occurs during a financial crisis. Given the industry-wide long bias toward equities, equity market crisis is a scenario when the most market participants are impacted and when market efficiency is often put to the test.
adaptation an evolutionary process whereby a species, or group of market participants, is able to adapt to changes in the market environment.
In the complex network of markets and market players, which make up the modern financial environment, there are many factors that affect a market player’s ability to adapt to changes in the market environment. These factors can be divided into three categories: institutional restrictions, market functionality, and behavioral biases. These three categories can also be subdivided into several specific factors that directly affect adaptation. Table 4.1 lists each of these factors and subfactors with examples, and the following sections provide some background for how each one of these factors affects adaptation.
TABLE 4.1 Specific factors that affect adaptation and illustrative examples.
| Specific Factors That Affect Adaptation | Examples |
| Institutional restrictions | Systemized drawdown limits |
| Systemized risk limits (e.g., Basel III) | |
| Allocation constraints | |
| Asset class and market restrictions | |
| Margin and collateral constraints | |
| Market functionality | Liquidity |
| Counterparty risk | |
| Asymmetry between long and short | |
| Behavioral biases | Long equity bias |
| Loss aversion | |
| Anchoring | |
| Herding |
Institutional Restrictions Given the nature and construction of the financial industry, all market players are subject to varying levels of institutionalized regulation and frictions. These constraints include systematized drawdown limits or policies, systemized risk limits (including VaR policies such as those in Basel II and soon Basel III and Solvency II), allocation constraints (such as long only policies for mutual funds), asset class and market restrictions (such as restrictions on commodities or derivative contracts), and margin or collateral constraints. Drawdown limits refer to policies based on cutting losses with stop-limits to get out of positions following certain predetermined drawdowns. Systemized risk limits refer to policies that cut positions when risk limits are hit. These limits are defined by VaR and other volatility based measures. Allocation constraints are specific mandated constraints, which restrict allocation. No short sales is the most classic example of this type of constraint, which is valid for most mutual funds. Asset specific or market specific constraints refer to mandates that restrict trading in certain types of contracts such as commodities for pension funds or derivative markets for some mutual funds. Margin and collateral constraints also vary based on both the type of player, type of market, and type of contract.
The level of strictness of these factors varies significantly among market players from the tightest regulation in the case of pension funds and retail based investors to the loosest regulation in the case of hedge funds. Even for the case of hedge funds, drawdown, risk limits, and margin limits still apply although much less stringent than for other retail and institutional investors.
Market Functionality All markets are not created equal. Market functionality varies substantially across all financial markets based in most cases by their design, their construction, the players that trade in them, and the specific contracts that are traded there. The key factors related to market functionality that affect a market player’s ability to adapt are liquidity, counterparty risk, and asymmetry between long and short positions. Liquidity is a factor that is affected by the level of standardization of contracts, the level of transparency in contracts, the role of counterparty risk in that market, the diversity of market participants trading in that market, and the market depth. Although counterparty risk also affects liquidity, it is also important enough to be considered a factor in its own right. The level of counterparty risk varies substantially from market to market. Over-the-counter (OTC) contracts are an example of contracts that have an elevated dependence on counterparty risk. Chapter 2 provided a discussion of forward and futures contracts. When compared with bilateral forward contracts, futures contracts, by construction and due to the clearinghouse structure, have much lower counterparty risk. In general based on their design, exchange-traded contracts are exposed to less counterparty risk. Asymmetry between long and short positions is also something that varies substantially from market to market and, for institutional reasons, from one market participant to another. Using short sales as an example, equity markets short sales require 50 percent margin and are restricted to only certain subclasses of investors; private equity short sales are not feasible, yet in futures markets short sales have the same restrictions as long positions.
Behavioral Biases: Financial Darwinism? Behavioral finance experts have documented a plethora of behavioral biases, which cause investors to react in ways that might be at odds with rational economic decision making. It is documented that, for various periods of time, investors or even classes of investors can behave in ways linked to human behavior and emotion.6 For this exact reason, behavioral biases can also be a driving factor, which can hinder a market player’s ability to adapt. Several key behavioral biases include “home” bias to a particular financial market (usually equity markets), loss aversion, overreaction, and herding behavior. There are many other behavioral biases that have been documented, but these biases are the most relevant for adaptation during a market crisis. Just as investors have a home bias for equities in their nearest and most familiar market, market players also have a home bias in the types of markets they trade. In most cases, this bias is toward equity and fixed income markets (pension funds), or toward fixed income markets (fixed income arbitrage hedge funds) or futures markets (CTAs). Home bias is important because most players will have difficulty changing their allocation to other markets when opportunities dry up in markets they are familiar with or accustomed to. Loss aversion and prospect theory explain that investors value opportunities in relative terms and that they asymmetrically are more disappointed by losses than they are pleased with gains. Loss aversion implies that investors are more likely to have stronger behavioral reactions in the case of large losses.7 Herding is characterized when individuals act together in collective irrationality. Herding has often been blamed for market bubbles and crashes. In some contexts, herding may be rationally motivated, but in certain scenarios the tendency to herd can have devastating consequences.
The previous subsections provide a summary of factors that affect adaptation for all market participants. It is clear that each market participant will be affected by these factors in various levels of severity. Whether these factors are important will depend on what happens in the market environment. During an equity crisis event, several of these factors may be important for explaining why particular market participants survive, adapt, and outperform other market players. Using the concept of adaptation and an adaptive markets perspective, the next step is to look more closely at why a strategy such as trend following may be able to find opportunity during crisis periods.
Crisis Alpha Opportunities
Most investment strategies are susceptible to suffering devastating losses during an equity market crisis. Given this, for almost any investor, the key to finding true diversification is in finding an investment that is able to deliver performance during these turbulent periods. The painful losses of the credit crisis reinforced to investors the importance of understanding why a particular investment strategy makes sense. For any new or current investor in trend following, it is well known that these strategies tend to perform well when equity markets take losses, making them an excellent candidate for diversifying a portfolio. By taking a closer look into what really happens during equity market crisis events (often called tail risk events), this section can help to explain why trend following strategies can deliver crisis alpha opportunities for their investors. Crisis alpha opportunities are profits that are gained by exploiting the persistent trends that occur across markets during times of crisis.
crisis alpha opportunities profits that are gained by exploiting the persistent trends that occur across markets during times of crisis.
For an investment strategy to be profitable, there must be an underlying fundamental reason for the existence of a profit opportunity that the strategy can exploit. Given that trend followers trade exclusively in the most liquid, efficient, and credit protected markets, their profitability must rely on those characteristics in order to obtain a competitive edge.8 Trend following strategies will not profit from credit exposures or illiquidity, which are commonly cited risks and opportunities for most hedge fund strategies.9 In fact, since trend following strategies rely on the most efficient type of trading vehicles, they must profit from persistent trends in markets, which, given that markets are efficient, should not, under ordinary circumstances, exist. The next logical step is to examine unordinary circumstances where it may be feasible for market efficiency to break down and persistent trends to occur even in the most efficient of markets. Given that the vast majority of investors are systematically long biased to equity markets and that we may be susceptible to behavioral biases especially, or perhaps only, when we lose money, it is clear that equity market crisis is the market scenario where predictable behavior and, as a consequence, persistent trends will be the most likely. Later in Chapter 5, market divergence is discussed in more detail. Equity market crisis are precisely the moments when market divergence is at extreme levels.
By examining what happens during equity market crisis, trend following strategies, based purely on the design and construction of the strategy, will enable it to deliver crisis alpha.
crisis alpha performance during periods of market crisis.
Equity Market Crisis and Crisis Alpha
For both behavioral and institutional reasons, market crisis represents a time when market participants become synchronized in their actions creating trends in markets. It is only the select (few) most adaptable market players who are able to take advantage of these “crisis alpha” opportunities.
When equity markets go down, the vast majority of investors are long biased to equity, including hedge funds, and they realize losses. Given loss aversion, losses represent periods when investors are more likely to be governed by behavioral bias and emotional based decision making. When this is coupled with the widespread use of institutionalized drawdown, leverage, and risk limits that are all triggered by losses, increased volatility, and increased correlation, given an investment community that is fundamentally long biased, equity losses will force or drive large groups of investors into action. When large groups of investors are forced into action, liquidity disappears, credit issues come to the forefront, fundamental valuation becomes less relevant, and persistent trends occur across all markets while investors fervently attempt to change their positions desperately seeking liquidity. Figure 4.2 displays a schematic of what happens during an equity market crisis.
FIGURE 4.2 A schematic of the equity market crisis.

Systematic trend following strategies trade across a wide range of asset classes primarily in futures; they do not exhibit a long bias to equity. Futures markets are extremely liquid and credit solvent and they remain more liquid and credit solvent than other markets during times of crisis. Although trend followers are also subject to institutionalized drawdown, risk and loss limits, trading primarily in futures guarantees they will be less affected by the reduced liquidity and credit solvency issues that accompany market crisis events. Given their lack of long bias to equities and systematic trading style, they will also be less susceptible to the behavioral effects that also accompany market crisis. Putting all of this together, trend following strategies are adaptable, liquid, systematic, and void of long equity bias making them less susceptible to the trap that almost all investors fall into during an equity crisis. Following the onset of a market crisis, a trend following strategy will be one of the select (few) strategies that are able to adapt to take advantage of the persistent trends across the wide range of asset classes they trade in. This feature allows the strategy to be one of the few to deliver crisis alpha. It is important to also note that trend followers are not timing the onset of an equity markets crisis. They profit from a wide range of opportunities across asset classes following the onset of a market crisis. This includes currencies, bonds, short rates, soft commodities, energies, metals, and equity indices. The characteristics of systematic trend following and their implications during equity market crisis are summarized below in Table 4.2.
TABLE 4.2 The characteristics of trend following and their implications during equity crisis periods.
| Characteristics of Trend Following | Implications during Equity Crisis Periods |
| Highly liquid, adaptable strategies based exclusively in futures with minimal credit exposure | Less susceptible to the illiquidity and credit traps that most investors experience during equity market crisis |
| Systematic trading strategies, lack of long equity bias | Less susceptible to behavioral biases and emotional based decision making triggered by experiencing losses |
| Active across a wide range of asset classes in futures | Poised to profit from trends across a wide range of asset classes |
■ A Framework for Speculative Risk Taking
This section returns to the adaptive markets hypothesis (AMH) and discusses a framework for understanding a general class of speculative risk-taking strategies. Once this framework is explained, it can be used to examine the specific case of trend following and its signature crisis alpha. The AMH provides a general framework for understanding how opportunities occur and markets evolve. According to Lo (2012) some of the important practical implications of an adaptive view on markets include:

The Origin of Behavior
Before moving forward, a detour into the world of evolutionary finance, decision making theory, and neurofinance seems necessary. Unlike the classic EMH, the AMH leaves room for some human considerations. The world of behavioral finance has long been viewed with disdain by neoclassical economists. In recent work by Brennan and Lo (2011, 2012), they approach the field of finance from a new angle. Instead of asking what investors should decide and optimizing their decision, they ask which behaviors are optimal from a survival perspective. The key difference in their work on the origin of behavior is that they view life as a sequence of decisions. Each day is a new risk situation and new decision. In real life, people do not make discrete static decisions. They choose things with a frequency. For a simple example, consider the purchase of a morning coffee. Although some people buy a coffee from the same place every day, many times our coffee selection looks like a random process with a certain frequency. For example, one person may go to Dunkin Donuts 60 percent of the time and Starbucks 40 percent of the time. In reality, humans are programmed to like variety and we make stochastic decisions in the face of risk. In the case of binary decisions, people often engage in a process which is called probability matching (this concept is discussed in further detail in Chapter 12). This means that people tend to select things at the same frequency as they expect them to occur. Using a simple sequential binary choice model, Brennan and Lo (2011) demonstrate that probability matching (and dynamic decisions over time) are population optimal. This means that behaviors like probability matching are built-in heuristics. These heuristics allow us to adapt and survive as a species (not necessarily always as an individual) over time. Brennan and Lo (2011) examine a wide range of “behavioral biases and heuristics” and derive how they link to survival and decision making over time. Their work provides an evolutionary perspective on our behavior and motivation for why people behave the way that they do.
To further push the understanding of bounded rationality and the concept of human intelligence, Brennan and Lo (2012) take their framework to the next level to explain both bounded rationality and how it is possible for certain market participants with “intelligence” adopt better “behaviors” than others over time. Although mathematically complex, this result in combination with the adaptive markets hypothesis confirms that over time there may be “smart investors” who are more effective at adapting to changes in the market environment. These investors may be able to outperform others over certain periods of time and under certain scenarios.
Speculative Risk Taking
Following a detour into evolutionary finance, this section returns to the act of speculation and the use of so-called intelligent trading strategies. First, two simplifying assumptions are made based on the AMH.
Assumptions for Speculative Risk-Taking Strategies
A1: (AMH holds). Market prices are a function of the market environment, level of competition, and composition of market players in a given market ecology. Supply, demand, risk appetite, and competition drive market prices.
A2: (Risk-free lending and no transaction costs). Markets are frictionless, there are no transaction costs and all collateral earns the full collateral yield at the risk-free rate.
Given these two assumptions, prices may, from time to time, take time to adapt to changes in the market environment. Risk appetite and preferences will also vary across time as market participants adjust to new scenarios and environments.10 In this case, price discrepancies in supply and demand create the possibility for speculative opportunities. In the case where supply and demand takes time to correct prices immediately, this results in a speculative risk premium. Turning to a practical example, momentum strategies profit from this speculative premium. This concept mirrors the recent work by Moskowitz, Ooi, and Pedersen (2012), which documents the existence of time series momentum effects in futures markets. Using one characterization of momentum and a specific set of parameters, their work demonstrates that time series momentum strategies provide positive risk premiums over time. It is important to note that these “speculative risk premiums” do not come from one asset class but from the opportunistic application of momentum strategies across all asset classes.
speculative opportunities opportunities that occur for speculative capital when there are price discrepancies in supply and demand.
The return of a speculative strategy (rt) in futures markets can be characterized by
![]()
where E[rt] = E[πsp] + rf and πsp is a speculative risk premium (positive or negative). The volatility (σ) represents the volatility of the particular speculative trading strategy. The risk-free rate contribution comes from the collateral yield on margin in futures positions.11 The Sharpe ratio of a speculative trading strategy is then characterized by

Using trend following as an example, some trend following strategies have averaged Sharpe ratios of 0.5 to 0.7 over long time horizons. Using a simple back of the envelope calculation, if the average volatility of a trend following program is 10 percent, this means that the speculative risk premium is roughly 5 to 7 percent depending on the time frame. If assumption A2 is relaxed, adding market frictions and transaction costs, the collateral yield may fall below the risk-free rate and trading activity itself will decrease the expected return of a trend following strategy.
It is important to reiterate that for an investment strategy to be profitable there must be an underlying reason for the existence of a profit opportunity, which the strategy can exploit. Speculative strategies that are smart or adaptive enough to consistently exploit opportunities as markets change will earn speculative risk premiums. The most classic example of this is the hedging premium. In commodity markets, speculative traders are said to earn a hedging premium when hedging demand exceeds supply on either the short or long side. Alpha, on the other hand, is a transitory and rare beast. Alpha opportunities are fleeting opportunities that are in excess of a simple speculative risk premium. It is possible to examine two simple examples for demonstrative purposes. First, short bias funds provide negative speculative risk premiums over time, yet in certain scenarios, market crisis, they earn a substantial speculative risk premium. On the other hand, trend following strategies, during most normal market scenarios, earn speculative risk premiums when there is an offset in supply and demand or risk appetite. In extreme scenarios, they adapt to capture crisis alpha. This is explained in further detail in the next section.
■ A Closer Look at Crisis Alpha
Given that trend following strategies trade exclusively in the most liquid, efficient, and credit protected markets, their profitability must rely on those characteristics in order to obtain a competitive edge.
Taking the framework for speculative risk taking one step further, a speculative risk premium is earned by taking speculative bets across asset classes based on the dynamic allocation of capital. Under normal scenarios, there may be fewer opportunities to profit from an offset between supply and demand. Instead, a closer look at the extreme scenario of financial crisis provides a unique situation in financial markets. In this situation, market supply and demand is often highly asymmetric due to natural selection. Competition may be extremely low and market efficiency may be put to the test. To borrow some terminology from the adaptive markets hypothesis, the market ecology will be in what evolutionary biologists call a moment of punctured equilibrium.12 In these moments, certain species will thrive and be adaptable enough to take advantage of crisis alpha opportunities. Figure 4.4 plots the performance of trend following strategies during all of the past large drawdown periods in the S&P 500 since 1980. In this graph, clearly under most circumstances, trend following strategies seem to provide substantial returns during equity crisis periods.
punctured equilibrium a theory in evolutionary biology proposing that species exhibit stasis, a situation with minimal evolutionary change, these moments are sometimes hit with significant evolutionary change, which punctures the previous equilibrium. Following these significant events, there are rapid changes that occur in species.
Figure 4.4 Performance of the Barclay CTA Index during all drawdown periods of the MSCI World TR Gross Index. Dates reflect starting point of all drawdowns greater than 5 percent.
Source: Bloomberg.

Given this, as a speculative risk-taking strategy, the return of a trend following system can be partitioned into crisis alpha, a speculative risk premium (for noncrisis periods), and the risk-free rate (positive carry from collateral). The speculative risk premium represents the risk premium obtained by speculative positions across various futures markets outside of crisis. Crisis alpha are the profits earned during an extreme financial market event. In this case, the return of trend following strategies can be characterized by
![]()
where αc is the crisis alpha contribution, πsp is the speculative risk premium outside of crisis, and the risk-free rate, which represents collateral yield contribution of a future trading program. Given this characterization, the expected return of a trend following program will be defined as
![]()
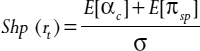
And the Sharpe ratio for a trend following program is
In an adaptive markets world, trend followers earn crisis alpha opportunities by being one of the few that can adapt to a financial crisis. This adaptation is made possible by the lack of credit exposure, highly liquid nature of the strategy, and the existence of positions across all asset classes. In addition, outside of crisis periods, trend following strategies can profit from temporary dislocations in market prices or divergence where speculative pressure helps to realign price discrepancies, which may be due to moderate rifts between supply and demand. Outside of crisis the speculative risk premium may be more relevant in less liquid and newer markets.13 If the expected crisis alpha contribution were 3 percent over time, given a volatility of 10 percent in a trend following program and a Sharpe ratio of 0.5, this implies that the speculative risk premium would be much smaller at only 2 percent (this number is backed out from the Sharpe ratio). The key benefit of dividing trend following performance into these three components comes from the fact that the speculative risk premium should be expected to moderate as, outside of periods of crisis, speculative trading is highly competitive in futures markets. Another important point to highlight is that each trading system will provide a different crisis alpha and speculative risk premium. The characteristics of these two drivers of trend following performance depend intimately on the construction and style of the strategy. This topic is something that will be discussed and developed throughout the course of this book.
Given the EMH and frictionless markets, trend followers can only deliver the risk-free rate with considerable noise. Adding transaction costs, their returns would be less than the risk-free rate. Given the AMH and frictionless markets, trend following strategies deliver the risk-free rate and a speculative risk premium. Taking this one step further, trend following systems deliver crisis alpha, a speculative risk premium, and the risk-free rate. The decomposition of trend following performance is displayed graphically in Figure 4.5.
FIGURE 4.5 A schematic for the return and Sharpe ratio for speculative risk-taking strategies and trend following as an example. Both the EMH and AMH are combined with an assumption that there are no market frictions and no transaction costs.

Empirical Decomposition of Trend Following Returns
Under the assumptions of the AMH, trend following strategies deliver crisis alpha, speculative risk premiums, and collateral yield. Given this, trend following performance can be divided into these three components. To achieve this first, a crisis period must be defined in a simple manner. A crisis period can be defined as a sequence of negative returns, which represents a drawdown below some threshold. In the following example, –5 percent is used as a threshold. The results in this section are relatively robust to modifications in the definition of a crisis period. Figure 4.6 highlights the largest crisis periods in equity markets from 1993 to 2013 where the MSCI World Total Return Index is used as a proxy for equity markets.
crisis period a period of time defined by crisis. Many alternative definitions may be used to define a crisis period. Crisis can be defined by past returns, increases in volatility, or by other measures.
FIGURE 4.6 The MSCI World Index and Crisis Periods from January 1993 to December 2013.
Source: Bloomberg.

By comparing the performance of a trend following strategy with the same trend following strategy where the performance during crisis events is replaced by an investment in Treasury bills, the performance can be divided into three components.
Using the Dow Jones Credit Suisse Managed Futures Index from 1993 to 2013, the Newedge CTA Index from 2000 to 2013, and the Newedge Sub-Trend Index from 2000 to 2013, performance of these common industry indices can be decomposed by crisis alpha, a speculative risk premium, and the risk-free rate. In this case, the 30-day Treasury bill is used as a proxy for the risk-free rate.14 The strategy with crisis periods removed and replaced by the Treasury bill represents the strategy performance without crisis. Figure 4.7, Figure 4.8, and Figure 4.9 plot the performance of the Dow Jones Credit Suisse Managed Futures Index, the Newedge CTA Index and the Newedge Sub-Trend Index over time with and without crisis performance. Following these graphs, the decomposition of trend following return is presented for each of these indices in Figure 4.10. Over the entire sample period from 1993 to 2013, equity crisis periods make up roughly 20 to 25 percent of the investment horizon, but they are responsible for often more than half of the total trend following return. This is not too surprising as crises have been quite frequent during the past 20 years in history. Despite this, longer term studies tend to demonstrate similar results with larger risk premium but always a positive crisis alpha.15
FIGURE 4.7 Crisis alpha decomposition of the Dow Jones Credit Suisse Managed Futures Index from 1993 to 2013. The risk-free rate is the total return on the 30-day Treasury bill.
Sources: Bloomberg, CRSP.

FIGURE 4.8 Crisis alpha decomposition of the Newedge CTA Index from 2000 to 2013. The risk-free rate is the total return on the 30-day Treasury bill.
Sources: Bloomberg, CRSP.

FIGURE 4.9 Crisis alpha decomposition of the Newedge Sub-Trend Index from 2000 to 2013. The risk-free rate is the total return on the 30-day Treasury bill.
Sources: Bloomberg, CRSP.

FIGURE 4.10 Crisis Alpha Decomposition of the DJCS Managed Futures Index from 1993 to 2013, Newedge CTA Index and Newedge Sub-Trend Index from 2000 to 2013. The risk-free rate is the total return on the 30-day Treasury bill.
Source: Bloomberg, CRSP.

In recent times, a closer look at the performance of commonly used trend following and Managed Futures indices shows that crisis periods have been the main driver of performance during the past 20 years. The speculative risk premium has been relatively low and the net performance of trend following has been roughly the same as the rate of return on short-term debt.16 For example in Figure 4.11, the annualized average return during crisis periods and noncrisis periods is plotted for each CTA index. This subtle analysis demonstrates that crisis alpha is at the core of trend following strategic advantage in a portfolio. In Figure 4.10, the crisis alpha contribution in the Newedge CTA index is smaller than the Newedge Sub-Trend Index. This is because trend following strategies, as opposed to a more diversified set of strategies perform best during crisis periods. The Newedge CTA Index has a higher speculative risk premium outside of crisis periods as well. In the next chapter, this observation can be connected to risk-taking approaches. The analysis in this section further demonstrates how trend following is connected to dislocation periods (or market divergence) in financial markets. In recent times most of the market divergence has occurred during periods of financial crisis and stock market bubbles.
FIGURE 4.11 Annualized return of the DJCS Managed Futures Index, Newedge CTA Index, and Newedge Sub-Trend Index during crisis periods and noncrisis periods.
Source: Bloomberg.

A Multicentennial View of Crisis Alpha
Despite the compelling role of crisis alpha in most available studies, many other studies have looked at trend following performance over much longer time periods. Hurst, Ooi, and Pedersen (2012) present a 100-year review of trend following. To reconnect with the analysis in Chapter 1, a closer look at crisis alpha over the past two centuries may help put the recent performance of trend following into perspective and set the stage for a deeper discussion of market divergence in Chapter 5. Taking the simple trend following system from Chapter 1 and the respective equity index, the crisis alpha decomposition for this simple approach can be examined over a 200-year period, respective subperiods, and the most recent time period (for comparison with the last section using industry indices). Figure 4.12 plots the crisis alpha decomposition for 1813 to 2013, four 50-year subperiods, and roughly the same period as examined with the Newedge CTA Index (2000–2013). This decomposition is plotted against the percentage of crisis periods to put the time period into perspective. Figure 4.13 plots crisis alpha versus the percentage of crisis periods. It is clear from both of these figures that the crisis alpha contribution is positive and somewhat linearly related to the amount of crisis in a given period. On average, if there is crisis, trend following seems to take advantage of it. It is also notable that the most recent time period exhibits both the highest percentage of crisis periods and the highest crisis alpha contribution. It is also noticeable that the speculative risk premium varies substantially from time period to time period. This indicates that during certain periods there are trends outside of crisis during some periods more than others. Perhaps it is important to note that in this case crisis alpha is defined only by equity markets. If there are speculative risk opportunities unrelated to equity markets, this will be visible in the speculative risk premium. For example, during the third subperiod of 1913 to 1962, trend following seemed to perform remarkably well during the long recovery after the Great Depression. This analysis is in no means a substitute for a deeper more quantitative study, but it provides a historical perspective on the fervor for crisis alpha that has raised many questions for investors over the past 15 years.
FIGURE 4.12 Crisis Alpha Decomposition from 1813–2013, corresponding 50-year subperiods, and the recent period of 2000–2013. Crisis periods are periods less than –5 percent with negative returns for the Equity index from Chapter 1. The risk-free rate is assumed to be 50 percent of the yield on the bond index from Chapter 1. Crisis Percentage is quoted as number of crisis months over total months in a time period.

FIGURE 4.13 Crisis Alpha and Crisis Percentage from 1813 to 2013, 50-year subperiods, and the recent period of 2000–2013.

Taking a closer look at crisis periods and noncrisis periods, the conditional performance of returns during crisis periods and noncrisis periods is plotted in Figure 4.14. This figure shows that the conditional performance during crisis also follows the crisis percentage. More interesting, the conditional performance of trend following outside of crisis has been higher during noncrisis for all time periods except the most recent 50 years. This seems to be driven mostly by the large difference in performance over the past 13 years. As this study is more qualitative and descriptive, it is not possible to make any predictions as to why, but a longer term analysis may avoid the potential of treating the recent past as a point statistic to explain trend following in a narrow perspective. Chapter 5 will provide a risk-based understanding trend following to complement this perspective.
FIGURE 4.14 Conditional performance during crisis periods and noncrisis periods from 1813 to 2013.

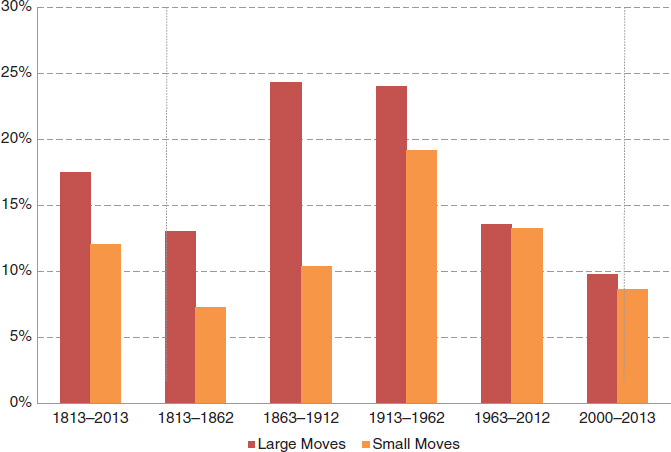
Trend following strategies seem to do well during periods of divergence in markets. This chapter has focused on one particular, extreme event: financial crisis in equity markets. Crisis alpha is one core driver of trend following performance. Yet, given Figure 4.12 and Figure 4.14, it is clear that speculative risk premiums and other forces may also be at work. To begin this analysis, and to provide a foreshadowing to a discussion of market divergence, the conditional performance of trend following for large moves in equity markets (greater than 3 percent) and small moves (less than 3 percent) is plotted in Figure 4.15. Consistent with the discussion in this section, this figure demonstrates the opportunistic nature of trend following during large equity moves, positive or negative. During the past 13 years, large negative equity moves have been positive for trend following where large positive equity moves have not. During the period of 1863 to 1912, the opposite is true; large positive equity moves were positive for trend following and less so for large negative equity moves (the risk premium is much larger than crisis alpha). Figure 4.15 demonstrates that it is indeed possible that performance comes from market moves (or market divergence). This point leads directly to the discussion in Chapter 5.
FIGURE 4.15 A comparison of trend following performance during both large and small moves in equities. Large (small) moves are defined as when the Equity index from Chapter 1 is greater than (less than) 3 percent. The entire time period 1813–2013, 50-year subperiods, and the most recent period of 2000–2013 are plotted.
■ Summary
According to the adaptive markets hypothesis, the forces of natural selection, the combination of species and level of competition in a market and the ability to mutate, adapt, and compete dictates who succeeds or fails in financial markets. Using this perspective, trend following strategies are one of the few strategies that seem able to find crisis alpha opportunities consistently over time. They do this by being liquid, low credit risk, and relatively void of behavioral bias. During periods of crisis they adapt to take of opportunities as they may arise. Returning to the AMH, a speculative risk premium was discussed. For the case of trend following, this premium is composed of the risk-free rate, a risk premium outside of crisis, and crisis alpha. Common industry indices can be decomposed empirically into: the risk-free rate (for positive carry), a noncrisis speculative risk premium, and crisis alpha. The contribution of crisis alpha during recent periods in markets is substantial. To put this into a longer term perspective, 200 years of data on trend following and equity markets is examined demonstrating that the crisis alpha decomposition is highly time period dependent. Crisis alpha is consistently positive and positively correlated with the prevalence of crisis, or crisis percentage. Speculative risk premiums are also a driver of total performance but they vary substantially. Finally, a look at trend following performance for both large and small moves in equity markets demonstrates that trend following strategies depend on market divergence.
■ Further Readings and References
Bossaerts, P., A. Bruguier, and S. Quartz. “Exploring the Nature of Trader Intuition.” Journal of Finance 65 (2010): 1703–1723.
Brennan, T., and A. Lo. “The Origin of Behavior.” Quarterly Journal of Finance 1 (2011): 55–108.
Brennan, T., and A. Lo. “An Evolutionary Model of Bounded Rationality and Intelligence.” PLOS One, 7 (2012).
Dijksterhuis, B., and L. Nordgren. “A Theory of Unconscious Thought.” Perspectives on Psychological Science 1, no. 2 (June 2006): 95–109.
Hasanhodzic, J., and A. Lo. “Black’s Leverage Effect Is Not Due to Leverage.” Working paper, 2012.
Hurst, B., Y. Ooi, and L. Pedersen. “A Century of Evidence on Trend-Following.” AQR Capital white paper, 2012.
Kaminski, K. “Diversify Risk with Crisis Alpha.” Futures Magazine, February 1, 2011.
Kaminski, K. “In Search of Crisis Alpha: A Short Guide to Investing in Managed Futures.” CME Market Education Group, 2011.
Kaminski, K. “Regulators’ Unintentional Effect on Markets.” SFO, July 2011.
Kaminski, K. “Understanding the Performance of CTAs during Market Crisis in the Context of the Adaptive Markets Hypothesis.” RPM working paper, November 2010.
Kaminski, K., and A. Lo. “Managed Futures and Adaptive Markets.” Working paper, 2011.
Kaminski, K., and A. Mende. “Crisis Alpha and Risks in Alternative Investment Strategies.” CME Market Education Group, 2011.
Knutson, B., and C. M. Kuhnen. “The Neural Basis of Financial Risk Taking.” Neuron 47, no. 5 (2005): 763–770.
Lee, S., and N. Schwarz. “Bidirectionality, Mediation, and Moderation of Metaphorical Effects: The Embodiment of Social Suspicion and Fishy Smells.” Journal of Personality and Social Psychology 103, no. 5 (2012): 737–749.
Lo, A. “The Adaptive Markets Hypothesis: Market Efficiency from an Evolutionary Perspective.” Journal of Portfolio Management 30 (2004): 15–29.
Lo, A. “Adaptive Markets and the New World Order,” Financial Analysts Journal 68 (2012): 18–29.
Lo, A. “Fear, Greed, and Financial Crises: A Cognitive Neurosciences Perspective.” In Handbook of Systemic Risk, edited by J.-P. Fouque and J. A. Langsam, 622–662. New York: Cambridge University Press, 2011.
Lo, A. “Reconciling Efficient Markets with Behavioral Finance: The Adaptive Markets Hypothesis.” Journal of Investment Consulting 7 (2005): 21–44.
Lo, A. “Survival of the Richest.” Harvard Business Review, March 2006.
Lo, A., and M. Mueller. “WARNING!: Physics Envy May Be Hazardous to Your Wealth.” Journal of Investment Management 8 (2010): 13–63.
Moskowitz, T., Y. Ooi, and L. Pedersen. “Time Series Momentum.” Journal of Financial Economics 104 (2012): 228–250.
Shull, D. K., K. Celiano, and A. Menaker. “The Surprising World of Trader’s Psychology.” In Investor Behavior: The Psychology of Financial Planning and Investing, edited by B. Baker and V. Ricciardi (pp. 477–493). Hoboken, NJ: John Wiley & Sons, 2014.
1 In other papers, Lo and Mueller (2010) discuss how economists often suffer from “physics envy or a false sense of mathematical precision.” They discuss how finance is often governed by partially irreducible uncertainty. Put more simply, finance is not as quantifiable as physics. The famous physicist Richard Feynman is often quoted as saying “Imagine how much harder physics would be if electrons had feelings!”
2 The advantage of the AMH is that it is consistent with both the EMH and theories of behavioral finance.
3 From an evolutionary perspective, “Fear is the hardwired fire alarm for the brain” (Lo 2011). Fear of taking losses or fear of regret may lead investors to exhibit the disposition effect. Fear of losing out or pure greed can cause investors to follow the herd leading to financial bubbles. For further information regarding emotion in financial decision making: see Shull, Celiano, and Menaker, 2014.
4 To cite a particularly comical example, Lee and Schwarz (2012) wrote a paper with a subtitle “The Embodiment of Social Suspicion and Fishy Smells.” In their research, they demonstrated that investors take 25 percent less risk when they smell fish. This study demonstrates how visceral response even affects our financial decisions. When we smell something funny, such as rotten fish, a simple behavioral heuristic tells us to reduce risk. Another example, Dijksterhuis and Nordgren (2006) present a framework that demonstrates how unconscious thought may outperform in complex situations. Yet, another example, Bossaerts, Bruguier, and Quartz (2010) demonstrate how people, who use Theory of Mind (TOM), an understanding of how others are thinking or, as they put it, “the human capacity to discern malicious or benevolent intent,” outperform strategies using probabilistic reasoning. For a more detailed overview of recent literature in this area, see Shull, Celiano, and Menaker, 2014.
5 Brennan and Lo (2011) and Brennan and Lo (2012) discuss the origin of behavior. Using a binary choice model, they can explain a wide range of commonly discussed heuristics including probability matching, risk foraging, risk aversion, and others.
6 See Shull, Celiano, and Menaker 2014.
7 Knutson and Kuhnen (2005) document that losses and gains that are processed by different parts of the brain and the response patterns of individuals can be linked to their actual portfolio decisions.
8 See Chapter 2 for a discussion of the key characteristics of futures contracts. Futures contracts are transparent, highly liquid, and regulated with reduced counterparty risks due to clearinghouse mechanisms. Futures markets also allow trend following strategies to take directional positions both long and short across a wide range of asset classes.
9 Hidden risks are discussed in further detail in Chapter 9.
10 For example, Hasanhodzic and Lo (2012) discuss that leverage does not drive the relationship between equity markets and volatility. They suggest that risk is dependent on past experiences. As we gain experience and the environment changes, our preferences for risk vary as well.
11 Application of the risk-free rate may not be relevant in strategies that do not earn collateral yield.
12 Punctured equilibrium is a theory that the evolution of species is relatively stable over long periods of time with short periods where there is rapid change and mutation.
13 This concept is explored later in Chapter 12 on style analysis and style factors.
14 For a rough estimate, collateral yield is often roughly 50 percent the Treasury bill rate as a proxy for positive carry.
15 For another example see Kaminski (2011), AQR Capital’s “A Century of Evidence on Trend-Following” by Hurst, Ooi, and Pedersen (2012).
16 For the crisis alpha decomposition in this section, the collateral yield or interest earned on capital for trend following is set to half the return of the 30-day T-bill rate. This is chosen as a proxy for interest earned as full collateralization is often not possible.