
37. Ubuntu System and Process Monitoring
An important part of running and administering an Ubuntu system involves monitoring the overall system health in terms of memory, swap, storage and processor usage. This includes knowing how to inspect and manage both the system and user processes that are running in the background. This chapter will outline some of the tools and utilities that can be used to monitor both system resources and processes on an Ubuntu system.
Even when an Ubuntu system appears to be idle, many system processes will be running silently in the background to keep the operating system functioning. Each time you execute a command or launch an app, user processes are started which will run until the associated task is completed.
To obtain a list of active user processes you are currently running within the context of a single terminal or command-prompt session use the ps command as follows:
$ ps
PID TTY TIME CMD
10395 pts/1 00:00:00 bash
13218 pts/1 00:00:00 ps
The output from the ps command shows that there are currently two user processes running within the context of the current terminal window or command prompt session, the bash shell into which the command was entered, and the ps command itself.
To list all of the active processes running for the current user, use the ps command with the -a flag. This will list all running processes that are associated with the user regardless of where they are running (for example processes running in other terminal windows):
$ ps -a
PID TTY TIME CMD
976 tty1 00:00:22 Xorg
1026 tty1 00:00:00 gnome-session-b
.
.
13217 pts/0 00:00:00 nano
13265 pts/2 00:00:00 cat
13272 pts/1 00:00:00 ps
As shown in the above output, the user has some processes running that relate to the GNOME desktop in addition to the nano text editor, the cat command and the ps command.
To list the processes for a specific user, run ps with the -u flag followed by the user name:
# ps -u john
PID TTY TIME CMD
914 ? 00:00:00 systemd
915 ? 00:00:00 (sd-pam)
970 ? 00:00:00 gnome-keyring-d
974 tty1 00:00:00 gdm-x-session
.
.
Note that each process is assigned a unique process ID which can be used to stop the process by sending it a termination (TERM) signal via the kill command. For example:
$ kill 13217
The advantage of ending a process with the TERM signal is that it gives the process the opportunity to exit gracefully, potentially saving any data that might otherwise be lost.
If the standard termination signal does not terminate the process, repeat the kill command with the -9 option. This sends a KILL signal which should cause even frozen processes to exit, but does not give the process a chance to exit gracefully possibly resulting in data loss:
$ kill -9 13217
To list all of the processes running on a system (including all user and system processes), execute the following command:
$ ps -ax
PID TTY STAT TIME COMMAND
1 ? Ss 0:05 /sbin/init splash
2 ? S 0:00 [kthreadd]
3 ? I< 0:00 [rcu_gp]
4 ? I< 0:00 [rcu_par_gp]
.
.
To list all processes and include information about process ownership, CPU and memory use, execute the ps command with the -aux option:
$ ps -aux
USER PID %CPU %MEM VSZ RSS TTY STAT START TIME COMMAND
root 1 0.0 0.2 225860 9540 ? Ss 10:37 0:05 /sbin/init splash
root 2 0.0 0.0 0 0 ? S 10:37 0:00 [kthreadd]
root 3 0.0 0.0 0 0 ? I< 10:37 0:00 [rcu_gp]
root 4 0.0 0.0 0 0 ? I< 10:37 0:00 [rcu_par_gp]
.
.
demo 13924 0.0 0.1 28272 3836 pts/2 S+ 14:57 0:00 man ps
demo 13934 0.0 0.0 16952 1048 pts/2 S+ 14:57 0:00 pager
demo 14068 0.0 0.0 46772 3560 pts/1 R+ 15:02 0:00 ps aux
.
.
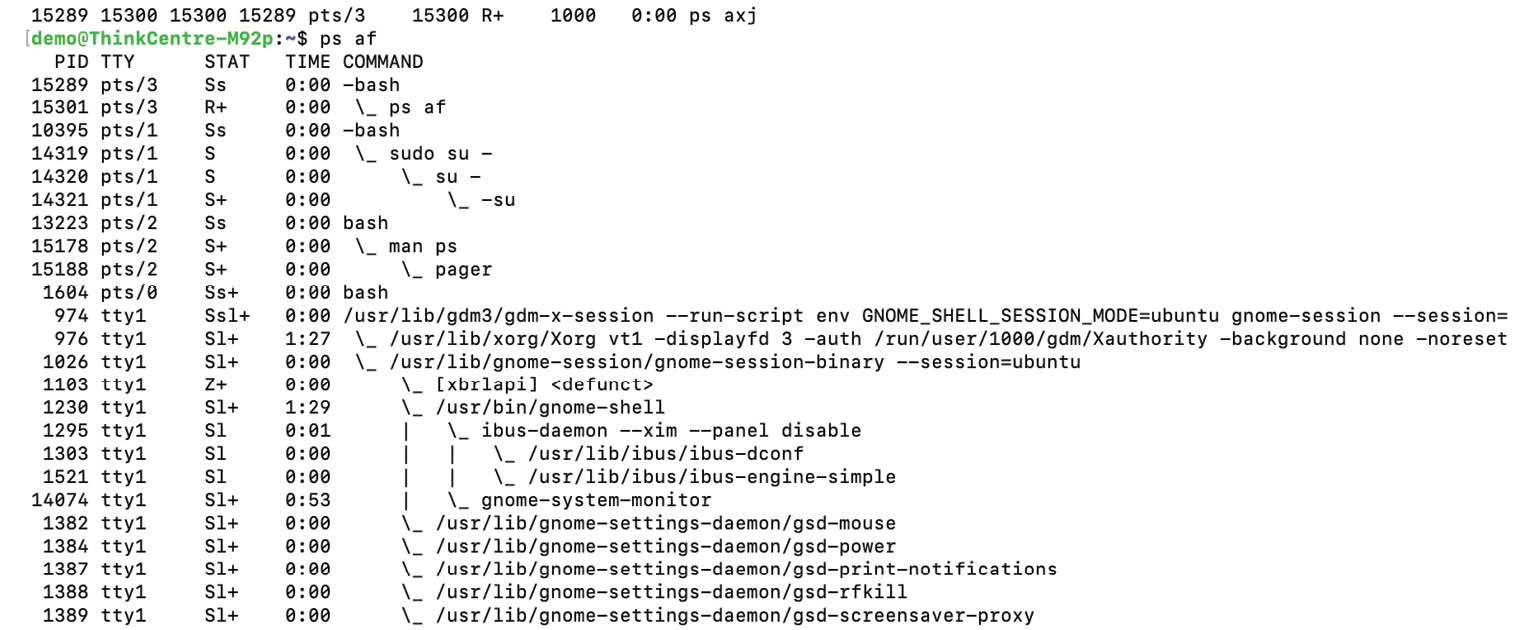
A Linux process can start its own sub-processes (referred to as spawning) resulting in a hierarchical parent-child relationship between processes. To view the process tree, use the ps command and include the -f option. Figure 37-1, for example, shows part of the tree output for a ps -af command execution:
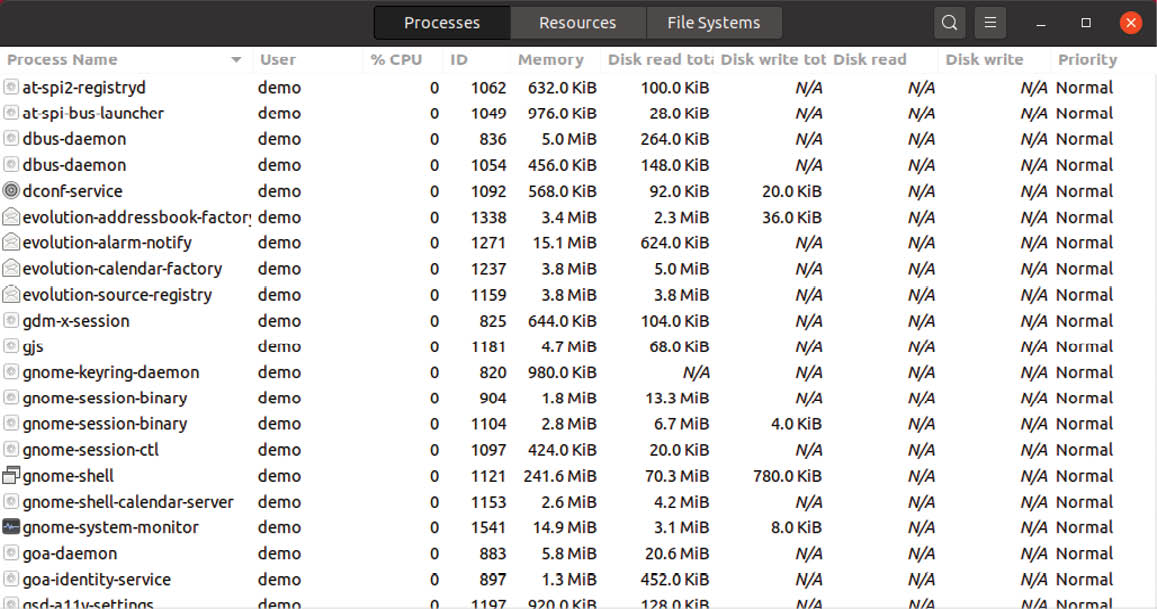
From within the GNOME desktop, process information may also be viewed via the System Monitor tool. This tool can either be launched by searching for “System Monitor” within the desktop environment, or from the command-line as follows:
Once the System Monitor has launched, select the Processes button located in the toolbar to list the processes running on the system as shown in Figure 37-2 below:
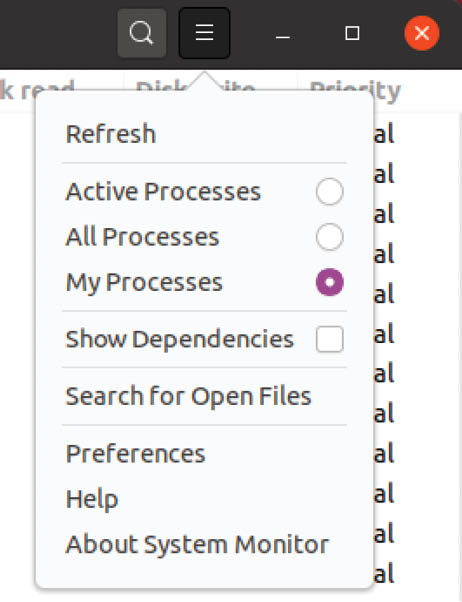
To change the processes listed (for example to list all processes, or just your own processes), use the menu as illustrated in Figure 37-3:
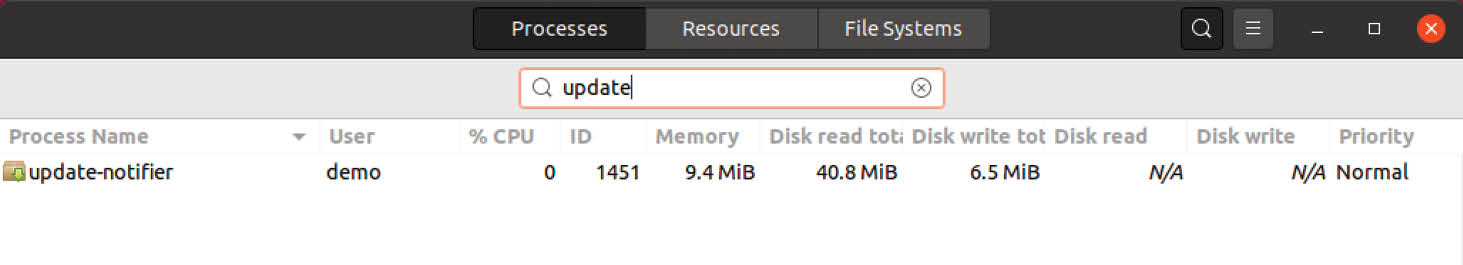
To filter the list of processes, click on the search button in the title bar and enter the process name into the search field:
To display additional information about a specific process, select it from the list and click on the button located in the bottom right-hand corner (marked A in Figure 37-5) of the dialog:
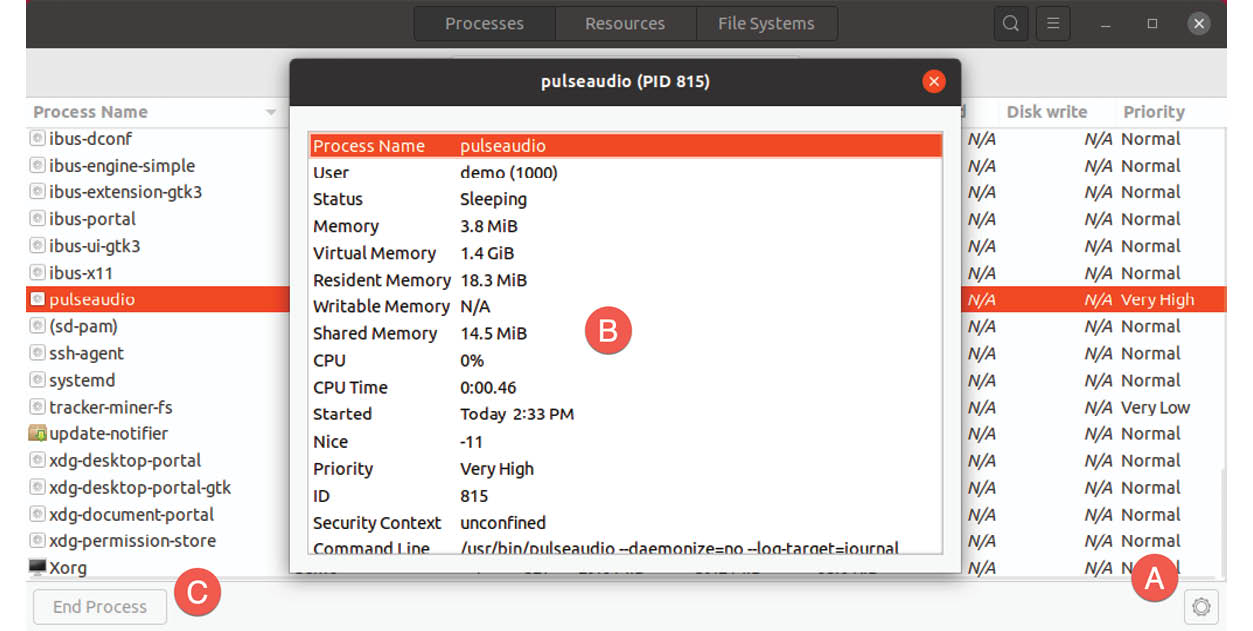
When the button is clicked a dialog similar to that marked B in the above figure will appear. To terminate a process, select it from the list and click on the End Process button (C).
To monitor CPU, memory, swap and network usage, simply click on the Resources button in the title bar to display the screen shown in Figure 37-6:

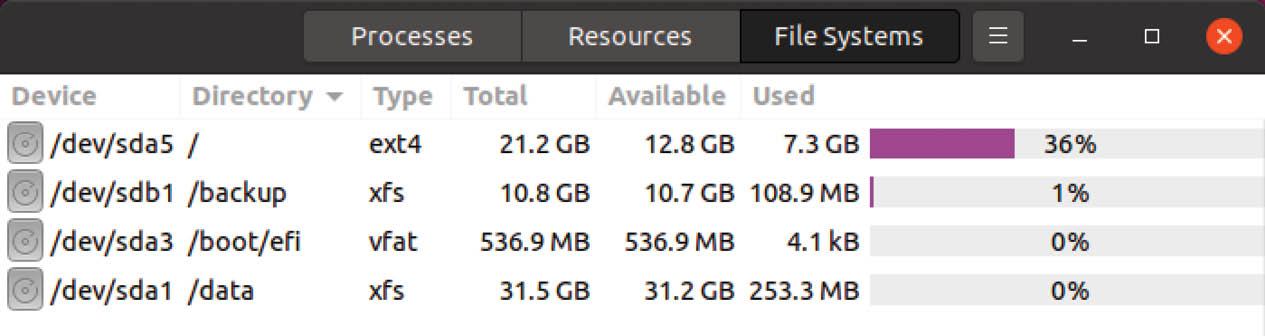
Similarly, a summary of storage space used on the system can be viewed by selecting the File Systems toolbar button:
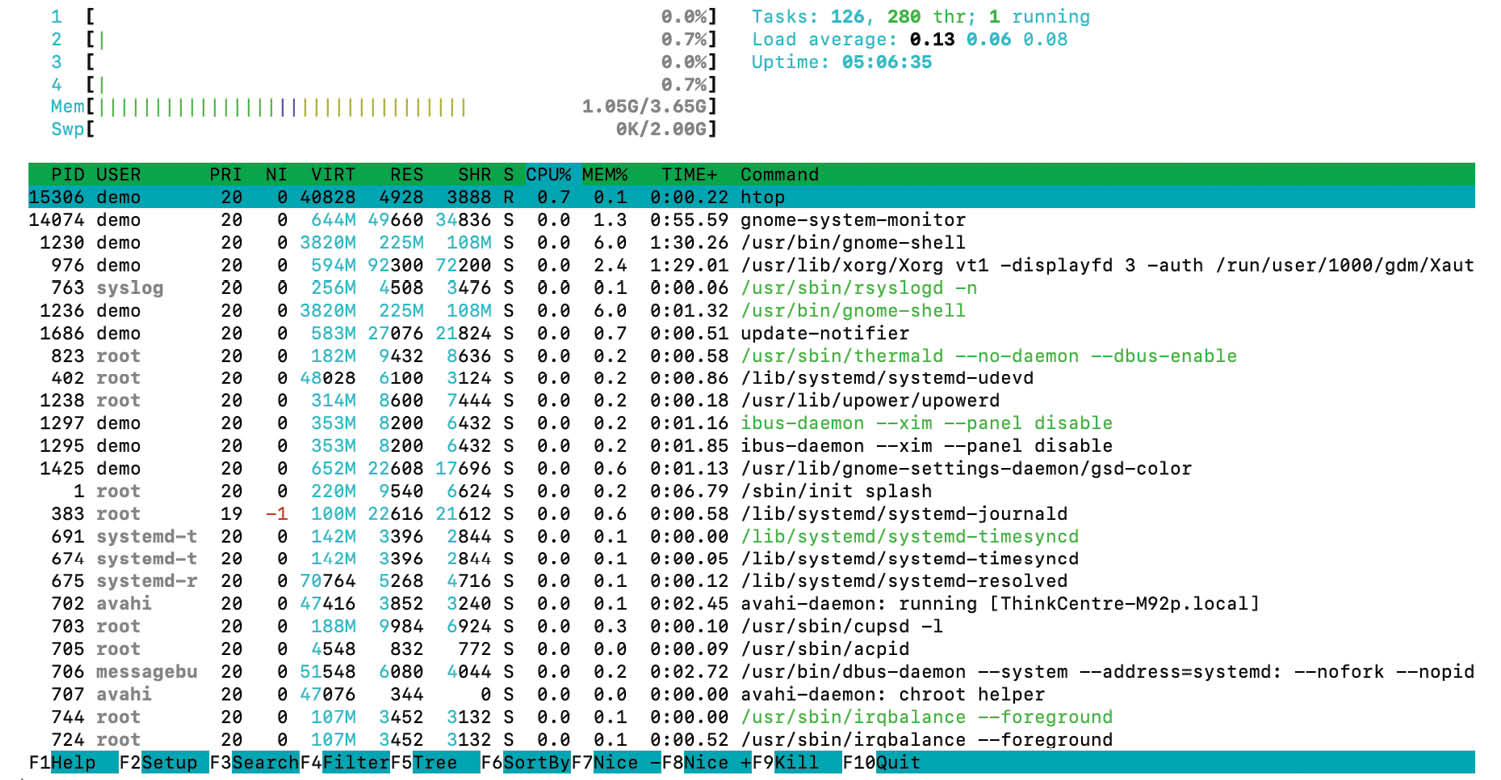
37.2 Real-time System Monitoring with htop
As outlined in the chapter entitled “An Overview of the Ubuntu Cockpit Web Interface”, the Cockpit web interface can be used to perform some basic system monitoring. The previous section also explained how the GNOME System Monitor tool can be used to monitor processes and system resources. In this chapter we have also explored how the ps command can be used to provide a snapshot view of the processes running on an Ubuntu system. The ps command does not, however, provide a real-time view of the processes and resource usage on the system. To monitor system resources and processes in real-time from the command prompt, the htop command is an ideal tool. Though not generally installed by default, htop may be installed as follows:
Once installed, launch htop as follows:
$ htop
When running, htop will list the processes running on the system ranked by system resource usage (with the most demanding process in the top position). The upper section of the screen displays a graph showing memory and swap usage information together with CPU data for all CPU cores. All of this output is constantly updated, allowing the system to be monitored in real-time:
To limit the information displayed to the processes belonging to a specific user, start htop with the -u option followed by the user name:
For a full listing of the features available in htop, press the keyboard F1 key or refer to the man page:
$ man htop
37.3 Command-Line Disk and Swap Space Monitoring
Disk space can, of course, be monitored both from within Cockpit and using the GNOME System Monitor. To identify disk usage from the command line, however, the df command provides a useful overview:
# df -h
Filesystem Size Used Avail Use% Mounted on
udev 1.8G 0 1.8G 0% /dev
tmpfs 374M 1.7M 372M 1% /run
/dev/sda5 92G 7.2G 80G 9% /
tmpfs 1.9G 0 1.9G 0% /dev/shm
tmpfs 5.0M 4.0K 5.0M 1% /run/lock
tmpfs 1.9G 0 1.9G 0% /sys/fs/cgroup
.
.
In the above output, the root filesystem (/) is currently only using 7.2GB of space leaving 80GB of available space.
To review current swap space and memory usage, run the free command:
# free
total used free shared buff/cache available
Mem: 3823720 879916 1561108 226220 1382696 2476300
To continuously monitor memory and swap levels, use the free command with the -s option, specifying the delay in seconds between each update (keeping in mind that the htop tool may provide a better way to view this data in real-time):
$ free -s 1
Mem: 3823720 879472 1561532 226220 1382716 2476744
Swap: 2097148 0 2097148
total used free shared buff/cache available
Mem: 3823720 879140 1559940 228144 1384640 2475152
Swap: 2097148 0 2097148
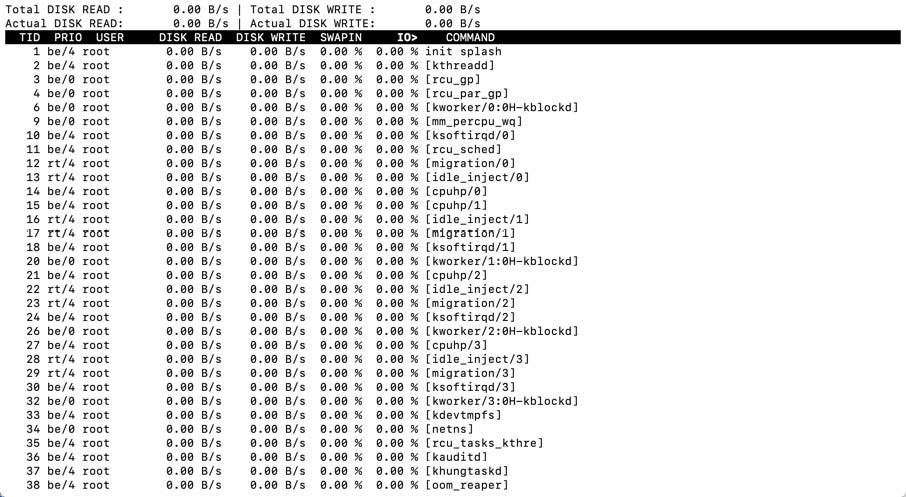
To monitor disk I/O from the command-line, consider using the iotop command which can be installed as follows:
# apt install iotop
Once installed and executed (iotop must be run with system administrator privileges), the tool will display a real-time list of disk I/O on a per process basis:
Even a system that appears to be doing nothing will have many system processes running in the background. Activities performed by users on the system will result in additional processes being started. Processes can also spawn their own child processes. Each of these processes will use some amount of system resources including memory, swap space, processor cycles, disk storage and network bandwidth. This chapter has explored a set of tools that can be used to monitor both process and system resources on a running system and, when necessary, kill errant processes that may be impacting the performance of a system.