Chapter 10. Managing and Monitoring Clusters and Resources
This chapter covers the following topics:
• Create and Configure a vSphere cluster
• Create and Configure a vSphere DRS cluster
• Create and Configure a vSphere HA cluster
• Monitor and Manage vSphere Resources
• Events, Alarms, and Automated Actions
This chapter contains information related to VMware 2V0-21.20 exam objectives 1.6, 1.6.2, 1.6.3, 1.6.4, 1.6.4.1, 4.9, 5.1, 5.1.1, 5.2, 5.3, 7.5, 7.12
This chapter introduces vSphere 6.7, describes its major components, and identifies its requirements.
“Do I Know This Already?” Quiz
The “Do I Know This Already?” quiz allows you to assess whether you should study this entire chapter or move quickly to the “Exam Preparation Tasks” section. Regardless, the authors recommend that you read the entire chapter at least once. Table 10-1 outlines the major headings in this chapter and the corresponding “Do I Know This Already?” quiz questions. You can find the answers in Appendix A, “Answers to the ‘Do I Know This Already?’ Quizzes and Review Questions.”
Table 10-1 “Do I Know This Already?” Section-to-Question Mapping

Caution
The goal of self-assessment is to gauge your mastery of the topics in this chapter. If you do not know the answer to a question or are only partially sure of the answer, you should mark that question as wrong for purposes of the self-assessment. Giving yourself credit for an answer you correctly guess skews your self-assessment results and might provide you with a false sense of security.
1. You want to add hosts to a cluster for which you previously chose the option Configure network settings later. Which of the following is a true statement?
a. You cannot use Quickstart to add more hosts to the cluster.
b. You can use Quickstart to add hosts to the cluster and configure the host networking.
c. You can use Quickstart to add hosts to the cluster but must manually configure the host networking
d. You can edit the cluster and change the Configure networking settings later option.
2. You are creating a resource pool in a DRS cluster. Which of the following statements is not true?
a. When you create a child resource pool, the system applies admission control.
b. If you choose Scale Descendant’s Shares, then child pools will use scalable share
c. The default CPU Reservation is 0.
d. The default Memory Limit is 0.
3. You are configuring a vSphere HA cluster. Which of the following is not a valid setting for Define host failover capacity?
a. Standby
b. Cluster Resource Percentage
c. Slot Policy
d. Dedicated Host Failures
4. You want to configure VMCP in a vSphere Cluster. Which of the following settings are valid?
a. In the vSphere HA settings, set Failures and Responses > Datastore with PDL to Power off and restart VMs - conservative restart policy
b. In the vSphere HA settings, set Failures and Responses > Datastore with PDL to Power off and restart VMs
c. In the vSphere DRS settings, set Failures and Responses > Datastore with APD to Power off and restart VMs - conservative restart policy
d. In the vSphere DRS settings, set Failures and Responses > Datastore with APD to Power off and restart VMs - conservative restart policy
5. You are configuring a vSphere HA cluster and want to configure Proactive HA Which of the following is not a requirement?
a. Host.Config.Quarantine and Host.Config.Maintenance privileges
b. A vendor supplied vSphere Client plugin
c. A VMware supplied plugin
d. vSphere DRS is enabled.
6. You are experiencing poor performance for an application in a virtual machine. You learn from guest OS software and the vSphere Client Performance Charts that the guest OS is paging. Which of the following is likely to fix the problem?
a. Increase memory in the ESXi host.
b. Increase the memory size of the virtual machine.
c. Migrate the virtual machine to a host with plenty of free memory.
d. Reserve all the virtual machine’s memory.
7. You are configuring virtual disks for the virtual machines in your vSphere environment. Which provisioning type is the best choice when you care more about optimizing the disk usage and less about performance or availability risk?
a. Thin provisioned
b. Thick Eager zeroed
c. Thick Lazy zeroed
d. Sparse provisioned.
8. You are using ESXTOP to analyze your vSphere performance. Which of the following statistics is the best indicator of some resource contention?
a. %USED
b. %DRPTX
c. OVHD
d. READ/s
9. You are configuring alarms in your vSphere environment. Which of the followings is not a valid event type?
a. Error
b. Warning
c. Information
d. Audit
10. You are examining vSphere logs. Which of the following logs contain data about the agent that manages and configures the ESXi host?
a. /var/log/vmkernel.log
b. /var/log/vpxa.log
c. /var/log/hostd.log
d. /var/log/vmksummary.log
Foundation Topics
Create and Configure a vSphere Cluster
Using the vSphere Client, you can create a vSphere cluster and use its Quickstart feature to configure the cluster. You can configure DRS, vSphere HA, and EVC on the cluster, as described in this chapter. You can also configure vSAN on the cluster, as described in Chapter 11.
Create a Cluster
To create a vSphere cluster that you plan to configure using Quickstart. you should ensure that the hosts have the same ESXi version and patch level. If you are adding hosts to the vCenter Server inventory, you need the credentials for root user account for the hosts. You must have the Host.Inventory.Create cluster privilege. To create a cluster that you manage with a single image, verify that you have a supported ESXi 7.0 or later image available in the vSphere Lifecycle Manager depot. You can use the following procedure to create the cluster.
Step 1. In the vSphere Client, right-click a data center in the inventory pane
Step 2. Select New Cluster.
Step 3. Enter a name for the cluster.
Step 4. Optionally, for each of the following services, slide the switch to the right to enable the service (default is disabled).
• DRS (Default settings: Fully Automated using Threshold Level 3)
• vSphere HA
• vSAN
Step 5. Optionally, to create a cluster that you manage with a single image, select Manage all hosts in the cluster with a single image.
• Select an ESXi Version (Image) from the drop-down menu.
• Optionally, select an option from the Vendor Addon and Vendor Addon version drop-down menus.
Step 6. Click OK.
Configure the Cluster with Quickstart
To modify an existing cluster, you can select the cluster in the inventory pane and click Configure > Configuration > Quickstart. On the Quickstart page you will see three cards, Cluster Basics, Add Hosts, and Configure Cluster. To change the name and the enabled cluster services, click Cluster Basics > Edit. To add a host to a cluster, you can use the following procedure.
![]()
1. In the vSphere Client, select a cluster in the inventory pane.
2. Navigate to Configure > Configuration > Quickstart > Add Hosts > Add.
3. Click New Hosts > Add to and provide the name (or IP address) and credentials for each host that you want to add that is not already in the vCenter Server inventory.
4. Optionally, select the Use the same credentials for all hosts option
5. Click Existing Hosts > Add to and select each host that you want to add that is already in the vCenter Server inventory
6. Click Next.
7. On the Host summary page, click Next.
8. On the Ready to complete page, click Finish.
9. Monitor the progress in Recent Tasks, which will display any errors.
10. When complete, you can view the number of hosts and the health on the Add Hosts card. Optionally, select Re-validate.
11. You can use the inventory pane to verify the hosts are attached to the cluster and are in maintenance mode.
To configure cluster settings and host networking in a cluster, you can use the following procedure.
1. In the vSphere Client, select a cluster in the inventory pane.
2. Navigate to Configure > Configuration > Quickstart.
3. Optionally, if you want to configure the cluster manually, click Skip quickstart, which is irreversible. Otherwise continue with the following steps to use Quickstart to configure the cluster.
4. Click Configure Cluster > Configure.
5. On the Distributed switches page, you can either select the irreversible option Configure networking settings later or use the following steps to configure the cluster networking.
a. Specify the number of distributed switches to create (up to three).
b. Enter a unique name for each distributed switch. Alternatively, click Use Existing and select an existing compatible distributed switch and distributed port group.
c. To set up the vMotion network, select a distributed switch and assign a new port group to it.
d. In the Physical adapters section, for each physical network adapter, assign a distributed switch name from the drop-down menu. Ensure that each new distributed switch is assigned to at least one physical adapter. For any existing distributed switch, to avoid an error, select the physical adapter that is currently mapped to the switch.
e. Click Next.
f. If you enabled the vSphere DRS feature during cluster creation, the vMotion traffic page appears. Provide the VLAN ID, protocol type, and IP configuration.
6. Click Next.
7. In the Advanced options page, configure the following options.
a. If you enabled vSphere HA during cluster creation, use the options in the High Availability section to enable or disable host failure monitoring, virtual machine monitoring, and admission control. For admission control, you can specify the number of hosts for failover capacity.
b. If you enabled vSphere DRS during cluster creation, use the options in the Distributed Resource Scheduler to set the automation level and migration threshold.
c. In the Host Options section, set the Lockdown mode and enter an NTP server address.
d. Optionally, in the Enhanced vMotion Capability section, use the options to enable EVC and select a mode.
8. Click Next.
9. The Ready to complete page appears.
10. Review the settings and select Finish.
You can extend a cluster by adding more hosts. If you initially selected the Skip Quickstart option, then you should add hosts manually. If you previously used Quickstart, but selected Configure networking settings later, then you can add hosts using Quickstart, but must manually configure the host networking. To extend a cluster, you can use the following procedure.
1. In the vSphere Client select a configured cluster in the inventory pane
2. Right-click the cluster and select Add Hosts.
3. In the wizard, select hosts from the vCenter Server inventory and add new hosts (provide name and credentials) to include in the cluster.
4. On the Ready to complete page, click Finish.
5. The Extend Cluster Guide page appears.
6. In the Configure hosts card, select Configure.
a. If you previously used Quickstart to configure the host networking, then the vMotion traffic page appears. Provide the VLAN ID, protocol type, and IP configuration.
b. A pop-up window appears. It informs you that the configuration for the hosts that exist in the cluster is applied to the newly added hosts.
7. Select Continue.
After successful validation, the Configure button in the Configure Hosts card becomes inactive. The Re-validate button is available.
If you enable DRS, its default settings are Automation Level is Fully Automated using Threshold is 3). If you enable HA, the default values are (Host Monitoring and Admission Control are Enabled, VM Monitoring is Disabled). You can override the default values later in the workflow.
If you select an image to use to manage all the hosts in the cluster, you can later edit the image specification later from the Updates tab. If you do not choose an image to manage hosts, you must manage the cluster by using baselines and baseline groups. You can switch from using baselines to using images later.
Starting with vSphere 7.0, you can use vSphere Lifecycle Manager to upgrade and update the hosts in your cluster. A vSphere Lifecycle Manager image is a combination of vSphere software, driver software, and desired firmware for specific host hardware. You can assign an image to a cluster uses to control the software set to be installed on the hosts including the ESXi version, additional VMware-provided software, and vendor software, such as firmware and drivers.
The image that you define during cluster creation is not immediately applied to the hosts. If you do not set up an image for the cluster, the cluster uses baselines and baseline groups. For more information about using images and baselines to manage hosts in clusters, see the Managing Host and Cluster Lifecycle documentation.
EVC Mode
As previously described, you can configure EVC using Quickstart > Configure Cluster. You can also configure EVC directly in the cluster settings. You can set VMware EVC to Disable EVC, Enable EVC for AMD Hosts, or Enable EVC for Intel Hosts.
If you choose Enable EVC for AMD Hosts, then you can set the mode to one of the options in Chapter 4 Table 4-3.
If you choose Enable EVC for Intel Hosts, then you can set the mode to one of the options in Chapter 4 Table 4-2.
To view the EVC mode for all the cluster’s virtual machines in the vSphere Client, you can select a cluster, navigate to its VMs tab, select Show / Hide Columns > EVC Mode.
Create and Configure a vSphere DRS Cluster
This section describes how to create and configure a vSphere DRS cluster.
Create a vSphere DRS Cluster
To create a vSphere DRS cluster, follow the procedure in the Create a Cluster section in this chapter and ensure that you choose to enable the DRS service. Use the remaining information in this section to configure the DRS cluster.
Create a Resource Pool
You can use the following procedure to create a child resource pool in a DRS cluster.
1. In the vSphere Client, navigate to Hosts and Clusters, and right-click a DRS cluster in the inventory.
2. Select New Resource Pool.
3. Provide a name for the resource pool.
4. Optionally, select the Scale Descendant’s Shares checkbox to enable scalable shares. (Enabling this option causes any child resource pools to use scalable shares, which scale dynamically when adding and removing virtual machines.)
5. Optionally, set CPU and Memory Shares to low, normal, high, or custom (default is normal). If you select custom, enter a numeric value
6. Optionally, set CPU and Memory Reservation to a numeric value (default is 0) and a unit of measure (MB, GB, MHz, or GHz).
7. Optionally, set CPU and Memory Limit to a numeric value (default is Unlimited) and a unit of measure (MB, GB, MHz, or GHz).
8. Optionally, set the CPU and Memory Reservation Type to Expandable
9. Click OK.
Note
When you create a child resource pool, the vSphere Client prompts you for resource pool attribute information. The system uses admission control to ensure that you do not allocate resources that are not available. If you choose Scale Descendant’s Shares, then each descendant pool will also use scalable shares. You cannot change this behavior per child pool.
Configure Advanced DRS Options
Create Affinity / Anti-Affinity Rules
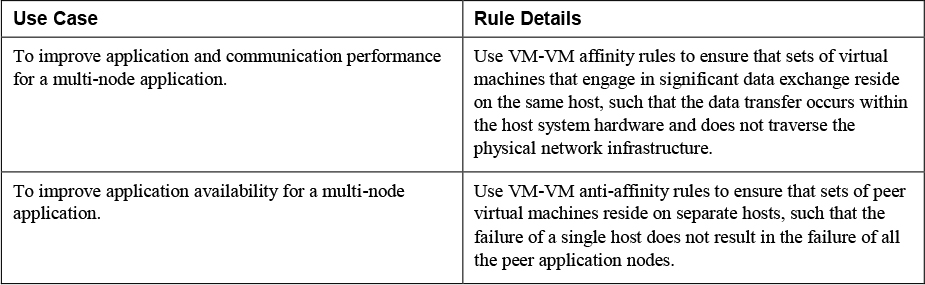
Table 10-2 provides some common use cases for VM-VM affinity and anti-affinity rules.
![]()
Table 10-2 Use Cases for VM-VM Rules
You can use the following procedure to create a VM to VM affinity or anti-affinity rule.
Create a VM-VM Affinity Rule
Procedure
1. Browse to the cluster in the vSphere Client.
2. Click the Configure tab.
3. Under Configuration, click VM/Host Rules.
4. Click Add.
5. In the Create VM/Host Rule dialog box, type a name for the rule.
6. From the Type drop-down menu, select either Keep Virtual Machines Together (affinity) or Separate Virtual Machines (anti-affinity).
7. Click Add.
8. Select at least two virtual machines to which the rule will apply and click OK.
9. Click OK.
Configure Predictive DRS
To configure Predictive DRS, you can use the following procedure.
1. In the vRealize Operations (vROps) GUI, locate the appropriate vCenter Server adapter instance.
2. Select the adapter, choose Advanced Settings
3. Set Provide data to vSphere Predictive DRS to True.
4. In the vSphere Client, select the cluster in the inventory pane.
5. Navigate to Cluster > Services > vSphere DRS > Edit
6. Check the Predictive DRS checkbox
Create and Configure a vSphere HA Cluster
This section describes how to create and configure a vSphere HA cluster.
Create a vSphere HA Cluster
To create a vSphere HA cluster, follow the procedure in the Create a Cluster section in this chapter and ensure that you choose to enable the vSphere HA service. Use the remaining information in this section to configure the vSphere HA cluster.
Configure Advanced vSphere HA Options
You can use the following procedures to add vSphere HA Advanced Options, as described in Table 4-9.
1. In the vSphere Client, select a vSphere HA cluster in the inventory pane.
2. Navigate to Configure > vSphere Availability > Edit > Advanced Options.
3. Click Add
4. Enter the name of the advanced option and the value.
5. Click OK.
Configure vSphere HA Admission Control
![]()
To configure Admission Control for a vSphere HA cluster, you can use the following procedure.
1. In the vSphere Client, select the vSphere HA cluster in the inventory pane.
2. Navigate to Configure >vSphere Availability > Edit.
3. Click Admission Control and set Host failures cluster tolerates to the maximum number of host failures you want the cluster to support.
4. Select one of the following options for Define host failover capacity by, as described in Table 4-8.
• Cluster Resource Percentage
• Slot Policy (powered-on VMs)
• Dedicated Host Failures
• Disabled (disables Admission Control)
5. Optionally, set the Performance Degradation VMs Tolerate to a percentage.
6. Click OK.
Configure VMCP
To configure Virtual Machine Component Protection (VMCP) in a vSphere HA cluster, you can use the following procedure.
1. In the vSphere Client, select the cluster in the inventory pane.
2. Navigate to Configure > vSphere Availability > Edit
3. Set Failures and Responses > Datastore with PDL to one of the following
• Issue Events
• Power off and restart VMs
4. Set Failures and Responses > Datastore with APD to one of the following
• Issue Events
• Power off and restart VMs - conservative restart policy
• Power off and restart VMs - aggressive restart policy
Configure Virtual Machine and Application Monitoring
You can use the following procedure to turn on and configure virtual machine and application monitoring in a vSphere HA cluster.
1. In the vSphere Client, select the vSphere HA cluster in the inventory pane.
2. Navigate to Configure >t vSphere Availability > Edit.
3. Select Failures and Responses > VM Monitoring.
4. Select VM Monitoring to turn on VMware Tools heartbeats.
5. Select Application Monitoring.to turn on application heartbeats.
6. To set the heartbeat monitoring sensitivity, move the slider between Low and High, or select Custom and provide a custom value.
7. Click OK.
Configure Proactive HA
![]()
To get started, you need to install a supported, vendor supplied vSphere Client plugin and register the Proactive HA Provider. When you turn on Proactive HA in a cluster, you can select from the list of providers for installed plugins that are monitoring every host in the cluster. You can use the following procedure to configure Proactive HA in a cluster.
1. Ensure the following prerequisites are met.
• vSphere HA and DRS are enabled.
• To allow remediation actions, you need the Host.Config.Quarantine and Host.Config.Maintenance privileges.
2. In the vSphere Client, select the cluster in the inventory pane.
3. Navigate to Configure > vSphere Availability > Edit.
4. Select Turn on Proactive HA.
5. Click Proactive HA Failures and Responses
6. Set Automation Level to Manual or Automated
7. Set Remediation to one of the following.
• Quarantine mode for all failures.
• Quarantine mode for moderate and Maintenance mode for severe failure (Mixed).
• Maintenance mode for all failures.
Configure vSphere Fault Tolerance
Before enabling vSphere Fault Tolerance (FT) for a virtual machine, you must prepare the hosts and cluster, by doing the following. Configure vSphere HA on the cluster. On each participating host, configure a vMotion port group, a VMkernel adapter enabled for vMotion, a Fault Tolerance Logging network, and a VMkernel adapter enabled for FT Logging.
To turn on FT for a virtual machine, you can use the following procedure.
• In the vSphere Client, right-click the virtual machine in the inventory pane.
• Select Fault Tolerance > Turn On Fault Tolerance.
• Click Yes.
• Select a datastore on which to place the Secondary VM configuration files and click Next.
• Select a host on which to place the Secondary VM and click Next.
• Review your selections and then click Finish
Before FT is turned for a virtual machine, FT performs several validation steps related to the FT requirements listed in Chapter 4, “Clusters and High Availability.” The virtual machine datastores and memory are replicated as FT is turned on. This may take several minutes, during which the virtual machine status does not appear as protected. When the replication completes and the state of the Secondary VM is synchronized with the Primary VM, the status changes to Protected.
To test FT failover for a virtual machine, right-click the virtual machine and select Fault Tolerance > Test Failover. Likewise, you can select Fault Tolerance > Test Restart Secondary to restart the Secondary VM.
Monitor and Manage vSphere Resources
You can use the vSphere Client Performance Graphs to view compute, storage, and network resource usage of virtual machines, hosts, and clusters. For a more granular look from the host perspective, you can use the ESXTOP utility. You can use vCenter Server alarms to bring attention to conditions and events that may call for human intervention, such low resource availability on a cluster, host, or datastore. To bring multi-vCenter Server monitoring, predictive analysis, and intelligent operations to your environment, you can consider integrating vRealize Operations (vROps).
Metrics
Performance metrics are organized into logical groups based on the object or object device, as shown in Table 10-3.
Table 10-3 Metrics
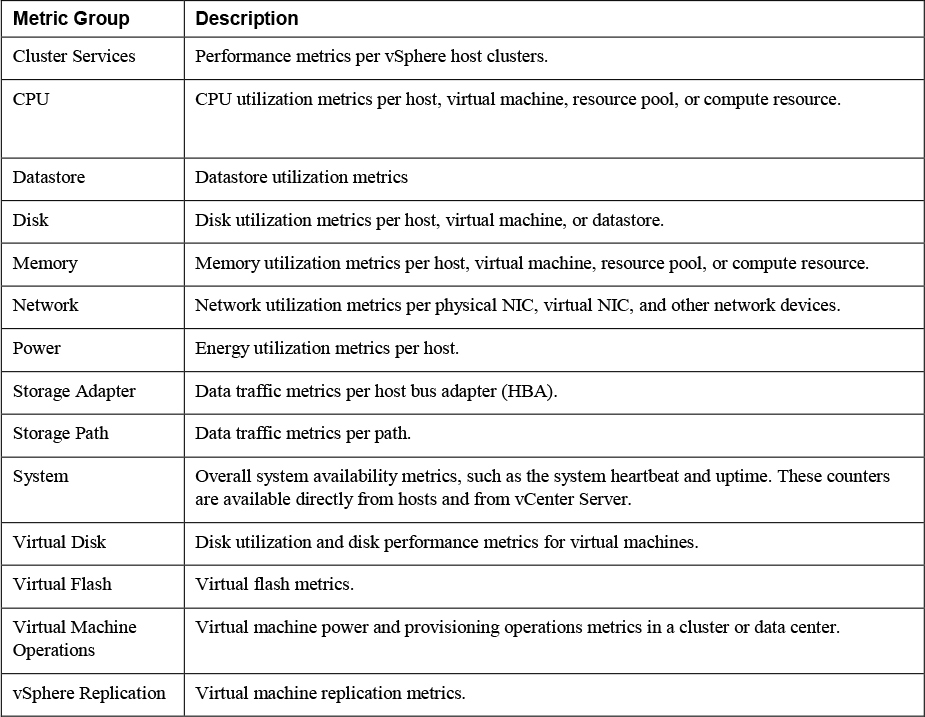
Disk metrics include I/O performance, such as latency and read/write speeds, and utilization metrics for storage as a finite resource.
The value obtained for memory utilization is one of the following:
• For virtual machines, memory refers to the guest physical memory, which is the virtual memory the hypervisor presents to the guest as physical memory.
• For hosts, memory refers to the machine memory, which is the physical memory in the host system.
vSphere Client Performance Charts
The vSphere Client Performance Charts enable you to view performance metrics in different types of charts, depending on the selected object and metric type, as described in Table 10-4.
Table 10-4 Performance Chart Types

Overview and advanced performance charts are available for datacenter, cluster, host, resource pool, vApp, and virtual machine objects. Overview performance charts are also available for datastores and datastore clusters. Performance charts are not available for network objects. Charts are organized into views, which you can use to see related data together on one screen. You can specify the time range or data collection interval. Advanced charts contain more information than overview charts. You can print, configure, and export (PNG, JPEG, or CSV formats) advanced charts.
Overview Performance Charts
You can use the vSphere Client to examine the overview performance charts for data centers, clusters, datastores (and datastore clusters), hosts, resource pools, vApps, and virtual machines.
To view a performance chart, you can use the following procedure
1. In the vSphere Client, select an appropriate object in the inventory pane.
2. Navigate to Monitor > Performance.
3. Select a view.
4. Select a predefined or custom time range.
Table 10-5 contains the available performance chart views by object type.
Table 10-5 Views by Object Type

Note
When Storage I/O Control is disabled, the values for the Storage I/O Normalized Latency metrics are zeros.
Advanced Performance Charts
For more granularity, you can use advanced performance charts, or create your own custom charts. Advanced performance charts are especially useful when overview performance charts do not provide sufficient data for troubleshooting a specific issue. Advanced performance charts include the following features.
• Customizable: You can change and save chart settings
• More information. You can include data counters that are not supported in other performance charts. You can hover a data point to see details at that point.
• Exportable: You can save the image to a file or spreadsheet. You can export the data to a spreadsheet.
Figure 10-1 is example advanced performance chart that includes memory metrics for a virtual machine.
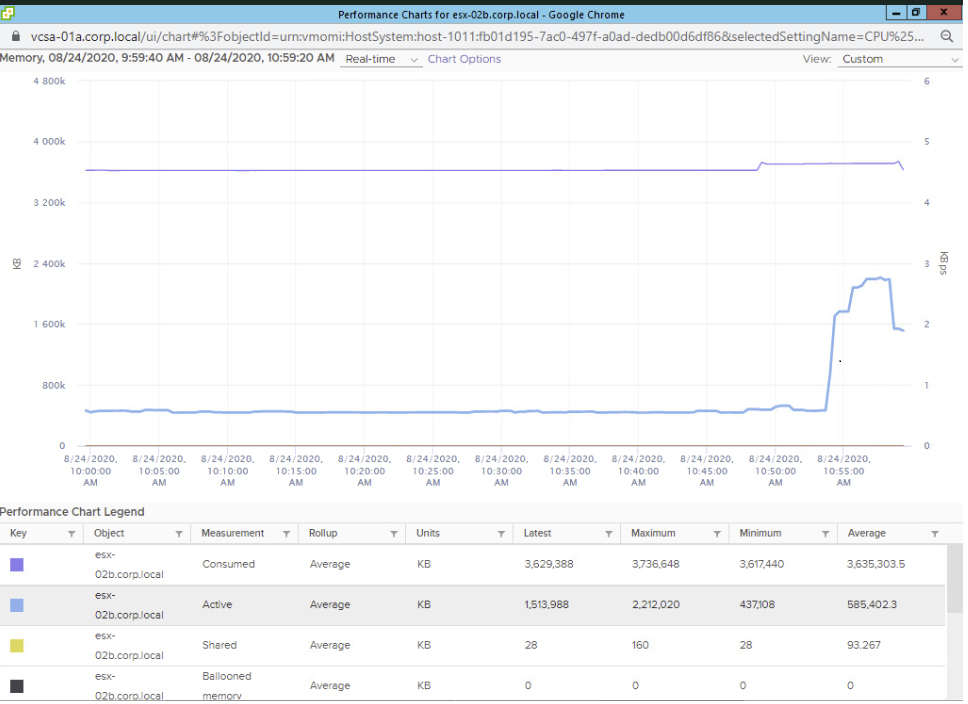
Figure 10-1 Sample Advanced Performance Chart
You can use the following procedure to access an advanced performance chart.
1. In the vSphere Client, select an appropriate object in the inventory pane.
2. Navigate to Monitor > Performance.
3. Click Advanced.
4. Optionally, select an appropriate view from View dropdown list.
5. Optionally, click the Popup Chart icon to open the chart in a separate window.
6. Click Chart Options.
7. In Chart Metrics, select an appropriate metric group.
8. Select a Timespan. If you choose Custom Interval, then select one of the following.
• Last: Specify the number of hours, days, weeks, or months.
• From: Specify beginning and ending times.
9. In Target Objects, select the appropriate inventory objects. (Optionally, use the All or None buttons)
10. Select an appropriate Chart Type.
11. In Counters, select the data counters to display in the chart. (Optionally, use the All or None buttons)
12. Optionally, click Save Options As and save your settings as a custom chart.
Note
Pop-up charts are useful for maximizing the available real estate for a chart and for comparing two separate charts side by side,
Note
For the stacked graph type, the following applies.
• You can use only one measurement unit.
• Per-virtual-machine stacked graphs are available only for hosts.
• You can click on a counter’s description name to display details, such as whether the selected metric can be stacked per virtual machine.
After creating a custom chart, the chart is added to the View dropdown list. You can now use the chart in the same manner that you would any pre-built view.
You can use the following procedure to delete a custom chart.
1. In the vSphere Client, select an appropriate object in the inventory pane.
2. Navigate to Monitor > Performance.
3. Select Advanced > Chart Options.
4. Select the chart and click Delete Options.
You can use the following procedure to save data from an advance performance chart to a file either in a graphic format or in comma-separated values (CSV) format.
1. In the vSphere Client, select an object in the inventory pane.
2. Navigate to Monitor > Performance.
3. Click Advanced.
4. Optionally, select a view, or change chart options, until you are satisfied with the chart.
5. Click the Export icon.
6. Select on of the following options.
• To PNG: Exports a bitmap image to PNG format.
• To JPEG: Exports a bitmap image to JPEG format.
• To CSV: Exports text data to CSV format.
• To SVG: Exports a vector image to SVG format.
7. Provide a file name and location.
8. Click Save.
Troubleshooting and Optimizing Performance
Table 10-6 provides the likely cause and potential solution for some example symptoms based on vSphere performance metrics.
Table 10-6 CPU Performance Analysis


Monitor and Manage Cluster Resources
On a Summary tab for a vSphere DRS cluster you can see the Capacity, Used, and Free metrics for CPU, Memory, and Storage resources in the upper right corner as shown in Figure 10-2.

Figure 10-2 DRS Cluster Resource Usage
To examine the CPU and memory usage more closely, you can navigate to Monitor > vSphere DRS and select CPU Utilization or Memory Utilization. These pages show a bar graph, where each bar represents the total resource (CPU or memory) usage of a specific host and each bar is split into sections respresenting the resource usage of individual virtual machines.Likewise you can select Monitor > vSphere DRS > Network Utilization to examine the network utilization of each host in the cluster.
The Summary tab shows the vSphere DRS Score, the number of DRS recommendations, and the number of DRS faults, as shown in Figure 10-3.

Figure 10-3 Sample DRS Score
If DRS is in manual mode, you can click on the number of DRS Reccommendations on the summary tab, which is a link that takes you to the DRS Recommendations page. On the DRS Recommendations page, you can view the current recommendations, select those that you want to apply, and click the Apply Recommedations button. Each recommendation includes a description, such as which virtual machine to migrate to which host, and a reason, such as balance average memory loads.
Optionally, you can click the Run DRS Now button to make DRS perform its analysis and potentially generate new recommendations.
Monitor and Manage Resource Pool Resources
To view resource pool configuration details, you can select a DRS cluster in the inventory pane and navigate to Hosts > Resource Pools. On that page you will see all the resource pools that are direct children of the cluster. For each pool, you will see its CPU and memory resource settings, including Reservation, Limit, Shares Setting (such as Low or Custom), Shares Value (numeric share value), and Allocation Type (Expandable or non-Expandable). You can click on the name of a resource pool, which is a link to the pool’s Summary page, which shows the current capacity, usage, and free compute resources for the resource pool. The summary page also shows the number of virtual machines, powered on virtual machines, child resource pools, and vApps in the pool.
For more detail, you can navigate to Monitor > Utilization or to Monitor > Resource Allocation and select CPU, Memory, or Storage. For both CPU and memory resources, the Utilization page shows the resource configuration, the consumed, the active, and the worst-case allocation. The Utilization page also shows a break down of Guest Memory, including metrics for Active Guest Memory, Swapped, Compressed, and Ballooned.
You can use Overview and Advanced Performance Charts with resource pools. When you see undesired behavior, you can edit the settings of an existing resource pool to change the pool’s CPU and memory shares, reservations, and limits. For example, consider a scenario where you configure two resource pools in a cluster with 100 GHz CPU capacity. In one pool with 40 virtual machines, you set CPU Shares to High. In the other pool, with 8 virtual machines, you set CPU shares to Normal. You see in the performance charts that the virtual machines in the pool with the 40 virtual machines have greater CPU Ready values than the virtual machines in the other pool. You realize that although you used higher CPU shares for the first pool, the virtual machines are experiencing more CPU contention than virtual machines in the second pool. To correct this, you could take one of the following actions.
• Increase the CPU shares on the first pool using a custom value.
• Change the CPU shares on the second pool to Low.
• Set an appropriate CPU Reservation on the first pool.
• Set an appropriate CPU Limit on the second pool.
• Change the configuration to use Scalable Shares.
Monitor and Manage Host Resources and Health
You can use the vSphere Client to monitor the state of host hardware components, such as CPUs, memory, fans, temperature, voltage, power, network, battery, storage, cable (interconnect), software components, watchdog, and PCI devices, To view the host hardware health status with the vSphere Client, you can use the following procedure.
1. In the vSphere Client, select host in the inventory pane.
2. Navigate to Monitor > Hardware Health.
3. Select the type of information to view.
• Sensors
• Storage Sensors
• Alerts and Warnings
• System Event Log
The host health monitoring tool presents data gathered using Systems Management Architecture for Server Hardware (SMASH) profiles. The information displayed depends on the sensors available on your server hardware.
Note
You can also set alarms to trigger when the host health status changes
If you participate in the Customer Experience Improvement Program (CEIP), then you can configure Skyline Health to perform online health checks. If CEIP is not enabled, then the Internet connectivity check is unavailable. You can use the following procedure to configure Skyline Health.
![]()
1. In the vSphere client, select a vCenter Server or a host in the inventory pane.
2. Select Monitor > Skyline Health.
3. Expand Online Health Connectivity category and select one of the following options.
• CEIP: Verifies CEIP is enabled for the vCenter Server
• Online health connectivity (Internet check): Verifies vCenter Server to vmware.com connectivity via HTTPS / 443
• Advisor: (Included in Production and Premier Support contracts) Provides additional features such as automatic support log bundle transfer with Log Assist.
• Audit CEIP Collected Data: Allows you to view data collected and sent for CEIP.
• Number of Online health checks performed successfully
4. Expand the following categories and examine the related health warnings
• Compute Health Checks
• Network Health Checks
• Security Health Check
• Storage Health Checks
• General Health Checks
5. Click Rest to run the health checks immediately.
6. Optionally, if issues are discovered, click the Ask VMware button to request a knowledge base article that describes the how to resolve the issue.
Monitor and Manage Virtual Machine Resources
Table 10-7 contains some of the key metrics for monitoring virtual machines
Table 10-7 Virtual Machine Metrics

Shares, Limits, Reservations
You can set the CPU and memory shares, reservation, and limit on a virtual machine using the following procedure.
1. In the vSphere Client, right-click your virtual machine in the inventory.
2. Right-click and select Edit Settings.
3. Edit the CPU Resources
4. Set the Shares, Reservation, and Limit
5. Edit the Memory Resources
6. Set the Shares, Reservation, and Limit
7. Click OK.
The relative priority represented by each share changes whenever additional, sibling virtual machine are powered on or powered off. Likewise, each share’s relative priority changes whenever the shares on siblings are increased or decreased. This affects all virtual machines in the same resource pool.
For example, consider the following scenario.
• All virtual machines have the same number of vCPUs
• Two virtual machines, each run in a resource pool with CPU Limit set to 8GHz.
• The virtual machines are CPU bound (they are demanding more CPU resources than they are receiving).
• Their CPU shares are set to Normal
• You should expect each virtual machine’s Performance Chart to show CPU Utilization is 4GHz each.
• When you power on a third CPU-bound sibling virtual machine with CPU shares value set to High, you should expect to see the new virtual machine uses 4GHz and the first two machines drop to 2GHz each.
To understand the impact of shares, consider another scenario, where a set of sibling virtual machines are frequently CPU bound and are utilizing all the resources in their parent resource pool. During these periods of CPU contention in the resource pool, you see significantly high CPU Ready Time on each of the virtual machines. You are only concerned about improving the performance of one specific virtual machine, so you increase its CPU Shares. The CPUs Ready Time for that machine should decrease during periods of CPU contention, while the CPU Ready Time of its siblings should rise.
To guarantee a specific amount of resources to always be available to a running virtual machine, even when the physical server is heavily loaded, you can set its CPU or memory reservation. The vCenter Server or ESXi host allows you to power on a virtual machine only if there are enough unreserved resources to satisfy the virtual machine’s reservation, Likewise, your attempts to increase the reservation on a running virtual machine (or a resource pool) will succeed only if there are enough unreserved resources to satisfy the request. In the previous scenario, if you want to ensure that a virtual machine always receives access to at least 1 GHz, regardless of the number or resource settings of siblings, you should set its CPU reservation to 1 GHz.
Note
The default CPU and memory reservation for a virtual machine is zero, meaning that its guest OS is not guaranteed to any specific amount of either resource. Instead, with default settings, shares would be applied during periods of compute resource contention.
You can set limits for CPU, memory, and storage I/O for a virtual machine to establish an upper bound (maximum) amount of resources that can be allocated to the virtual machine. The host never allocates more than the limit, even when there are unused resources on the system. By default, the limits are set to unlimited, which means the virtual machine’s configured memory becomes its effective limit. Using limits has the following benefits and drawbacks.
• Benefits: If you are concerned that the performance of a virtual machine may deteriorate as you add virtual machines to the cluster, you could set limits on the virtual machine to simulate having fewer available resources and measure its performance.
• Drawbacks: You may be wasting idle resources because the system prevents virtual machines from exceeding the limits that you set, even when the system is underutilized, and idle resources are available.
Note
If you want to reduce the risk that a virtual machine may consume excessive resources and impact the performance of other virtual machines, you can consider setting low shares on the virtual machine. Low shares decrease the virtual machine’s access to the resource during periods of resource contention, while never preventing the virtual machine from using idle resources.
Admission Control
When you power on a virtual machine, the system checks the amount available unreserved CPU and memory resources. It determines whether it can guarantee the reservation for the virtual machine. This process is called admission control. If enough unreserved CPU and memory are available (or if there is no reservation), the virtual machine is powered on. Otherwise, an Insufficient Resources warning appears.
Note
Each virtual machine, including those with no user-specified memory reservation, may have some reservation for its memory overhead. The memory overhead reservation is considered by admission control.
Note
When the vSphere DPM feature is enabled and some hosts are in standby mode, their unreserved resources are considered available for admission control. If a virtual machine cannot be powered on without these resources, vSphere DPM makes a recommendation to power on one or more standby hosts.
VMware Tools and Microsoft Windows Perfmon
When VMware Tools is installed, VMware provides performance counters that enable you to view data withing Windows guest OS using the Microsoft Windows Perfmon utility. VMware provides virtual machine-specific performance counter libraries for the Windows Perfmon utility, which enables administrators to accurately examine virtual machine usage data and guest OS usage data within the same pane of glass.
For a Windows virtual machine, where VMware Tools is installed, you can use the following procedure to examine VMware specific statistics in the Windows Perfmon utility.
1. Logon to Windows and click Start > Run
2. Enter Perfmon and press Enter.
3. In the Performance dialog box, click Add.
4. In the Add Counters dialog box, select Use local computer counters.
5. Select a performance object, whose name begins with VM (a virtual machine performance object)
6. Select the counters that you want to display for that object.
7. If the performance object has multiple instances, select the instances you want to display.
8. Click Add.
9. Examine the data for the selected performance object.
10. Click Close
Latency Sensitivity
If you have a latency sensitive application, such as Voice Over IP (VOIP) or a media player application, you can edit the virtual machine’s settings and to set VM Options > Latency Sensitivity to High. With this setting, you should ensure that all the virtual machine’s configured CPU and memory are reserved. With this setting, the system effectively gives exclusive physical CPU access to each virtual CPU. If the virtual machine is in a DRS cluster, DRS will automatically create a VM-Host soft affinity rule.
Impact of Virtual Machine Configurations
![]()
The specific settings you make for a virtual machine can impact its performance, as summarized in Table 10-8.
Table 10-8 Impact of Virtual Machine Configurations

Other Virtual Machine Resource Management Features
You can configure virtual machines to support SRIOV, VGPU, RDMA, and Configure VMs to Support DirectPath I/O Passthrough as discussed in Chapter 14.
ESXTOP
ESXTOP is a utility that provides a real time, detailed look at resource usage from the ESXi Shell. You can run ESXTOP in interactive, batch, or replay mode. You must have root user privileges. RESXTOP is a similar tool that can be installed and run from a Linux server and connected to ESXi hosts.
By default, when you issue the command esxtop, the utility opens in interactive mode to show the CPU panel, where statistics for each virtual machine and other groups are displayed in separate rows. To see just virtual machines statistics, you can press the shift-V (capital V) key. Each column provides CPU statistics, such as %USED, %WAIT, %RDY, %CSTP, and %SWPWT. To see statistics for the multiple worlds that comprise a virtual machine, you can press the E key and enter the virtual machine’s ID. Figure 10-4 shows an example of an ESXTOP CPU panel, displaying only virtual machines statistics with one virtual machine (GID 33791) expanded.

Figure 10-4 Sample ESXTOP CPU Panel
You can change the view from the CPU panel to other panels using keystrokes. For example, you can press the M key for the memory panel, the V key for the virtual machine storage panel, or the N key for the network panel. Table 10-9 contains a description of some of the key statistics available for each panel.
Table 10-9 Key ESXTOP Panels and Metrics

Note
The network panel contain a row for each NIC in a virtual machine, rather than row for each virtual machine. The E and shift-V keystrokes are not applicable to the network panel.
You can use the -b argument to run ESXTOP in a batch mode, where you collect statistics in a CSV file, which you can later manipulate with other tools, such as Microsoft Perfmon or Excel. For example, you can use the following command to collect statistics in a file named mydata.csv.
esxtop -b > mydata.csv
You can use ESXTOP in replay mode, where it uses pre-collected data rather then real time data. To collect the data, you should run vm-support in snapshot mode, specifying the data collection interval and duration (in seconds), as shown in the following example.
vm-support -S -d 3600 -I 5
After collecting the data, you must unpack and decompress the resulting tar file. Then, you can run ESXTOP in replay mode, providing the path to the data file, as shown here.
esxtop-Rvm-support_dir_path
VIMTOP
VIMTOP is a tool you can run in the vCenter Server appliance to see resource usage for services running in the appliance. It is like ESXTOP, but displays services, such as vCenter Server, Certificate Manager, vPostgres, and ESXi Agent Manager, rather than virtual machines and ESXi worlds. You can use VIMTOP to identify which service is using the most compute, disk, or network resources whenever vCenter Server is running poorly.
vCenter Server Management Interface
In the vCenter Server Management Interface (VAMI) you select Monitor to view the resource usage of the vCenter Server. To see compute usage graphs, select Monitor > CPU and Memory. To see the usage of each storage partition, select Monitor > Disks. To use a graph where you can select and view specific network metrics, select Monitor > Network.
You can navigate to Monitor > Database to view the database utilization of alarms, events, tasks, and statistics. Here, you can also view the overall space utilization of the database and database log.
Events, Alarms, and Automated Actions
A configurable events and alarms subsystem exists in vSphere that tracks events throughout vSphere and stores the data in log files and in the vCenter Server database. It enables you to specify the conditions under which alarms are triggered. Alarms can change state from normal (green) to warning (yellow) to alert (red) depending on changing conditions. Triggered alarms can automatically launch alarm actions.
Events
Events are simply recorded incidents (something that occurred), such as user actions or system actions, that occurred involving a host or any object managed by vCenter Server. The following list includes a few examples.
• A license key expires
• A virtual machine is migrated
• A virtual machine is powered on
• A host connection is lost
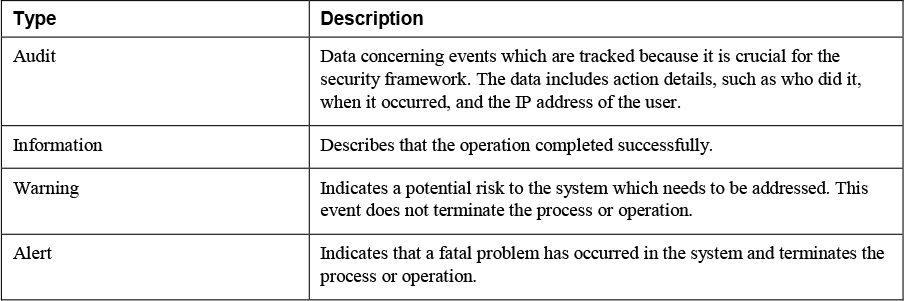
Event data includes details such as who generated it, when it occurred, and what type of event it is. Table 10-10 describes the types of events
Table 10-10 Event Types
View Events in the vSphere Client
You can use the following procedure to view events in the vSphere Client
1. In the vSphere Client. Select an object in the inventory pane.
2. Navigate to Monitor > Events.
3. Select an event to see the details.
4. Use the column headings to sort the events, show columns, hide columns, and filter the events.
View the System Event Log
To view the system events, which are recorded in the vCenter Server database, you can use the following procedure.
1. Logon to the vSphere Client as a user with the Global.Diagnostics privilege.
2. Select the vCenter Server in the inventory pane.
3. Click Monitor, and click Hardware Health.
4. Click System Event Log.
5. Optionally, you can click Export.
Stream Events to a Remote Syslog Server
You can enable remote streaming, such that the vCenter Server will stream newly generated events to a remote syslog server. In the syslog server, the events have the following format.
<syslog-prefix> : Event [eventId] [partInfo] [createdTime] [eventType] [severity] [user] [target] [chainId] [desc]
Messages that are longer than 1024 characters split into multiple syslog messages.
Note
In an environment with no more than 30 hosts, you can configure hosts to send log files to a vCenter Server rather than storing them to a local disk. This feature is intended for smaller environments with stateless ESXi hosts. For all other cases, VMware recommends that you use a dedicated log server.
As an alternative to streaming events, you can forward events. When you forward events, the events are sent to a remote server rather than recorded.
You can use the following procedure to forward vCenter Server logs to a remote syslog server.
1. Logon to the vCenter Server Management Interface (VAMI) as root.
2. Select Syslog.
3. In the Forwarding Configuration section, click Configure.
4. In the Create Forwarding Configuration pane, enter the server address of the destination host. The maximum number of supported destination hosts is three.
5. Select a Protocol (TLS, TCP, RELP, or UDP) to use.
6. Provide a Port number
7. Optionally, add more destination servers
8. Click Save.
9. Optionally, click Send Test Message.
You can configure the writing of events to the vCenter Server streaming facility. Streaming events is disabled by default. You can use the following procedure to stream events to a remote syslog server.
1. In the vSphere Client, select the vCenter Server in the inventory pane.
2. Navigate to Configure > Settings > Advanced Settings.
3. Click Edit.
4. Enable the vpxd.event.syslog option.
Alarms
Alarms are notifications that are activated in response to an event, a set of conditions, or the state of an inventory object. Table 10-11 contains the elements that are used in an alarm definition
Table 10-11 Alarm Definition Elements

For example, you might want to monitor the memory usage of all virtual machines in a specific vSphere cluster. In the vSphere Client, you can select the cluster in the inventory, create an alarm for the cluster, set the alarm’s Targets to virtual machine, and configure rules with triggers base on memory usage.
Note
You can enable, disable, and modify alarms only from the object at which the alarm is defined. For example, if you defined a virtual machine memory alarm on a cluster, you cannot change the alarm at the individual virtual machine level.
View and Acknowledge Triggered Alarms
To view triggered alarm, you can use the following procedure.
1. In the vSphere Client, select an object in the inventory pane
2. Navigate to Monitor > Issues and Alarms.
3. Click Triggered Alarms.
4. Optionally, select an alarm and click Acknowledge
You can acknowledge an alarm to let other users know that you are taking ownership of the issue and to prevent the alarm from sending more email messages. The alarm, however, is still visible in the system.
Note
After you acknowledge an alarm in the vSphere Client, its alarm actions are discontinued. Alarms are not cleared or reset when acknowledged.
To clear an alarm (reset its state to normal), you need the Alarm.Set Alarm Status privilege. You can select a triggered alarm and choose Reset to green.
Create Alarm Definitions
To create or configure an alarm, you must use a user account with the Alarms.Create alarm or Alarms.Modify alarm privilege. To create an alarm, you can use the following procedure.
1. In the vSphere client, select an object in the inventory pane.
2. Navigate to Configure > More > Alarm Definitions.
3. Click Add
4. Provide the Name, Description, Target Type, and Target.
5. Click Next.
6. Create an Alarm Rule, by specifying the following for each rule.
• Conditions: Trigger, Arguments, Operator, Threshold
• Severity
• Actions: Send email notifications, Send SNMP traps, Run Script
7. Optionally click Add Another Rule, Duplicate Rule, or Remove Rule
8. Click Next.
9. Specify Alarm Reset Rules by enabling the Reset the alarm to green option and providing details, such as arguments, operators, and actions.
10. Click Next
11. Click Enable this Alarm
Alarm Actions
Alarm actions are operations that are automatically triggered by alarms. Table 10-12 provides details on available alarm actions.
Table 10-12 Alarm Actions

Advanced Use Cases for Alarms
You can create custom alerts with notifications for many purposes, such as the following
• Something failed or disconnected (such as host connection failure or VASA provider disconnected).
• Something is not performing well (such as excessive CPU Ready Time, Memory Swapping, disk latency, or packets dropped).
• Poor health (such as vSAN Health, Key Management Server Health, vCenter HA Cluster Health).
Logging in vSphere
This is chapter is intended to ensure that you understand logging in vSphere components and related products and that you are prepared to implement logging.
ESXi Logs
Table 10-13 contains details on most of the ESXi log files, including the location and purpose of each. You should get familiar with each of these and learn which logs are useful for various troubleshooting scenarios. For example, when troubleshooting virtual machine issues, the only directly useful logs are vmkernel, vmkwarning, hostd, and the specific virtual machine’s log files. When troubleshooting issues related to the connection between and ESXi host and the vCenter Server, the vpxa log is most useful.
Table 10-13 ESXi Log Files

You can use the ESXi Host Client to examine the logs on a specific ESXi host by navigating to Monitor > Logs and selecting a specific log file. You can scroll through the log and search for specific text. You can select a log, click Actions, and choose Open the in new window or Generate a support bundle.
Likewise, you can use the ESXi Direct Console User Interface (DCUI) to view System Logs. In the DCUI, select View System Logs. and select the log you want. You can use the Enter key (or space bar) to scroll through the log messages and press the forward slash (/) key to begin a search.
If you have the Global.Diagnostics privilege, then you can also use vSphere Client to export a host’s system logs, by applying the following procedure.
1. In the vSphere Client, right-click an ESXi in the inventory pane.
2. Click Export System Logs.
3. Select the appropriate objects
4. Optionally select Gather performance data.
5. Optionally, provide a Password for encrypted core dumps
6. Click Export Logs
7. Monitor the status of the Downloading log bundles task in the Recent Tasks pane.
8. When completed, the file is located in the default location. On a Windows desktop, the location is the Downloads folder and the file name begins with VMware-vCenter-support.
Note
In Step 3, you can select or deselect entire categories, such as System, Virtual Machines, and Storage. You can also select or deselect specific objects within each category, such as logs and CoreDumps.
You can collect ESXi log files using the /usr/bin/vm-support command, which generates a file named in the following format.
esx-date-unique-xnumber.tgzvCenter Server Logs
The main logs in a vCenter Server appliance are located at /var/log/vmware. The most important logs are in the vpxd subdirectory. Some other sibling subdirectories include vsan-health, vsphere-ui, and vpostgres.
Upload System Logs to VMware
To export system logs from the vCenter Server and all its hosts, you can use the previous procedure, but begin by selecting the vCenter Server instead of a specific host. In the wizard, you can select which hosts to include and you can optionally select Include vCenter Serer and vSphere UI Client logs.
You can export a vCenter Server instance’s support bundle using the URL displayed on the DCUI home screen (https://FQDN:443/appliance/support-bundle).
Alternatively, you can run the vc-support.sh script in the vCenter Server appliance Bash shell to collect the support bundle.
You can directly upload a log package to an open VMware Service Request, using the following procedure.
1. In the vSphere Client, navigate to Administration > Support
2. Click Upload File to Service Request.
3. Provide a Service Request ID.
4. Click Choose File, select the appropriate log bundle, and click OK.
Log Levels
The default log level setting is Info, where errors, warnings, and informational level are logged. You can change the log level to lower levels, such as Verbose, which is useful for troubleshooting and debugging, but not recommended for normal use in production environments. You can use the vSphere Client to change the logging level by selecting the vCenter Server, selecting Configure > Settings > General > Edit and setting the Logging Settings to the appropriate level, as described in Table 10-14.
Table 10-14 vCenter Server Logging Options

Although, setting the logging level to verbose or trivia may be beneficial for troubleshooting, doing so for long durations could cause noticeable vCenter Server performance degradation. VMware recommends that you use these levels in rare cases, while actively troubleshooting, and that you reset the logging level immediately afterwards. Changes to the logging level are persisted in the vCenter Server configuration file /etc/vmware-vpx/vpxd.cfg. You can make additional changes to logging behavior by editing the Advanced Settings of a vCenter Server. For example, you can use the vSphere Client to edit the following settings, which impact log size, retention, rotation, and compression.
• config.log.level
• config.log.maxFileNum
• config.log.maxFileSize
• config.log.compressOnRoll
Note
By default, vCenter Server vpxd log files are rolled up and compressed into .gz files. You can turn off compression for vpxd log files, by adding the log.compressOnRoll key with the value false to the vCenter Server Advanced Settings.
Configure Syslog on ESXi Hosts
You can use the following procedure to configure the syslog service for a host.
1. In the vSphere Client, select a host in the inventory pane.
2. Navigate to Configure > System > Advanced System Settings.
3. Click Edit.
4. Filter for syslog.
5. To set up logging globally for the following options, select the option and enter the value.
• Syslog.global.defaultRotate: Maximum number of logs to keep when rotating logs.
• Syslog.global.defaultSize: Size (KB) of log, before triggering a log rotation.
• Syslog.global.LogDir: Directory in a VMFS or NFS datastore to store logs specified in the format [datastore] /path. For example, to store logs in the /vmfs/volumes/VMFS-01/systemlogs folder, specify [VMFS-01] /systemlogs
• Syslog.global.logDirUnique: Enabling this option creates a subdirectory for the host at the specified path, which is useful when more than one hosts uses the same shared datastore for logging.
• Syslog.global.LogHost: Remote syslog host and port to which message are forwarded. For example, to forward to a server named syslogsvr-1 using port 1514, specify ssl://syslogsvr-1:1514.
6. Optionally, select specific log names and change the number of rotations and log size for just that specific log.
7. Click OK.
You can control how log files are maintained for virtual machines. A new log file is created each time you power on or resume a virtual machine, or whenever the file size exceeds the vmx.log.rotateSize value, unless the value is 0 (default). VMware recommends saving 10-log files, each one limited to no less than 2MB. If you need logs for a longer time span, you can set vmx.log.keepOld to 20.
You can use the following procedure to change the number of log files for a single virtual machine.
1. In the vSphere Client, select a host or a virtual machine in the inventory pane.
2. Right-click the virtual machine and click Edit Settings.
3. Select VM Options > Advanced
4. Click Edit Configuration.
5. Add or edit the vmx.log.keepOld parameter to the appropriate number.
6. Click OK.
Note
To set this value for all virtual machines on a specific host, edit the /etc/vmware/config file and add or edit a line like the following.
vmx.log.keepOld = “10”
You can modify the /etc/vmware/logfilters file on a host to change its logging behavior. In this file you can add an entry specifying the following options.
• numLogs: The maximum number of log entries before the specified log messages are filtered and ignored. Use 0 to filter and ignore all the specified log messages.
• Ident: Specifies one or more system components to apply the filter.
• logRegexp: Specifies a case-sensitive phrase to filter the log messages by their content.
• Add the following line to the /etc/vmsyslog.conf file: enable_logfilters = true
• Run the =command, esxcli system syslog reload
Log Insight
To collect and analyze vSphere data using vRealize Log Insight (vRLI), you first must deploy vRLI, then you can follow this procedure.
1. In the vRLI web interface, navigate to the Administration tab.
2. Click Integration, > vSphere.
3. Provide hostname and credentials to connect to a vCenter Server.
4. Click Test Connection.
5. If you use an untrusted SSL certificate, click Accept in the dialog.
6. Click Save.
7. Use the vRLI web interface to configure the data collection from vCenter.
Exam Preparation Tasks
As mentioned in the section “How to Use This Book” in the Introduction, you have a couple of choices for exam preparation: the exercises here, Chapter 15, “Final Preparation,” and the exam simulation questions on the CD-ROM.
Review All Key Topics
Review the most important topics in this chapter, noted with the Key Topics icon in the outer margin of the page. Table 10-15 lists a reference of these key topics and the page numbers on which each is found.
Table 10-15 Key Topics for Chapter 10

Complete the Tables and Lists from Memory
Print a copy of Appendix B, “Memory Tables,” (found on the CD), or at least the section for this chapter, and complete the tables and lists from memory. Appendix C, “Memory Tables Answer Key,” also on the CD, includes completed tables and lists to check your work.
Define Key Terms
Define the following key terms from this chapter and check your answers in the glossary:
Review Questions
1. You are creating a resource pool in vSphere DRS cluster. Which of the following is a default setting?
a. The Memory Limit is disabled.
b. The CPU Shares are 0
c. The Memory Reservation is 0
d. The CPU Reservation is normal.
2. You want to configure Predictive DRS in your vSphere Cluster. Which of the following is a requirement?
a. Set DRS to Fully Automated
b. In the cluster, set Provide data to vSphere Predictive DRS to True.
c. In the vRealize Operations, set Provide data to vSphere Predictive DRS to True.
d. In the vRealize Automation, set Provide data to vSphere Predictive DRS to True.
3. You are configuring a vSphere HA cluster and do now want it to automatically reserve resources for failure. What setting should you use?
a. Set Cluster Resource Percentage to 0.
b. Set Cluster Resource Percentage to 100.
c. Set Define host failover capacity to Dedicated Host Failures
d. Set Define host failover capacity to Disabled
4. You want to use a command line tool that shows real time CPU statistics for the services running in the vCenter Server. Which should you choose?
a. vimtop
b. esxtop
c. Performance Charts
d. vCenter Server Management Interface
5. You are examining vSphere logs. Which of the following logs are in the same folder as the virtual machine configuration file?
a. vpxa.log
b. vmksummary.log
c. auth.log
d. vmware.log