Chapter 10
Monitoring and Capacity Planning
Monitoring the VMware vSphere environment and anticipating future growth via capacity planning are integral parts of a good vSphere design. Although related, monitoring and capacity planning aren't the same. Monitoring is more about the present or the recent past, whereas capacity planning is about the future.
This chapter will cover the following topics:
- The importance of monitoring and capacity planning
- Selecting monitoring and capacity-planning tools
- Incorporating monitoring into your design
- Different aspects of monitoring and capacity planning
- Building capacity planning into your design
Nothing Is Static
The best VMware vSphere designs are capable of changing, growing, and evolving. Just as the needs of the business that is implementing VMware vSphere in its environment will change, grow, and evolve over time, the vSphere design must be able to do the same thing. As the organization increases in size, the vSphere environment must also be able to increase in size. As the organization brings on new types of workloads, the environment must be able to handle, or adapt to handling, these new types of workloads. The design can't remain static. This ability to be flexible and scalable on demand is what experts refer to as elasticity. This is one popular entry point for a cloud solution discussion because Infrastructure as a Service (IaaS) or Platform as a Service (PaaS) resources are immediately available to accommodate both trending growth and immediate spikes in infrastructure utilization while sparing some of the costs of ownership that go along with infrastructure growth without compromising on critical points such as security.
The challenge for a vSphere architect, then (and we use the term architect here to mean anyone who designs vSphere environments), is to build environments that can grow and adapt. What does this mean, exactly? Specifically, a design that is capable of growing and adapting has the following qualities:
- The design should be flexible—it should accommodate both the addition as well as the removal of resources. There must be a framework present in the design whereby administrators can add servers, storage, or networking to or remove them from the design without having to redo the entire design.
- The design should be instrumented—it should incorporate monitoring as an integral component, providing the organization implementing the design with a means to know about the current utilization and behavior of the components within the design. Without instrumentation, it's impossible to know if resources must be added to or removed from the design.
Throughout this book so far, we've attempted to show you how to accomplish the first item in this list how to build frameworks into your design so you can add or remove resources in a way that doesn't compromise the overall design.
This chapter is primarily focused on the second item instrumentation. Specifically, this chapter discusses how and why architects should incorporate monitoring and capacity planning into VMware vSphere designs. Monitoring and capacity planning are the two sides of the instrumentation coin one side tells you what's happening in your environment right now, and the other side tells you what will happen in your environment in the future.
Let's start by looking at how and why you should incorporate monitoring into your designs.
Building Monitoring into the Design
Designing a VMware vSphere environment that lacks sufficient monitoring is like designing a car without an instrument panel—there is no information available to operate it! Hence, our use of the term instrumentation. It enables operators of the vSphere environment you've designed to run it, to know what it's doing, and to be aware of the behaviors and limitations of the components that make up the design. Just as the various instruments in a car notify the operator of what's happening in the various systems that form an automobile, the monitoring that you incorporate into your vSphere design will notify the operator of how the various systems that form your design—compute, memory, storage, networking, security—are behaving and operating. This information makes it possible for the operator to use the flexibility you designed into the environment to add resources, remove resources, or reassign resources as needed.
Like so many other aspects of design, incorporating monitoring into a VMware vSphere design means answering a number of questions:
- What monitoring tools will the design use?
- What items are monitored?
- What values, or thresholds, will represent abnormal operation? What thresholds will represent normal operation? In other words, how do the operators determine if something is wrong with the design?
- What will the environment do, if anything, when an abnormal threshold is detected?
- Will the monitoring tools alert the operators? If so, how? Using what mechanisms?
The following sections address each of these questions.
Determining the Tools to Use
Like so many other areas of vSphere design, the first two questions are somewhat interrelated the choice of tools can affect what items can be monitored, and the items that must or should be monitored can sometimes determine what tools need to be used.
For the purposes of this chapter, we'll group monitoring tools into three categories:
- Built-in tools that are supplied with VMware vSphere as part of the typical installation
- VMware vSphere tools integrated outside of a typical installation
- Third-party tools written by independent software vendors (ISVs)
Among these three categories, your job as a VMware architect or lead designer is to select the right tools or combination of tools that will meet the organization's functional requirements with regard to monitoring. You may end up using only built-in tools, if those meet the requirements. Alternately, you may end up with a mix of tools from all three categories in order to satisfy the requirements for the design.
Let's take a closer look at some of the tools that fall into these categories.
Using Built-in Tools
VMware vSphere offers a number of tools that are built into, or provided as part of, the standard product suite. Depending on the size of the intended VMware vSphere environment and the monitoring needs of the organization, it's entirely possible that the built-in tools will be sufficient.
What are some of these built-in monitoring tools? A few of them are described next:
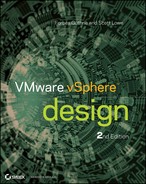
Figure 10.1 vCenter Server's alarms functionality can alert on many different conditions in the virtualized environment.
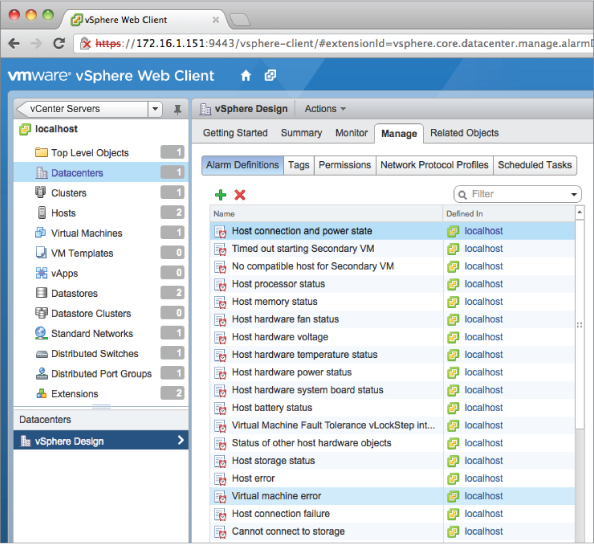
Figure 10.2 vCenter Server offers both standard and custom performance charts to provide the specific information administrators need to see.
VMware provides other tools that can provide insight into the operation of a VMware vSphere environment, but we wouldn't necessarily classify them as monitoring tools. They include tools like esxtop and resxtop, both of which provide useful and detailed information about the operation and behavior of specific VMware ESXi hosts. But neither of these utilities was designed as a long-term monitoring solution. vCenter's alarms and performance charts can not only present near real-time information, but also operate in a longer-term arrangement to provide current as well as past information. There is also a measure of consistency in reporting and monitoring across environments in an organization when using vSphere's native tools; this consistency can be helpful in baselining and trending.
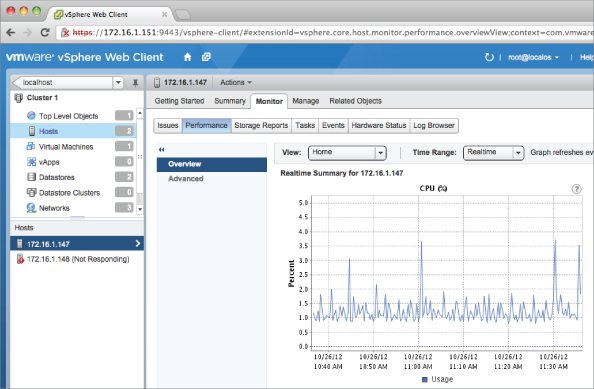
Figure 10.3 VMware Tools adds VMware-specific performance objects and counters to virtualized Windows Server instances.
The decision whether to use the built-in tools boils down to whether they meet the functional requirements of your organization. Further, because these tools are supplied in the standard environment, the question is most often not whether the tools will be used, but whether the tools will be used alone.
The answer to this question lies in the organization's functional requirements. The vCenter Server alarms, for example, only work within the framework of vCenter Server and are therefore bound to the same integration mechanisms as the rest of vCenter Server. Does your organization need more than the ability to send an email message, throw an SNMP trap, or run a script or an application if an alarm occurs? If so, then using vCenter's alarms alone may not meet your functional requirements. Does your organization need more detailed performance information than the vCenter Server or Windows Performance Monitor can provide? If so, then you may need to employ other tools in addition to or even instead of the built-in tools.
In cases like this—where the built-in tools don't meet the functional requirements for monitoring—VMware offers some additional tools that may help.
Using Additional VMware Tools
As the vSphere product line has matured, VMware has also added more products, especially management products. Some of these management products may find a way into your VMware vSphere design where warranted by your organization's monitoring needs. Several of these management products provide monitoring functionality in some form or fashion; one example is VMware vCenter Operations Manager, more commonly known just as vCenter Operations (see Figure 10.4).
Figure 10.4 vCenter Operations provides both high-level monitoring functionality and the ability to drill down into specific areas for more information.
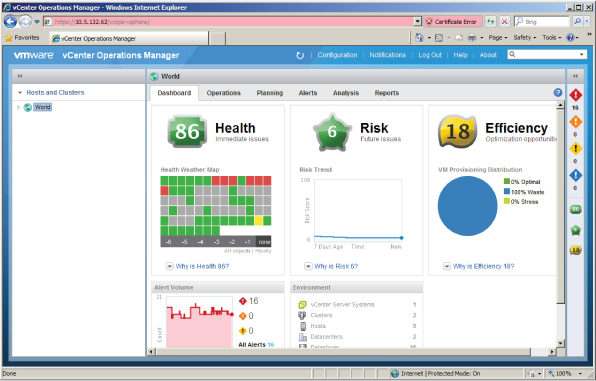
vCenter Operations (often referred to as vC Ops, or vCOps) came out of VMware's acquisition of a company called Integrien, and it's considered by many to be the centerpiece of VMware's management and monitoring strategy. vCenter Operations gathers key metrics from objects at all levels of the vSphere environment. For example, vCenter Operations may collect metrics from VMs, vCenter Server, ESXi hosts, clusters of ESXi hosts, and datastores. Using all these metrics, vCenter Operations then performs analysis to provide the following:
- Scores for health, efficiency, and capacity risk
- The range of normal behavior for all metrics, so it can highlight abnormalities in the metrics over time
- Graphical representations of the current and historical states of the vSphere environment (or portions of the environment)
The ability for vCenter Operations to establish the normal range of metrics is an important part of the product's functionality. Using this understanding of what is normal for a given metric, vCenter Operations can establish dynamic thresholds that change over time. Consider an environment in which disk I/O is high every week because of data being dumped from a particular application. vCenter Operations can learn that this is normal behavior and then alert you via dynamic thresholds only when disk I/O is abnormal during that time period. In contrast, vCenter Server itself only supports hard thresholds, which simply alert any time a metric exceeds a specified value (even if the utilization of that metric is expected and normal).
In addition to vCenter Operations, VMware offers a couple of other applications that you may also need to incorporate into your design, based on the monitoring requirements that have been specified:
- VMware vFabric Hyperic for application management of web and custom applications
- VMware vCenter Infrastructure Navigator for application-level discovery and dependency mapping
In continuing to evaluate which tools to use in monitoring your VMware vSphere environment, if neither the built-in tools nor additional tools from VMware provided the necessary functionality to meet the organization's requirements, you must incorporate third-party tools into the design.
Using Third-Party Tools
In addition to the tools supplied with the VMware vSphere suite and the other VMware products, a number of third-party tools have been created by a variety of ISVs. These products vary widely in functionality, complexity, and cost, and architects designing VMware vSphere environments should carefully evaluate these products to find the one that most closely matches the needs of the environment.
A few third-party monitoring tools include the following:
- Zenoss (www.zenoss.com) is an open source monitoring solution that claims to offer agentless visibility into both physical and virtual environments.
- Dell, through its acquisition of Quest (www.quest.com), offers a number of management and monitoring solutions. In the virtualization space, Quest vFoglight claims to offer virtual infrastructure monitoring and VMware ESX(i) management in a single product. Prior to the Dell acquisition, Quest had purchased a company called VKernel that offered some monitoring solutions; that product is now called vOPS Server.
- Veeam (www.veeam.com) offers several virtualization-focused products, including Veeam ONE. Veeam ONE provides monitoring and reporting functionality.
- eG Innovations (www.eginnovations.com) provides an agent-based monitoring solution that supports multiple virtualization platforms as well as a number of specific applications.
- PHD Virtual (www.phdvirtual.com) has a solution, PHD Virtual Monitor for VMware vSphere, that is agentless and uses the vSphere API to gather metrics.
- Xangati's StormTracker (www.xangati.com) offers dynamic thresholds and the ability to review the state of the environment at any point in time.
Incorporate tools such as these into your designs on an as-needed basis to meet the functional requirements of your organization. The features and functions of these products vary widely from product to product, as do the system requirements to run the products. Be sure to perform the necessary testing to ensure that the products work in your environment and that you have a solid understanding of the resource requirements before folding a third-party solution into your design.
Your testing should include more than functional testing, though. When you're testing third-party tools for inclusion in your environment, we recommend that you include scaling and integration testing. You'll want to be sure the tool you're considering scales properly with your environment. As the environment grows, will the tool continue to perform consistently and acceptably? Does the tool hit a performance ceiling before the environment scales to its anticipated limits? Integration is another important point. Will you be able to extract data from the tool for use elsewhere? That may be necessary in some environments, and the use of proprietary database engines can limit integration into existing environments.
Licensing is another area to evaluate carefully. Some tools are licensed on a per-socket basis, and other tools are licensed on a per-VM basis. Will the costs of the tool fall within acceptable limits as your environment grows? Or will spiraling licensing costs make you unable to keep the tool as your environment scales?
When you've determined what tools to use, you're ready to proceed with selecting what items those tools will monitor.
Selecting the Items to Monitor
As we mentioned earlier, sometimes the choice of what items to monitor will affect the tools that should be used to monitor those items. Because of this fact, you'll need to have a reasonably solid idea of what items you want to monitor in your design as you evaluate tools and products to incorporate into the design.
Just as the list of third-party tools is far too long to try to include each and every product, providing a list of things you should monitor in your VMware vSphere environment probably isn't possible. There are simply too many things, and the list of items you need to monitor is heavily influenced by your organization, functional requirements, business needs, and other factors.
Common things that you may want to monitor include the following:
- Storage performance, typically monitored by watching the latency in milliseconds (ms) of transactions or storage operations
- Storage capacity, as in the number of terabytes (TB) available on the storage platform(s)
- Storage overallocation, if you're using thin provisioning at either the vSphere layer or in the storage array itself
- Storage utilization, defined as a comparison of the total storage available and the amount of storage actually being used
- CPU utilization on both VMware ESXi hosts as well as within virtualized guest OS instances
- RAM utilization on both the VMware ESXi hosts as well as in the virtualized guest OS instances
- Memory overcommitment, to ensure that excess memory pressure doesn't significantly impact performance in a negative fashion
- Network utilization, which lets you see how much network bandwidth is actually being used
- VM availability, which monitors for the availability of individual VMs
- Host availability, checking to ensure that VMware ESXi hosts are up and running and accessible across the network
- Storage availability, monitoring whether the storage is accessible and responsive to I/O requests from hosts and guests
- Application availability, to ensure that applications in guest OS instances are running and responding to requests in an appropriate manner
This is just a sample list; your final design should specify a much more comprehensive list of the items you'll monitor. One way to approach this may be creating a list of questions about the environment and then ensuring that the correct items are being monitored to answer those questions. For example, consider the question “How many terabytes of storage are available for use?” By monitoring storage capacity, either at the array level or the hypervisor level or both, you can be sure that the information to answer that question is available to the operators of the virtualization environment.
Earlier in this section and in this chapter, we've mentioned the close relationship between the items to be monitored and selecting the tools you use to monitor. These two items often influence one another. Consider this example your design requires application-level awareness, such as the ability to verify the availability of specific services in a guest OS instance. What tools are most appropriate?
In this case, the built-in tools are insufficient. They lack application-level awareness and the ability to monitor individual processes within VMs. For this reason, you probably need to select an agent-based third-party tool. With an agent installed in the guest OS instance, the monitoring solution gains more application-level awareness and knowledge and can monitor for specific service availability.
Selecting the items to monitor must also extend beyond the virtualization environment. As a core technology in your datacenter, virtualization will touch many other areas, as you've seen throughout this book so far. Your VMware vSphere design should also specify the items that need to be monitored in other areas of the infrastructure. Some examples may include the following:
- Storage-capacity and storage-performance monitoring, taken from the array using tools provided by the storage vendor (these metrics may provide additional insight at a deeper level than would be available from the virtualization layer)
- Network utilization or network errors, taken from the networking equipment that sits upstream of the virtualization environment
- Hardware-related errors reported via hardware agents or via Common Information Model (CIM) to a centralized server management console (these may also be reported up through vCenter Server, but with less detail)
- Application-level errors or reports that are specific to the particular applications running in the guest OS instances on the VMware vSphere environment (for example, performance reports taken from a database)
Failure to properly define how all these metrics will be monitored means you've potentially omitted a source of data that could provide ongoing feedback about the health and performance of your VMware vSphere environment. This is why it's important to be as thorough and detailed as possible when defining the items and metrics that are included in the design for monitoring.
After you've selected the items to monitor, you'll need to determine the thresholds for those items.
Selecting Thresholds
A monitoring threshold determines a behavior or operation that is considered normal or abnormal. Because every design and every implementation is slightly different, it's not practical for us to provide a comprehensive list of thresholds and items. These need to be determined on a per-project basis.
Let's look at an example. In the early phases of virtualization adoption, customers were virtualizing low-level workloads that had very low CPU utilization. These included things like Active Directory domain controllers, web servers, DHCP or DNS servers, and similar workloads. It was easy to stack lots of these workloads together and achieve high consolidation ratios while still seeing host CPU utilization less than 50–60%. As a result, many organizations tuned their thresholds so that high host CPU utilization, in excess of 80%, would result in an alarm. Why? Simple because these CPU values were uncommon given the workloads running on the virtualized infrastructure.
As virtualization has matured, however, customers are now virtualizing more substantial workloads, and these more substantial workloads—which include applications like Microsoft SQL Server, Microsoft Exchange, SAP, and others—naturally generate higher CPU loads. Consolidation ratios are lower with these types of workloads, and overall host CPU utilization is higher. As a result, organizations have to retune their thresholds to accommodate the fact that host CPU utilization is now generally higher.
We present this example to reinforce the statement made at the start of this section thresholds are intended to identify abnormal behavior and generally need to be defined on a per-customer, per-project, or per-implementation basis. Although VMware can and does present general guidelines for thresholds, both in the form of predefined alarms as well as in performance white papers and similar documents, in the end the thresholds you use should be defined based on the specific workloads you are or will be running. For this reason, we don't provide any recommendations for thresholds in this book.
What if you don't know what workloads you'll be running on the virtualized infrastructure? There will always be an amount of uncertainty with regard to the workloads that will run on your environment. After all, who can tell the future? Who can know what sorts of workload the organization will need to deploy six months from now or a year from now? The answer lies in capacity planning, which we'll discuss later in this chapter in the section “Incorporating Capacity Planning in the Design.”
With the items to monitor, the tools with which to do the monitoring, and thresholds defined, it's now time for you to decide what action to take when a threshold is reached.
Taking Action on Thresholds
For most, if not all, monitoring solutions, an action is taken when a threshold is reached. When host CPU utilization exceeds the threshold you've defined as acceptable and normal, “something” happens. That “something” may be sending an SNMP trap to your SNMP management system, or it may be running a script. The “something” may be different based on which threshold was reached. Whatever the “something” is, you'll need to define this action in your design.
As you'll see with many different areas of virtualization design, this area both is heavily influenced by and heavily influences the selection of the monitoring tools. If you aren't considering the influence that this has on your selection of monitoring tools, you're missing a key component. For example, if you decide to use vCenter Server's alarms as the sole monitoring tool for your virtualized environment based only on the types of items it monitors and the granularity it provides, but you haven't considered the types of actions vCenter Server can take, you've missed half the picture. It's important to consider both aspects when selecting a monitoring solution.
If the monitoring solution offers the ability to execute a script or an application, then you have tremendous flexibility in generating actions. Essentially, the actions you can take are limited only by the limitations of your chosen scripting language. Given that VMware has enthusiastically embraced PowerShell and offers extensive PowerShell integration, having the ability to execute a PowerShell script in response to a threshold having been reached or exceeded is a useful feature.
Here's an example of how you can use scripting (with potentially any scripting language, but especially with PowerShell) with alarms. Let's say you create an alarm in vCenter Server that monitors datastore free space. When that threshold of available free space in the datastore triggers the alarm, you can have the action set to execute a PowerShell script that initiates a storage vMotion operation to migrate a VM to another datastore. (Or you could use Storage DRS and accomplish the same thing, but without a script. Refer to Chapter 6, “Storage,” for more information on Storage DRS.)
We hope this gives you some ideas about how you can use scripting and automation to broaden the reach of the actions taken by your alarms when thresholds are reached. However you use actions, though, you should be sure to thoroughly document the actions (and any accompanying scripts, if they exist) in your design documentation.
One final area remains to be addressed alerting the operators when abnormal values are detected. In some instances, you may include alerting the operators in the actions you've defined when a threshold is reached. If alerting is handled separately, you'll need to define it. We'll cover this in the next section.
Alerting the Operators
In the event that alerting the operators of the virtualization environment is handled separately by the monitoring solution, you also need to decide how and when operators are alerted by the monitoring solution. In many cases, alerting is integrated with the actions that are taken when a threshold is met or exceeded. This is the case, for example, with vCenter Server alarms, where one of the possible actions is sending an email message via SMTP.
For those solutions that don't offer integrated alerting, or for those situations where alerting may be handled via an existing alerting mechanism such as an enterprise systems management tool, you'll need to define, in the design, the alerting structure that will apply to the monitoring system. Will administrators be alerted every time a threshold is met or exceeded, or only after a threshold is exceeded a certain number of times within a specified time window? Will the same type of alert be used in all cases, or will a different type of alert be used for more urgent situations? For example, excessive CPU utilization or high memory utilization within a virtualized instance of a guest OS may not need the same type of alert as a problem with storage availability or host availability. Your design needs to include a description of the types of alerts that will be provided and which thresholds will generate alerts. Some thresholds may generate alerts, but some thresholds may not. This all has to be included in your design.
Building an appropriately configured monitoring solution and strategy into your VMware vSphere designs is a key task. Without the instrumentation that a monitoring solution provides, it would be difficult, if not impossible, to truly understand the behavior of various workloads in the environment.
Capacity planning involves shifting the focus on monitoring from problem resolution to problem prevention. A solid monitoring solution tells you when a bottleneck is present; capacity planning attempts to prevent things from become a bottleneck. Monitoring is reactive; capacity planning is proactive. We'll dive into capacity planning in the next section.
Incorporating Capacity Planning in the Design
We've already said this, but it's a useful distinction between monitoring and capacity planning monitoring tells you what has happened or is happening, and capacity planning tells you what will happen. Further, adequate capacity planning goes a long way toward helping an IT organization be proactive instead of reactive. A lack of capacity planning, on the other hand, often results in a reactive scramble for resources and unplanned long nights and weekends. Which would you prefer?
Capacity planning comes in two varieties, both of which are important to the architect of a VMware vSphere design:
- Capacity planning before virtualization occurs, such as that done by VMware Capacity Planner
- Capacity planning after virtualization, such as that done by VMware vCenter Operations, VMware vCenter Chargeback Manager, or similar products
In this section, we'll look at both types of capacity planning and why they're important to a solid VMware vSphere design.
Planning before Virtualization
Previrtualization capacity planning invariably involves the assessment of nonvirtualized systems by gathering information such as physical hardware; utilization of resources like CPU, memory, disk, and network; inventorying installed software on the systems; interaction with other systems on the network to understand dependencies; and analyzing all the data to provide estimates or suggestions of what a virtualized environment would look like. This process can be done manually using built-in tools supplied by OS vendors with their OSes, but we recommend the use of an automated tool to help with this task. If you prefer to manually assess your environment before virtualization, we discuss that process in more detail near the end of this section.
Using Tools for Previrtualization Capacity Planning
Should you choose to use a tool, a few tools provide the necessary functionality for previrtualization capacity planning:
- VMware Capacity Planner (www.vmware.com/products/capacity-planner)
- NetIQ PlateSpin Recon (www.netiq.com/products/recon)
- CiRBA (www.cirba.com)
Although the tools differ in feature sets, functionality, implementation, and operation, they share the same end result providing sufficient information for a virtualization architect to properly design an environment that can support the workloads that are proposed to be migrated into this environment.
These tools enable a proper virtualization design by providing critical information necessary for a good design. This information includes the following:
- Resource usage in each of the major resource categories (CPU, memory, storage, and networking)
- Resource usage patterns, such as when workloads are their busiest or when certain types of resources are most heavily used
- Hardware inventory information that you can use to determine whether existing hardware can be repurposed into a virtualized environment
- Software inventory information
Although these technical details are important, sometimes nontechnical details are also important. Facts like business unit ownership, compliance, and regulatory requirements can also have a significant impact on the design of a VMware vSphere environment.
For example, consider the idea of business unit ownership. In some organizations, IT assets are owned by individual business units rather than by a central IT group. In these instances, consolidation can typically only occur within a business unit's IT assets rather than across the IT assets of multiple business units. If the previrtualization capacity-planning tool can't account for this additional dimension, then the consolidation recommendations will be skewed because workloads will be stacked without consideration of IT asset ownership, thus potentially placing one group's workload on another group's physical assets. The results won't properly reflect the reality of how consolidation or virtualization will actually occur.
Some of the more advanced tools account for this functionality by incorporating additional business rules. You can use these business rules to model how the virtualized environment would be affected by including other criteria into the planning process. For example, if PCI-compliant and non-PCI-compliant systems must be kept separate, how does that affect the design? If DMZ and internal systems must not share common storage, how does that affect the design?
In many cases, VMware vSphere architects aren't given the opportunity to choose the previrtualization planning tool; they're called in after the initial analysis is performed and the results prepared. Although this situation isn't ideal, it's fairly common. In the cases where you're allowed to select the previrtualization capacity-planning tool, carefully compare the features of the tools to ensure that you select the tool that incorporates and analyzes the information necessary for your organization. If your organization is one in which individual business units own IT assets, then you may need a tool that incorporates business ownership as a factor for helping to determine consolidation ratios and how to stack applications onto a virtualized environment.
The importance of previrtualization capacity planning and the information it provides should be pretty obvious. Without a clear understanding and knowledge of the types of workloads that will be placed into the virtualized environment, it's almost impossible to craft an effective design. How will you size the storage if you don't know how much storage capacity (in gigabytes or terabytes) is required, or if you don't know how many input/output operations per second (IOPS) are required? How many hosts will you need? Without some sort of assessment of current CPU utilization, you'll be guessing.
Manually Performing Previrtualization Capacity Planning
So far, our discussion of previrtualization capacity planning has focused on the use of capacity-planning tools. As we mentioned earlier, it's possible to do previrtualization capacity planning without the use of additional tools. In these situations, you'll need to manually perform the tasks that are automated by tools. These tasks are summarized at a high level next:
Gather information about processor utilization, memory utilization, memory-paging activity, disk utilization for both local disks and storage area network (SAN) attached disks, and network utilization. You need to decide whether you'll gather average utilization only, peak utilization only, or some combination of the two.
This utilization data also helps you establish a performance baseline, a reference point against which you can compare later. Performance baselines are helpful in a couple of ways they help protect against skewed perceptions after virtualization (“It's slower now that it's virtualized”) and can provide assistance when you're troubleshooting by making it easier to identify abnormalities in the environment.
As you can see, this can quickly become a complex multidimensional analysis. You'll probably need to perform this process multiple times against multiple reference points (for example, different hardware platforms or hardware configurations) in order to find the optimal combination of workloads, hardware platform, and hardware configuration. Keep in mind that this process isn't about the raw consolidation ratio—it's about finding the right balance of workloads on physical servers for maximum efficiency.
As you can see by this high-level description, manually performing previrtualization capacity planning is time consuming and difficult, especially in larger environments and environments that have nontechnical business rules affecting the results. For this reason, we recommend that you use one of the tools mentioned earlier for the majority of instances.
Before moving to the next section on capacity planning during virtualization, we feel it's important to pause for a moment and review the idea of a consolidation ratio. This is something we've mentioned a couple of times so far but haven't formally defined. What is a consolidation ratio? Is it important? What role does it play? These are all valid questions that individuals relatively new to virtualization might have, and the idea of a consolidation ratio is an important concept within the context of VMware vSphere design.
The consolidation ratio is the ratio of VMs to hosts, typically reduced to the number of VMs on a single host. For example, if your environment has (or will have) a consolidation ratio of 300:10—that is, 300 VMs running on 10 ESXi hosts—then you have a consolidation ratio of 30:1. The actual number of VMs that are (or will be) running might vary, especially considering the effect of features like vSphere HA and vSphere DRS, but on average you would expect to see about 30 VMs running on every ESXi host.
Consolidation ratios are important because, invariably, just about every capacity-planning exercise comes down to them. In step 4 of the process for manually performing a previrtualization assessment, we talked about stacking workloads. Stacking workloads is another way of talking about creating a consolidation ratio, especially as environments grow in scale and complexity. When environments are small, remembering the relationship between certain groups of workloads and the underlying ESXi hosts is (relatively) easy. As environments grow, and more workloads are created, it becomes harder to remember that relationship, and you need to take a higher-level view of the environment. A consolidation ratio is one way of taking that higher-level view. We'll revisit consolidation ratios again in the next section, which talks about capacity planning during (as opposed to before) virtualization.
Planning during Virtualization
Capacity planning after virtualization (or during virtualization, if you prefer) typically involves the use of historical performance and monitoring data to perform trending analyses. The results of these trending analyses are used to create projections of virtualization usage that help administrators understand how quickly resources are being consumed and when additional resources will need to be added to the virtualization infrastructure.
Using Tools for Capacity Planning during Virtualization
As with previrtualization capacity planning, a number of products on the market provide this functionality. In fact, most—if not all—of the products mentioned in this chapter offer both performance-monitoring functionality as well as capacity planning/forecasting features.
Although capacity planning during virtualization is, in large part, about forecasting trends in resource usage, a number of other features have come to be included in this category as well. These features include the following:
- Identifying inactive or idle VMs that may be consuming capacity. This is targeted at encouraging more effective VM lifecycle management. By decommissioning inactive VMs that may no longer be in use, organizations gain more efficient use of virtualization resources.
- Identifying VMs that aren't right-sized—that have been configured with more resources than they typically use based on historical performance data. Again, by right-sizing VMs, organizations can use virtualization resources more efficiently.
- Identifying orphaned VMs and VM resources, such as virtual disks that are still on the storage platform but are no longer referenced by an active VM.
Through the addition of these features and their association with tools that also perform capacity planning, many of the products and solutions are now referred to as capacity-management or capacity-optimization solutions. The fundamental purpose is the same, though providing insight into resource usage in the virtualized environment and helping virtualization administrators know when more resources need to be added.
When it comes to selecting a tool to help with capacity planning (or capacity management, if you prefer), you'll want to answer some questions. The answers will help you determine which tool is right for your environment:
Based on the answers to these questions, you can begin to go about incorporating a capacity-planning tool into your overall design. After the selection of the capacity-planning tool is complete, you can amend your design, where necessary, to account for increased resource usage by the tool or to adjust for any changes to the operational procedures required in the design. You should also amend your design to account for the new functionality this tool adds; for example, you may want to add operational procedures that discuss creating regular reports about inactive VMs, orphaned VM resources, or resource-usage trends. You may also consider building a design that is a bit leaner with regard to extra resources, knowing that the capacity-planning tool can provide recommendations about when additional resources will need to be added. This may help reduce initial acquisition costs and make the design more palatable for your organization.
Manually Performing Capacity Planning During Virtualization
As with previrtualization capacity planning, it's possible to perform capacity planning after virtualization without the use of additional tools. There will almost certainly be a feature gap between the use of third-party tools and a manual capacity-planning process, but this is nevertheless a viable approach for any VMware vSphere design.
What's involved in manually performing capacity planning? As with previrtualization planning, there are several steps:
For example, if you want to gather data about guest OS storage latency as reported by Storage I/O Control in vSphere 4.1 and later, you need to get that information from vCenter Server. If you want information about CPU usage, you can get it directly from a host or from vCenter Server. It's possible that you can use vCenter Server's existing performance data, as long as vCenter Server's polling frequency and data-rollup schedule are acceptable for your purposes. (Many third-party tools rely on vCenter Server's database.) The same tip regarding peak and average utilization mentioned earlier in our discussion about manually performing previrtualization capacity planning also applies here.
A simpler, but potentially less accurate, means of managing capacity centers on planning around VM growth. For this method, we'll use the idea of the consolidation ratio, which we defined and explained in the previous section. Because the consolidation ratio is itself an approximate figure, this method may not be as accurate as more detailed assessments involving the use of performance metrics and data analysis, but it's still a valid approach.
For example, let's say you know that the number of VMs in your environment will increase by 25% per year. As a result, you can use the following formula to calculate how many additional hosts will be required in the next year:
(Growth rate × VM count × Length of time) ÷ Consolidation ratio
An environment with 200 VMs and a current (or expected) consolidation ratio of 15:1 results in the following calculation of additional hosts needed in one year:
(25% × 200 × 1) ÷ 15 = 4 additional hosts (rounded up)
Or consider an environment with 300 VMs, an expected (or measured) consolidation ratio of 12:1, and an expected growth of 20% over the next year:
(20% × 300 × 1) ÷ 12 = 5 additional hosts
Although this formula gives you an idea of how many hosts will be needed over the course of the next year, it doesn't tell you when those hosts will be needed. For that, you need to go back to monitoring resource usage and extrapolating data. Between these two methods, though, you should be able to get a fairly good handle on managing the growth of your VMware vSphere environment.
Other aspects of capacity management, such as identifying inactive VMs or orphaned VM resources, can be addressed through the definition of operational procedures that specify routine and regular audits of the environment and the VM configurations. This can be time consuming, but the cost savings resulting from more efficient use of virtualization resources may offset the expense of the additional operational overhead. Further, using automation tools such as vCenter Orchestrator and/or PowerCLI can reduce operational overhead and streamline tasks.
Capacity planning, like monitoring, can be an extremely useful and important part of your vSphere design. In some ways, it's every bit as important as the storage, networking, and cluster designs. In the next chapter, we'll put your design skills to the test in a review of a sample design intended to help you pull it all together.
Summary
In this chapter, we've discussed the importance of incorporating monitoring and capacity planning into your VMware vSphere design. A design can't be static; it must be flexible enough to grow or shrink as the company adopting the design also grows or shrinks. Monitoring provides the instrumentation necessary to determine the need to grow or shrink. When combined with capacity planning, operators not only know the immediate needs but can also attempt to forecast future needs. In many ways, monitoring and capacity planning are two sides of the same coin one is reactive and targeted for the here and now (monitoring), and the other is proactive and targeted for the future (capacity planning).
When you're selecting a monitoring solution, ask yourself questions that help you determine the company's specific organizational and functional requirements. These requirements will often play a significant role in selecting the appropriate monitoring solution.
Because both performance monitoring and capacity planning/forecasting rely on data gathered from the environment, we see an increasing number of products that offer both features. This is true for VMware's own products—like vCenter Operations—as well as third-party products. As you've see, building capacity planning into the design allows future operators or IT directors to get a better idea of the growth trends and forecasted rate of acquisition for VMware ESXi hosts, network capacity, memory, and storage. Using this trending and forecasting data, administrators can add capacity to their environments before running out of resources.