Using Debug Attributes in Your Code
In the section “‘Just My Code’ Debugging,” I explained how some attributes can influence the debugger’s behavior versus auto-generated code and that you can use versus your own code. The .NET Framework also provides other attributes that you can use to decorate your code for deciding how the debugger should behave versus such code. Table 5.4 lists other attributes that complete the list in Table 5.1.
As previously described in this chapter, discussing custom debugger visualizers is beyond the scope of this book, so the DebuggerVisualizer attribute is not discussed here.
DebuggerStepperBoundary
This attribute is used only in multithreading scenarios and has effects only when a DebuggerNonUserCode is also specified. It is used to run code instead of stepping through it when you are stepping into user code that does not actually relate to the thread you were instead debugging. Due to its particular nature, this attribute is not discussed in detail. The MSDN Library provides additional information at this address: http://msdn.microsoft.com/en-us/library/system.diagnostics.debuggerstepperboundaryattribute(VS.100).aspx.
DebuggerBrowsable
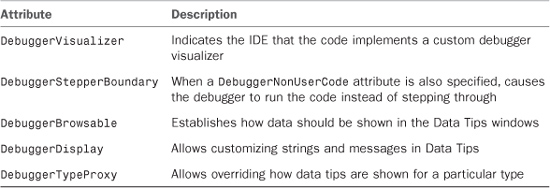
The usage of the DebuggerBrowsable attribute in Visual Basic is quite new. Although supported because it’s provided by the .NET Framework, decorating code with this attribute produced no effects until Visual Basic 2005. Now it is instead possible to use it to establish how an item should be visualized in Data Tips or variables windows specifying one of the following arguments exposed by the System.Diagnostics.DebuggerBrowsableState enumeration:
• Collapsed, which establishes that an item is collapsed and that you have to click the + symbol to expand it and see its children elements
• Never, which causes the specified item to never be visible in windows such as Autos and Locals
• RootHidden, which forces the debugger to show just the children elements of the specified item
For example, consider the following code snippet that retrieves an array of processes (each represented by an instance of the System.Diagnostics.Process class):
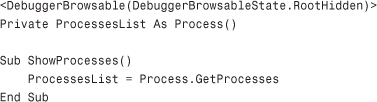
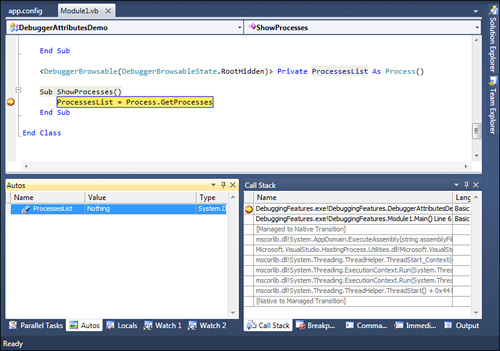
The preceding code causes the debugger to show only the children element of the array, excluding the root (ProcessesList), as shown in Figure 5.22.
Figure 5.22 Using the DebuggerBrowsable you can establish how an object can be shown in debugger windows.
DebuggerDisplay
The DebuggerDisplay attribute also enables establishing how an item should be shown inside Data Tips. With this attribute you can replace Visual Studio default strings and customize the description for an object within Data Tips. For example, imagine you have the code shown in Listing 5.2, in which a Person class and code creates a list of people.
Listing 5.2 Using the DebuggerDisplay Attribute
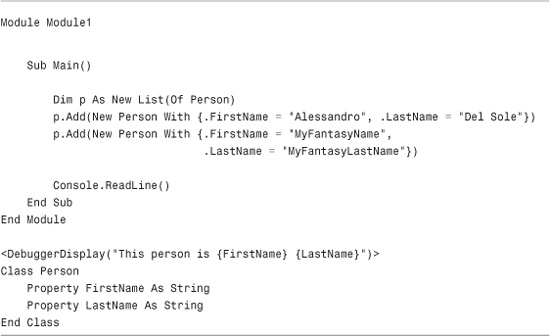
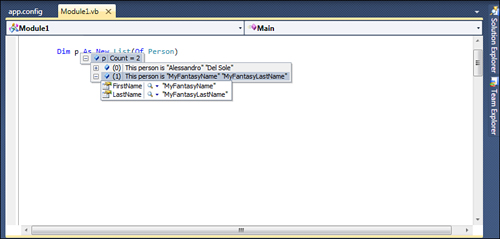
In this book it’s not important to focus on how collections of objects are created, whereas it’s interesting to understand what the DebuggerDisplay attribute does. Now place a breakpoint on the Console.ReadLine statement and then run the application. If you pass the mouse pointer over the p object, Data Tips for this object will be activated. The debugger then displays data that are formatted the way we described in the DebuggerDisplay attribute. Figure 5.23 shows the result of our customization.
Figure 5.23 The DebuggerDisplay attribute enables customizing Data Tips messages.
DebuggerTypeProxy
As its name implies, the DebuggerTypeProxy enables overriding how debug information for a specific data type is shown within Data Tips. Listing 5.3 shows how you can implement such an attribute.
Listing 5.3 Using the DebuggerTypeProxy Attribute
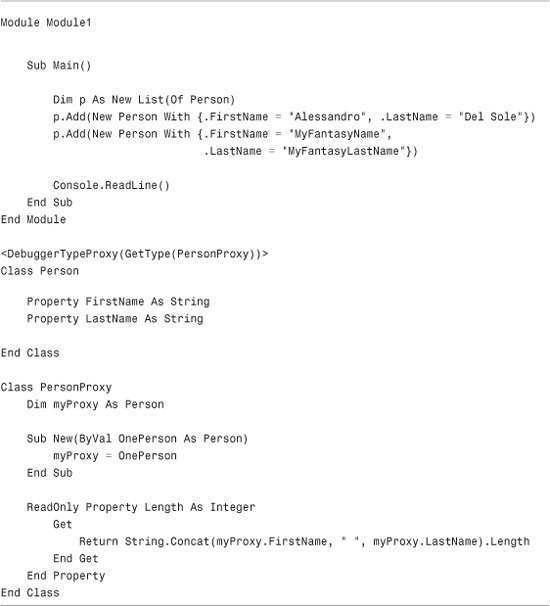
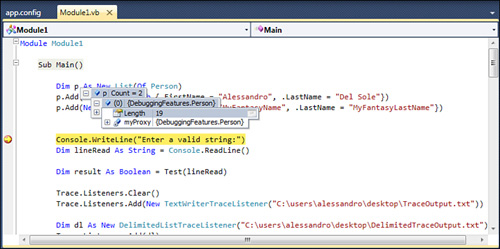
The PersonProxy class basically gets the instance of the Person class being debugged, reads the information from such instance, and returns via the Length property the length of the string composed by the FirstName and LastName properties. The Length property here is just a basic example, but it is useful to understand where the real proxy is. To activate the proxy, you need to decorate the Person class with the DebuggerTypeProxy attribute whose argument is the Type representation of what you need to debug. This type is retrieved using a GetType keyword. If you now try to run the application, you can see that the debugger can display the new Length information, as shown in Figure 5.24.
Figure 5.24 The DebuggerTypeProxy enables customizing the debug information.
So you have a powerful way to customize debug information.
Summary
Debugging is a primary task in developing applications. The Visual Studio 2010 IDE offers lots of useful tools that can enhance the debugging experience. In this chapter you learned what Just My Code is and then you learned how you can work with breakpoints and trace points, passing through debugging in steps. You also saw the debugger windows in action, enabling deep control over variables and objects. In the end you learned how to customize your own code to take advantages of the Visual Studio debugging tools decorating your code with debug attributes. But debugging is just one part in the development process that fights against errors. Exceptions are the other part that are discussed in Chapter 6, “Handling Errors and Exceptions.”