- Title Page
- Copyright Page
- Dedication
- Contents at a Glance
- Table of Contents
- Foreword
- About the Author
- Acknowledgments
- We Want to Hear from You!
- Reader Services
- Part I. Learning the Basics of VB
- Chapter 1. Introducing the .NET Framework 4.0
- Chapter 2. Getting Started with the Visual Studio 2010 IDE
- Chapter 3. The Anatomy of a Visual Basic Project
- Chapter 4. Data Types and Expressions
- Chapter 4. Data Types and Expressions
- Common Type System
- Understanding Value Types
- Understanding Reference Types
- Differences Between Value Types and Reference Types
- Converting Between Value Types and Reference Types
- Conversion Operators
- Working with .NET Fundamental Types
- Common Operators
- Iterations, Loops, and Conditional Code Blocks
- Chapter 5. Debugging Visual Basic 2010 Applications
- Chapter 6. Handling Errors and Exceptions
- Part II. Object-Oriented Programming with Visual Basic 2010
- Chapter 7. Class Fundamentals
- Chapter 8. Managing an Object’s Lifetime
- Chapter 9. Organizing Types Within Namespaces
- Chapter 10. Modules
- Chapter 11. Structures and Enumerations
- Chapter 12. Inheritance
- Chapter 13. Interfaces
- Chapter 14. Generics and Nullable Types
- Chapter 15. Delegates and Events
- Chapter 16. Working with Collections
- Chapter 16. Working with Collections
- Understanding Collections Architecture
- Working with Nongeneric Collections
- The ArrayList Collection
- The Queue Collection
- The Stack Collection
- The HashTable Collection
- The ListDictionary Collection
- The OrderedDictionary Collection
- The SortedList Collection
- The HybridDictionary Collection
- The StringCollection Collection
- The StringDictionary Collection
- The NameValueCollection Collection
- The BitArray Collection
- The Bitvector32 Collection
- Working with Generic Collections
- The List(Of T) Collection
- Working with Collection Initializers
- The ReadOnlyCollection(Of T) Collection
- The Dictionary(Of TKey, TValue) Collection
- The SortedDictionary(Of TKey, TValue) Collection
- The ObservableCollection(Of T) Collection
- The ReadonlyObservableCollection(Of T) Collection
- The LinkedList(Of T) Collection
- The Queue(Of T) and Stack(Of T) Collections
- Building Custom Collections
- Concurrent Collections
- Chapter 17. Visually Designing Objects
- Chapter 18. “Generate From Usage” Coding Techniques
- Part III. Advanced VB Language features
- Chapter 19. Manipulating Files and Streams
- Chapter 20. The My Namespace
- Chapter 21. Advanced Language Features
- Part IV. Data Access with ADO.NET and LINQ
- Chapter 22. Introducing ADO.NET and DataSets
- Chapter 23. Introducing LINQ
- Chapter 24. LINQ to Objects
- Chapter 24. LINQ to Objects
- Introducing LINQ to Objects
- Querying in Memory Objects
- Introducing Standard Query Operators
- Projection Operators
- Restriction Operators
- Aggregation Operators
- Understanding the Let Keyword
- Conversion Operators
- Generation Operators
- Ordering Operators
- Set Operators
- Grouping Operators
- Union Operators
- Equality Operators
- Quantifiers
- Concatenation Operators
- Elements Operators
- Partitioning Operators
- Chapter 25. LINQ to SQL
- Chapter 26. LINQ to DataSets
- Chapter 27. Introducing ADO.NET Entity Framework
- Chapter 28. Manipulating Xml Documents with LINQ and Xml Literals
- Chapter 29. Overview of Parallel LINQ
- Part V. Building Windows Applications
- Chapter 30. Creating Windows Forms 4.0 Applications
- Chapter 31. Creating WPF Applications
- Chapter 31. Creating WPF Applications
- What Is WPF?
- WPF Architecture
- Building WPF Applications with Visual Studio 2010
- Understanding the eXtensible Application Markup Language (XAML)
- Understanding Visual Tree and Logical Tree
- Handling Events in WPF
- Arranging Controls with Panels
- Managing Windows
- Introducing the Application Object
- Brief Overview of WPF Browser Applications
- Chapter 32. WPF Common Controls
- Chapter 32. WPF Common Controls
- Introducing WPF Controls Features
- Understanding the ContentControl
- Understanding Common Controls
- Border
- Button
- Calendar
- CheckBox
- ComboBox
- DataGrid
- DatePicker
- DocumentViewer
- Ellipse
- Expander
- Frame
- GroupBox
- Image
- Label
- ListBox
- ListView
- MediaElement
- Menu
- PasswordBox
- ProgressBar
- RadioButton
- Rectangle
- RichTextBox
- ScrollBar
- ScrollViewer
- Separator
- Slider
- StatusBar
- TabControl
- TextBlock
- TextBox
- ToolBar
- TreeView
- WebBrowser
- WindowsFormsHost
- Using Common Dialogs
- Chapter 33. Brushes, Styles, Templates, and Animations in WPF
- Chapter 34. Manipulating Documents and Media
- Chapter 35. Introducing Data-Binding
- Chapter 36. Localizing Applications
- Part VI. Building Web Applications
- Chapter 37. Building ASP.NET Web Applications
- Chapter 38. Publishing ASP.NET Web Applications
- Chapter 39. Building Rich Internet Applications with Silverlight
- Chapter 39. Building Rich Internet Applications with Silverlight
- Introducing Silverlight
- Creating Silverlight Projects with Visual Basic 2010
- Adding Controls and Handling Events
- Playing Media
- Animating UI Elements
- Introducing Navigation Applications
- Introducing WCF RIA Services
- “Out of Browser” Applications
- Chapter 40. Building and Deploying Applications for Windows Azure
- Part VII. Networking and Exposing Data Through Networks
- Chapter 41. Creating and Consuming WCF Services
- Chapter 42. Implementing and Consuming WCF Data Services
- Part VIII. Advanced .NET Framework with VB 2010
- Chapter 43. Serialization
- Chapter 44. Processes and Multithreading
- Chapter 45. Parallel Programming
- Chapter 46. Working with Assemblies
- Chapter 47. Reflection
- Chapter 48. Coding Attributes
- Chapter 49. Platform Invokes and Interoperability with the COM Architecture
- Chapter 50. Documenting the Source Code
- Chapter 51. Advanced Compilations with MSBuild
- Chapter 52. Building Customizations for Microsoft Office
- Part IX. Applications Deployment
- Chapter 53. Understanding the Global Assembly Cache
- Chapter 54. Setup & Deployment Projects for Windows Installer
- Chapter 55. Deploying Applications with ClickOnce
- Part X. Mastering the Visual Studio 2010 IDE
- Chapter 56. Advanced IDE Features
- Chapter 57. Introducing the Visual Studio Extensibility
- Chapter 58. Advanced Analysis Tools
- Chapter 59. Testing Code with Unit Tests, Test-Driven Development, and Code Contracts
- Appendixes
- Index
Generating Dependency Graphs
Another interesting addition, new to VS 2010, is the Dependency Graph generation. Basically this feature enables generating a WPF-based, graphical, browsable view of dependencies between objects in your projects. Dependency graphs can be generated at assembly level (including all types), namespace level (including only types from a given namespace), or at class level. To demonstrate this feature, create a new console project and add the following items:
• An Entity Data Model mapping the Customers, Orders and Order_Details tables from the Northwind database (see Chapter 27, “Introducing the ADO.NET Entity Framework,” for a recap).
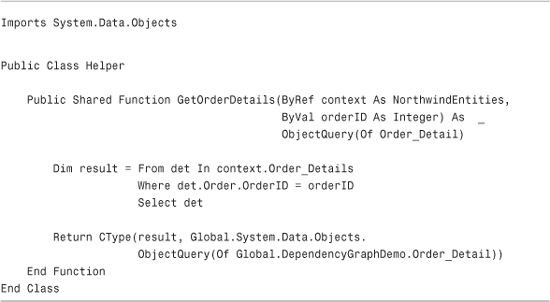
• A new class named Helper, whose purpose is just offering a simple method returning a collection of order details based on the order identifier. The code for this class is shown in Listing 58.5.
Listing 58.5 Demo Class to Be Mapped into the Graph
Now select the Architecture, Generate Dependency Graph, By Assembly command. After a few seconds the new graph will be available inside Visual Studio 2010. You can then expand items and check for their dependencies with other objects, as represented in Figure 58.22.
Figure 58.22 The newly generated assembly-level dependency graph.
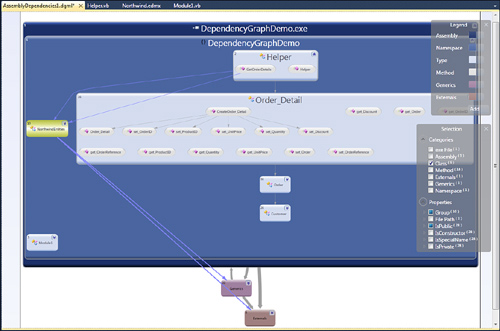
To understand items mapping you can check out the legend. To show complete dependencies information, right-click the graph and select the Show Advanced Selection command. This launches the Selection tool window where you can select one or more objects to be investigated and additional objects to be analyzed such as public or private properties. Figure 58.21 shows public properties dependencies from all classes in the project. For example, the NorthwindEntities class has dependencies with the Helper.GetOrderDetails method because this one receives an argument of type NorthwindEntities. The dependency graphs are flexible and can be exported to XPS documents or to images (right-click the graph for additional options).
Summary
This chapter covered some important analysis tools available in Visual Studio 2010 Premium and Ultimate that are necessary for improving applications’ quality. You discovered how to analyze code for compliance with Microsoft coding rules, required especially when you produce reusable class libraries. Then you saw how to check for code maintainability using the Code Metrics tool. In the second part of the chapter you got information on the integrated Profiler that simplifies checking for performance issues through IDE suggestions; you also saw different usages of the Profiler, including standalone executables. The chapter also focused on the most interesting addition in Visual Studio 2010, the IntelliTrace debugger. Explanations provided information on using this tool for understanding how to keep track of all application events and exceptions during the entire application lifetime, showing also how to analyze summary logs within Visual Studio. Finally, you got an overview of another new addition, the Dependency Graph generation that provides a graphical view of dependencies at assembly, namespace, and class levels.
-
No Comment