Wearable Inertial Sensors and Their Applications
Toshiyo Tamura, Osaka Electro-Communication University, Neyagawa, Japan
Wearable inertial sensors have been developed extensively over the past several years. Inertial sensors, including accelerometers, gyroscopic sensors, and magnetic sensors, can be embedded in the body, such as the trunk, leg, arm, etc., for monitoring the motion associated with human activities. In this chapter, we examine the technological principles of several types of inertial sensors, and provide an assessment and evaluation of these sensors for patient rehabilitation in clinical practice.
Keywords
Accelerometer; gyroscopic sensor; magnetic sensor; timed up and go test; fall risk; fall detector; physical activity; root mean square; autocorrelation; walking performance; symmetry; regularity
1 Introduction
Wearable inertial sensors are the most common wearable devices for the measurement of motion and physical activities associated with daily living. The combination of an accelerometer and a gyroscopic sensor is particularly effective for evaluating motion, and their small size makes them easy to wear on various parts of the body.
2 Wearable Inertial Sensors
In this section, measurement parameters for accelerometers, gyroscopic sensors, and magnetic sensors, as well as monitoring principles for these sensors, are reviewed.
2.1 Principles of Inertial Sensors
A coordinate system must be defined prior to deployment of an inertial sensor for body motion measurement. If the origin of a moving coordinate system has acceleration (A0) and rotates with a gyroscopic angular velocity (ω), and if a mass (m) has the position vector (r′) and the velocity (u′) with respect to the moving coordinate system, then the inertial force observed is
(1)
where ′ indicates a variable corresponding to the moving coordinate system. The right side of the equation has four terms arising from the angular accelerations that correspond to the linear inertial, Coriolis, centrifugal, and apparent forces. Thus, the moving coordinate system is complex, and signal handling must be taken into account.
2.2 Accelerometers
Acceleration can be derived from the first derivative of the velocity or the second derivative of the displacement. However, differentiation of the signal usually increases noise. Thus, direct measurement of acceleration is often easier and more convenient. The acceleration of linear motion (α) is, according to Newton’s second law, the force (F) acting on a mass (m):
(2)
However, the apparent forces, such as the centrifugal and Coriolis forces, may also appear as described in section 2.1 above.
Many types of accelerometers with different specifications are commercially available. For example, accelerometers are relatively cheap and reliable for use as shock sensors in automobiles. Novel MEMS technology is used to produce small and sensitive accelerometers. Overall, the correct type of accelerometer must be selected for each specific application.
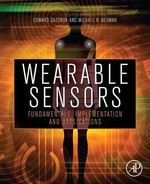
Beam-type accelerometers are the most sensitive in the body motion acceleration range. In a beam-type accelerometer, an elastic beam is fixed to a base at one end, and a mass, called the seismic mass, is attached to the other end, as shown in Figure 1(a). When the seismic mass is accelerated, a force proportional to the mass times the acceleration occurs, and the beam bends elastically in response to the force. To avoid resonant oscillation after transient input, an adequate damping coefficient must be built into the mechanical system. Instead of a beam, a diaphragm, spring, or any other elastic material can be used in the accelerometer.
Determining the amplitude and direction of acceleration in three-dimensional (3D) space requires a triaxial accelerometer, as shown in Figure 1(b). Triaxial accelerometers based on MEMS technology are commercially available.
The displacement of the seismic mass can be detected using several methods, including those based on piezoresistive, piezoelectric effects, or capacitance. Often, a semiconductor strain gauge or capacitance-displacement accelerometer is used to measure motion in humans and animals, because it is small and relatively inexpensive.
Typically, a piezoresistive element is a strain gauge bonded to or incorporated into a mass-loaded cantilever beam. As the beam bends in response to acceleration, the resistance changes. Four individual sensing elements are arranged in a Wheatstone bridge configuration that provides output while canceling the cross-axis, temperature, and other spurious inputs. Using micromachining (MEMs) technology, piezoresistors can be easily implanted in the support beams connecting the seismic mass to the frame or support structure to enable high sensitivity.
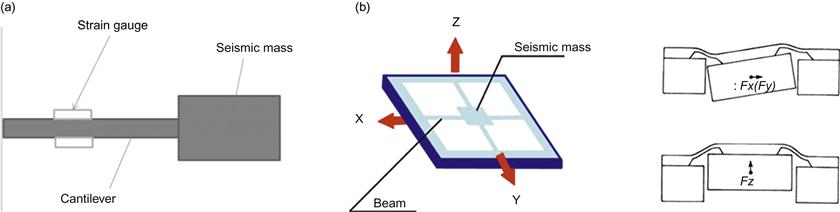
Piezoelectric accelerometers are commonly used when only the time-varying components of acceleration require measurement. Extremely low power consumption, simple detection circuits, high sensitivity, and inherent temperature stability characterize piezoelectric accelerometers. A polarization voltage occurs in the piezoelectric material that is proportional to its deformation. The polarity of the polarization voltage depends on the molecular structure of the material. Figure 2 presents an example of a bimorph configuration beam containing two piezoelectric elements with different polarities designed to produce a double or differential output. A triaxial bimorph also has been developed [1].
The terminal voltage of the piezoelectric sensor is due to the charge that arises due to the flexion of the piezoelectric element and its capacitance. The terminal voltage is proportional to the stored charge; more accurately, a charge amplifier can be used to measure the generated charge, as shown in Figure 3.

When the input capacitance, which includes the capacitance of the piezoelectric element and the stray capacitance, is represented by Cd, then the following relationship is valid:
(3)
(4)
where Q is the generated charge and Vi, V, and A are the input voltage, output voltage, and the gain of the amplifier, respectively. If A >> 1 and AC >> Ci, then
(5)
In this case, the output voltage is proportional to the generated charge, regardless of the input capacitance.
Acceleration signals are used for a wide range of measurements, including assessment of balance, gait and sit-to-stand transfers, classification of movements, easing of physical activities, and estimation of metabolic energy expenditure.
2.3 Gyroscopic Sensors
Angular velocity can be measured with a gyroscope, which consists of a spinning wheel mounted on a movable frame. When the wheel is spinning, it tends to retain its initial orientation in space, regardless of the central forces applied to it. When the direction of the axis is externally altered, a torque proportional to the rotation rate of the axis of inclination arises, which can be used to detect angular velocity. An example of this type of transducer is the dynamically tuned gyroscope.
Typically, micromachined gyroscopes are specialized vibrating accelerometers that measure Coriolis forces (Figure 4). A basic vibratory gyroscope consists of a proof mass mounted on a suspension that allows the proof mass to move in two orthogonal directions. To generate a Coriolis force, the proof mass must be in motion. To this end, the proof mass is electronically forced to oscillate in a direction parallel to the chip surface. If the gyroscope chip is rotated about the axis perpendicular to the chip surface, then a Coriolis force causes the proof mass to be deflected in the second direction. The amplitude of this oscillatory deflection is proportional to the rate of rotation, so that capacitive sensing, as in the case of the accelerometer discussed above, can be used to produce a voltage proportional to the angular rotation rate.
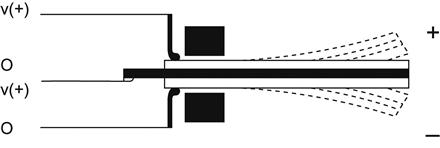
A tuning fork directly detects the angular velocity in a vibratory gyroscopic sensor. The tines of the tuning fork are piezoelectrically excited perpendicular to the wafer surface. When the tuning fork is rotated about the axis parallel to the tines at an angular velocity Ω, the Coriolis effect produces a torque proportional to Ω:
(6)
where acor is the Coriolis acceleration and Vpm is the velocity of the proof mass. Figure 5 presents an example of a tuning fork gyroscopic sensor. The angular rate input axis is parallel to the wafer surface, and the tines are excited with piezoelectric actuators. Due to the Coriolis effect, an angular velocity parallel to the axis of the stem generates a periodic torque, which results in a torsional oscillation of the stem. The torsional oscillation is detected with an implanted piezoresistor located in the middle of the stem. A slot in the center of the stem enhances the shear stress at the read-out piezoresistor position, thereby resulting in a higher sensitivity.

An angular velocity sensor with two or three axes is also possible, as shown in Figure 6[2]. The triaxial micro-angular velocity sensor is mainly fabricated by the silicon-on-insulator (SOI) technique, and it operates to detect the three-axes angular velocities. The outer ring is driven by the rotational comb electrodes to rotate, counterclockwise and clockwise alternatively, around the z-axis. Once the gyroscope is perturbed by Coriolis acceleration resulting from external rotation excitation around the y-axis, the outer ring responds to tilt in the direction of the x-axis. On the other hand, the inner-disc is forced to oscillate about the y-axis if the external rotation excitation is about the x-axis. All the tilts along x-axis or y-axis will result in the change of voltage output across the corresponding capacitors. Similarly, if the external angular excitation is about the z-axis, then the distributed translational proof mass will move in the radial direction and be detected by the comb electrodes.

2.4 Magnetic Sensors
2.4.1 The Hall Effect
Magnetic sensors, which are available with different sensitivities, are used for precise measurements of body movement. Common magnetic sensors are based on the Hall effect (Figure 7), which generates magnetic impedance and magnetic resistance as a result of the interaction between moving electronic carriers and an external magnetic field. In metals, these carriers are electrons. When an electron moves through a magnetic field, it is subjected to a sideways force:
(7)
where q is electronic charge, v is the speed of an electron, and B is the magnetic field.

2.4.2 Magnetoimpedance Sensors
Magnetoimpedance sensors are based on the magnetoimpedance (MI) effect in amorphous wires and are typically fabricated with complementary metal-oxide-semiconductor (CMOS) multi-vibrator integrated circuitry [3,4]. Amorphous materials are non-crystalline; they have a uniform internal structure and typically exhibit ideal soft magnetic properties. As shown in Figure 8, the MI effect occurs when a pulse current is applied to an amorphous wire, generating a dramatic change in the impedance (Z) according to a minute external magnetic field. Because the magnetic permeability changes with the external magnetic field (Hex) in the axial direction, it is possible to detect the strength of the external magnetic field from the change in Z, as follows:
(8)
where a is the diameter of the amorphous wire, ρ is the specific electrical resistance, Rdc is the DC resistance, and ω is the angular velocity.

Amorphous wires exhibit the MI effect because of their unique magnetic domain structure in which the arrangement of the wire surface spin is lined up in the circumferential direction. This arrangement results in a larger change in circumferential magnetic permeability μ, and the MI effect is maximized.
One shortcoming of MI sensors is that, because the wire impedance itself changes symmetrically with the polarity of the external magnetic field, the direction of the magnetic field cannot be determined, and it is difficult to obtain output linearity. However, by winding a pickup coil around the amorphous wire and detecting the induction voltage, only the imaginary number components of the formula are detected, the output properties become linear, and it becomes possible to determine the polarity of the magnetic field direction.
2.4.3 Magnetoresistance Sensors
When a perpendicular magnetic field is applied to a classical semiconductor, such as an InSb plate surface, the resistance increases. This effect is magnetoresistance (MR), and it depends on the electron mobility of the material. The resistance under a magnetic field RB is
(9)
where R0 is the resistance under a non-magnetic field, μ is the magnetic permeability, ρB/ρ0 is the specific relative resistance, B is the magnetic field, and m is a geometric factor consisting of the length and width of the material. If a magnetic field is not applied, the current flows straight through the InSb plate. However, if magnetic flux is applied, a Lorentz force proportional to the magnetic flux density will deflect the current path. The practical use of this principle in magnetic sensing is limited by low MR levels.
Anisotropic magnetoresistance (AMR) sensors are also commercially available. AMR, which is the magnetic field-induced change in scattering due to the atomic orbitals, is a common characteristic of ferromagnetic materials. AMR is maximized when both directions are parallel and minimized when both directions are perpendicular. Typical MR levels are close to 1%, and the response is sufficiently linear to enable the use of AMR devices in practical applications.
2.4.4 Giant Magnetoresistance Sensors
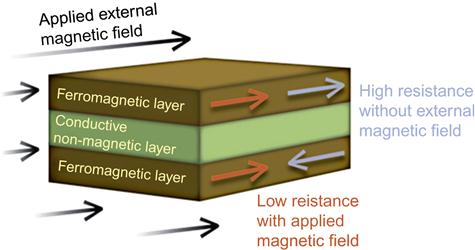
The electric current in a magnetic multilayer consisting of a sequence of thin magnetic layers separated by equally thin non-magnetic metallic layers is strongly influenced by the relative orientation of the magnetizations of the magnetic layers (Figure 9). The cause of this large resistance variation, also called giant magnetoresistance (GMR), is attributed to the scattering of the electrons at the layer interfaces. Thus, any structure with metal-magnetic interfaces is a candidate for displaying GMR, and significant efforts are underway to identify structures to enhance the GMR effect. The use of GMR in conjunction with a three-axis accelerometer, a three-axis gyroscope, and a three-axis magnetometer results in a nine-degrees-of-freedom inertial measurement system. However, few studies based on nine-degrees-of-freedom inertial measurement exist.
ANGLE MEASUREMENT
Gyroscope signals are integrated to produce angle estimates. In general, the orientation angle derived from the angular velocity ωgy measured by a gyroscope is given as
(10)
where ωgy is the gyroscope output signal, A is the proportional factor, ωoff is the angular velocity offset, and φoff is the initial integration offset (at t=0) [5]. Accelerometers are used to compensate for slowly occurring errors in the gyroscope integral. A combination of error correcting (auto-resetting) and offset correction (auto-nulling) techniques has been proposed [6,7].
Using combined signals from accelerometers, gyroscopes, and magnetometers, the Kalman-based fusion algorithm has been applied to obtain dynamic orientations and positions of human body segments [8–10]. Furthermore, use of segment orientations have been proposed to visualize 3D gait from accelerometer and gyroscopic measurements in a global coordinate system [11]. In addition, a Gaussian particle filter has been used with wearable inertial sensors to evaluate the maximum angle of a walking cycle [12].
3 Obtained Parameters from Inertia Sensors
3.1 Mathematical Analyses
Signals from inertial sensors can be used to determine several measures, including walking speed, various root mean square (RMS) values, cadence, of steps, and stride lengths.
Instead of using a stopwatch, inertial sensors, such as accelerometers and gyroscopes, have been used to estimate walking speed, which is an important measure of walking performance in daily life [13]. The experimental design included both treadmill walking and over-ground walking at both predetermined and preferred speeds. The algorithms for estimation of walking speed can be classified as either the direct integration of a human gait model or the abstraction model. The abstraction model is a “black box” model that employs a neural network to describe the complex relationship between the sensor measurements and the walking speed.
RMS values provide information on the average magnitude of accelerations, angular velocities, and magnetic flux in each direction. The acceleration signal during the walking phase shows balance during gait [14]. The RMS values can be determined as shown in Eq. (11), in which N corresponds to the number of in the signal Xi, and Xi is the measured amplitude of acceleration, angular velocity, and magnetic field.
(11)
One stride, or one complete gait cycle, is defined as the time between one heel strike to the next heel strike of the same foot. Thus, each stride comprises two steps, with each step covering the period from one heel strike to the heel strike of the contralateral limb. The number of steps and the number of strides is determined using the acceleration signal, as shown in Figure 10. The stride frequency, or cadence, is the number of full cycles per minute. Cadence is correlated positively with gait and can be used to measure the walking performance [15]. The average step time, average stride time, and cadence are calculated from the following equations:
(12)
(13)
(14)

An autocorrelation function for vertical acceleration has been calculated and evaluated using leg symmetry [16]:
(15)
where N is the total number of samples and m is the time lag expressed as the number of samples. When the autocorrelation of the acceleration signal is computed during the gait, the first peak of Ad(m), Ad1, reflects the regularity of the acceleration between consecutive steps, which can be interpreted as a measure of the symmetry between left and right leg control. The second peak of Ad(m), Ad2, reflects the regularity of consecutive strides. Higher Ad1 and Ad2 values reflect higher step and stride regularity [16–18]. The walking cadence can be obtained from the time lag between Ad1 and Ad2.
The gait parameters that can be extracted from nine-degrees-of-freedom inertial sensors are summarized in Table 1.
Table 1
Possible Parameters for Wearable Inertial Sensors
| Parameters | Signals |
| Velocity | Triaxial acceleration |
| Number of steps | Triaxial acceleration |
| Number of strides | Triaxial acceleration |
| Time | Triaxial acceleration |
| Average stride time | Triaxial acceleration |
| Average stride time | Triaxial acceleration |
| Cadence | Triaxial acceleration |
| Root mean square (RMS) values | Triaxial acceleration, triaxial gyroscopic velocity, triaxial magnetic field |
| Regularity of steps | Triaxial acceleration |
| Regularity of strides | Triaxial acceleration |
| Angle | Combined with triaxial acceleration, triaxial angular velocity, and triaxial magnetic field |
Static and dynamic activities can be estimated using accelerometry. The amplitude and RMS values are measures to differentiate normal and abnormal walking, as well as age-related functions [19].
3.2 Comparison between Rehabilitation Score and Acceleration
The signals obtained from wearable inertial sensors are often used for qualitative evaluation in clinical practice. However, there are also several semi-quantitative scores that can be obtained from wearable inertial sensors. Specifically, the activity of daily life (ADL) score is most often used in clinical practice. While basic ADL categories have been suggested, that which specifically constitutes a particular ADL in a particular environment for a particular person may vary. In basic ADL determinations, normal human functions, such as feeding ourselves, bathing, dressing, grooming, work, homemaking, and leisure have been counted, accumulated, and compared to obtain a total score. Other instrumental ADL scores may also be included, including those that are not fundamental functions, such as managing money, shopping, and transportation, because these functions often determine whether individuals may live independently in a community [20].
Several evaluation tools, such as the Katz ADL score and the Lawton Instrumental ADL (IADL) scale, are available to evaluate patients. The Katz ADL score comprises six individual activities, and the maximum total score is six. Few studies of the relationship between ADL and inertial parameters have been conducted [21–23]. Improvements in the interpretation of inertial parameters are critical to future rehabilitation studies.
4 Applications for Wearable Motion Sensors
The use of acceleration signals was discussed as early as the late 1980s. Acceleration signals at the lower back, which is close to the center of gravity in a typical human, were monitored, and different signals were obtained for patients with various diseases. With the development of integrated circuit (IC) technology, the cost of accelerometers, gyroscopes, and magnetic sensors has greatly reduced, and these instruments have been used in several rehabilitation studies.
4.1 Fall Risk Assessment with Rehabilitation Battery
Various tools for assessment of subjective and objective falling risk have been developed. Subjective methods, such as diaries, questionnaires, and surveys, are inexpensive; however, these tools depend on the experience of therapists and caregivers, individual observation, and subjective interpretation, all of which lead to inconsistency in assessment results [23]. Some standard tests for risk assessment also require subjective judgments. For example, the “timed up and go” (TUG) test is a simple test of the ability to perform a sequence of basic activities. The American and British Geriatrics Societies recommend using the TUG test as part of a screening battery for fall risk (American Guidelines). Traditionally, the test is scored by manually recording the time taken to rise from a standardized chair, walk three meters, turn around, walk back, turn, and sit back down in the chair [24]. This test has been extensively used to assess balance and mobility in the elderly [25–27]. The test is considered simple because it uses total test time as a threshold for prediction of fall risk in the elderly [28]. TUG test research suggests a 13.5-s duration for completion of the whole test as the threshold to classify fallers and non-fallers [29]. Distinguishing postural transitions in the TUG test, however, depends on subjective judgment that counts the time taken for each posture transition.
Several studies have suggested using wearable inertial sensors to classify the fall risk among the elderly and improve the consistency of results. In recent studies, researchers used three wearable inertial sensors to determine the phase transition, which were attached at the waist dorsally and also at both the right and left thighs [30–32]. A single accelerometer at the track was also used to assess the fall risk [33]. Figure 11 shows a typical example of phase classification at the waist by accelerometer and gyro sensor.

Another previous study investigated the test-retest reliability of an instrumented TUG test and found temporal gait parameters to be the most reliable measures, with mixed results for spatial gait parameters and sit-stand variables [34,35]. These objective measures enabled more complete, sensitive TUG-based fall risk assessment.
The Berg Balance Scale (BBS) is used to evaluate the balance control of elderly individuals. However, the BBS also requires subjective observation and determination for scoring some test items [36].
Acceleration signals can be used to measure gait accurately and can be applied to studies of walking, sit-to-stand performance, and walking performance. An accelerometer mounted on the torso reflects the periodic movements while walking, including speeding up and slowing down, as well as vertical, lateral, and anteroposterior moves [37]. The evaluation of walking performance typically requires either relatively long straight walking surfaces of 20–40 m [37,38] or treadmill walking [39]. However, for rehabilitation evaluation, distances of 6–10 m may be sufficient for evaluating walking performance. At distances greater than 10 m, patients in rehabilitation may tire. Instead, in rehabilitation settings, the time required for an individual to walk 10 m without assistance is measured; the time required to walk 6 m is also measured to evaluate acceleration and deceleration.
Acceleration measurements have also been compared with a variety of clinical balance tests, including variants of Romberg’s tests, heel–toe straight-line walking, and a functional reach test, as well as quantitative motor coordination tests, including rapid stepping tests and heel–toe transitions [40]. Other common batteries for fall risk evaluation are sit-to-stand transitions [41], standing posture sway, and the left-right alternating level step test. The inertial parameters for these could be obtained using sensors to assess the fall risk [42–45]. In general, inertial sensors are promising sensors for fall risk assessment. Future studies should focus on evaluation of fall risk using different techniques to determine the most promising sensor sites and optimal predictive variables.
4.2 Fall Detection
Falls and fall-induced injuries are major public-health problems among elderly individuals. Many methods and programs to prevent fall injuries already exist, including regular exercise, vitamin D and calcium supplementation, the withdrawal of psychotropic medication, environmental hazards assessment and modification, hip protectors, and multifactorial preventive programs for the simultaneous assessment and reduction of many of the predisposing and situational risk factors. One such risk of falling assessment is the TUG test described above.
Ambulatory measures have many potential uses, including the objective assessment of mobility in a clinical or home environment over a prolonged period (e.g., the 24-h ambulatory mobility monitor). Ambulatory monitors may be used for initial assessment or as an adjunct to monitoring progress during and after rehabilitation. Research is currently underway to evaluate accelerometers for fall-detection medical devices that may be used to prevent falls and consequent injuries in the elderly population.
Automated fall detectors have been developed to support independent living and safety. These detectors are based mostly on accelerometers attached to the body. Currently, most fall-detection devices are prototypes that are still in the research stage.
Fall-detection algorithms detect different phases of a fall event: (1) motion prior to impact based on high velocity [46,47] and fast postural changes or free falls [48,49]; and (2) the impact itself based on high acceleration [50,51], a rapid change in acceleration and end posture [52,53], or reduced general activity after the impact [51]. In earlier studies, Kangas et al. found that a waist-worn triaxial accelerometer with a simple algorithm was sufficient for fall detection [54,55].
4.3 Quantitative Evaluation of Hemiplegic Patients
A semi-quantitative score based on a physical therapist’s observation is used as a standard for evaluation of hemiplegic patients. Hemiplegic legs and arms are observed and scored from 1 to 6 on the Bronstrom scale [56]. The physical therapist scores the patient’s performance while walking or executing upper-arm movements. However, judgments among experienced therapists may vary, because no standard criteria for assessing hemiplegia exist.
Instead, acceleration and gyroscopic sensors can be used to quantify hemiplegic patient performance. The walking performance of hemiplegic patients has been typically evaluated based on the symmetry and regularity of the hemiplegic site. The gyroscopic sensor has been used to detect the gait phase of hemiplegic walking [31,33,57]. The extensibility of hemiplegic patients’ lower limbs was significantly lower than that of normal subjects, and the hemiplegic gait exhibited poor balance compared with normal gait [58,59]. The influence of rehabilitation training of hemiplegic gaits could also be analyzed quantitatively.
4.4 Clinical Assessment for Parkinson’s Disease
Inertial sensors have also been applied to patients with various gait abnormalities, including the dyskinesia associated with Parkinson’s disease (PD). The use of a sensor-based system to monitor PD is promising for improvement of the clinical management of PD patients. A portable triaxial accelerometer attached at the shoulder was used to monitor the severity of the dyskinesia, which occurs as an uncomfortable side effect of PD medication. The acceleration signal and severity of the dyskinesia are highly correlated [60].
Several scores exist for evaluation of PD, including the Unified Parkinson’s Disease Rating Scale (UPDRS) III. Comparison studies of UPDRS scores and parameters from inertial sensors have been carried out by several researchers [61–64]. A separate study investigated the correlation between gait parameters and a motor score based on modified abnormal involuntary movement (AIM) and Goetz scales [65]. Two accelerometers placed over the middle of the lower back using a semi-elastic belt recorded craniocaudal and side-to-side accelerations. The PD gait was characterized by a reduction in walking velocity, which was explained by reductions in stride frequency and step length. In addition, a reduction in walking regularity and craniocaudal activity also was noted. Walking regularity and craniocaudal activity were strongly correlated with the motor score, thereby suggesting that gait regularity and craniocaudal activity are particularly suitable for characterizing a stabilized PD gait.
4.5 Energy Expenditure
Current accelerometers can estimate the energy expenditure associated with physical activity. Over the past several decades, the integral of the acceleration signal per unit time has been assumed to be proportional to the oxygen consumption [66,67]. A small portable accelerometer was developed to estimate the energy expenditure of daily activities. The oxygen consumption of 14 different activities was measured in 21 subjects, each wearing the portable accelerometer at the waist. The reproducibility of accelerometer readings was high (four subjects, 14 activities; r=0.94). The standard error of the oxygen consumption (VO2) estimate from the accelerometer, based on 21 subjects and 14 activities, was 6.6 mL min−1 kg−1. This method provides an epidemiological way to evaluate and control environments and to create individual activities to obtain good correlation.
Physical activities are characterized by intensity, type, duration, and frequency. The absolute intensity of physical activities is the energy expenditure of the activity (EEact). Many researchers use the minute-to-minute EEact values predicted by accelometers to classify daily activities with predetermined threshold values and to enable the evaluation of the duration and frequency of different activities. Various output measurements from accelerometers must be calibrated with well-measured EEact values produced by different tasks. Additionally, the intensity of the accelerometer signal can be used to estimate metabolic equivalents (METs) in adults and children. Recent technological developments include advancements in both linear and nonlinear analytical modeling approaches. Reference energy expenditure data may be obtained via either indirect calorimetry or deuterium-labeled water techniques in a well-controlled environment.
Most linear validation studies have evaluated the correlation coefficient between the activity counts from the monitor and energy expenditures measured using indirect calorimeters. For example, level walking exhibited high correlation, but the correlation coefficient associated with housekeeping activity was very low. In individual monitoring, a physical activity monitor may underestimate certain physical activities while overestimating others; thus, the total sum of the predicted EEact is often comparable to the measured overall EEact.
Nonlinear approaches have also been attempted. A two-component (vertical and horizontal) power model was developed to translate individual activity counts:
(16)
where Av is the vertical acceleration count, and counts in the Aa and Al terms are combined in the anterior-posterior and lateral directions, i.e., in the horizontal plane. The coefficients a, b, p1, and p2 are determined by a traditional unconstrained nonlinear optimization algorithm for each individual [68]. Compared with the linear model, the correlation was improved, and the underestimation was reduced from 50% to 3% [69]. Thus, the nonlinear model improves the accuracy of the EEact prediction; however, the nonlinear model is sometimes unstable.
5 Practical Considerations for Wearable Inertial Sensor Applications in Clinical Practice and Future Research Directions
Wearable inertial sensors with appropriate specifications have been used in clinical applications. The critical issue for successful clinical use of wearable inertial sensors is sensor selection, which must be considered on a case-by-case basis. Acceleration, angular velocity, and magnetic sensors with a maximum nine-degrees-of-freedom are commercially available. Higher accuracy is not necessarily required for rehabilitation purposes. In clinical settings, simple signal interpretation is required for both physicians and patients. For more widespread popularization of wearable inertial sensors in clinical practice, development of improved evidenced-based interpretation is proposed.