Measurement of Energy Expenditure by Body-worn Heat-flow Sensors
Neil Szuminsky1, John Dykstra1 and Ed Melanson2, 1MetaLogics Corporation, Minneapolis, Minnesota, USA, 2University of Colorado Anschutz Medical Campus, Denver, Colorado, USA
Most body-worn devices that report calories estimate energy expenditure by measuring one or more surrogate parameters, most commonly some form of motion. These devices are susceptible to significant inaccuracies in the estimation of caloric expenditure. Accurate measurement of energy expenditure requires either the measurement of oxygen consumption (indirect calorimetry) or heat production (direct calorimetry), but neither has been used successfully in a body-worn sensor that can be used in a free-living environment. This chapter describes the principles and design elements that went into the development of a body-worn direct calorimeter that utilizes a special custom-designed heat flow gauge that accurately measures all forms of heat from the body, including evaporative flux.
Keywords
Direct Calorimeter; Heat flow; Heat flow gage; Evaporative heat flow
1 Introduction
Measurement of energy expenditure (EE) in free-living environments is often a goal for consumers as well as health and research professionals. However, accurately measuring the number of calories burned in free-living individuals (i.e., total energy expenditure) is difficult. While there are many body-worn devices that report calories, almost all of these devices determine energy expenditure by measuring one or more surrogate parameters, most commonly some form of motion. Systems that simply measure motion can misreport the energy expenditure in situations where there either is no motion, or the detected movement can be caused by different activities with very different energy expenditures. Motion-based sensors are known to be insensitive to non-ambulatory activities, especially those like upper body activities or stationary bike use. The accuracy of the energy expenditure estimate can be improved in these systems by improving estimation of activity level or type. This is often accomplished by use of three axis accelerometers, but has also been done by using additional measurement parameters. These additional parameters allow more complex algorithmic estimation schemes to be utilized, but are still relying on the correlation between motion and energy expenditure.
Clinically validated techniques for the measurement of energy expenditures require measurement of oxygen consumption (indirect calorimetry) or heat production (direct calorimetry). Indirect calorimeters are the most common type of calorimeters in use. They are referred to as indirect calorimeters because they in fact do not directly measure calories, but rather measure the oxygen consumption and carbon dioxide production that occurs during metabolism. A direct calorimeter is designed to measure the heat produced during metabolism. Since a calorie is in fact a measure of heat, these systems do directly measure kilocalories. Most direct calorimeter systems were designed as rooms with sophisticated systems for measuring all forms of heat exchange from the body. The use of the past tense is intentional as direct calorimeters, despite being the original measurement systems for energy expenditure, have largely been supplanted by indirect calorimeters in the laboratory setting due to a number of practical advantages in the research environment.
There are, or have been, body-worn calorimeters based on both measurement techniques. Body-worn, portable indirect calorimeters are available, but with the need for a mask, tubing, and fairly large electronics, these devices are more easily viewed as portable “backpack” versions of metabolic carts rather than true body-worn devices. “Suit direct calorimeters,” which measure heat flux from the skin surface with a web of water tubes connected to an external cart, similarly don’t live up to the image of a body-worn sensor. Direct calorimetry by way of heat-flux sensors mounted directly to the skin would appear to be more easily classified as body-worn sensors. Historically, a few such systems were developed, but found limited use. The inability of these early systems to measure evaporative heat losses (i.e., perspiration), which restricted their use to low activity levels, is the most likely reason for that limited use. It should be noted that neither of these generally accepted methods (indirect and direct calorimetry) are currently feasible for use in a free-living environment and therefore their use has been limited mostly to clinical research environments.
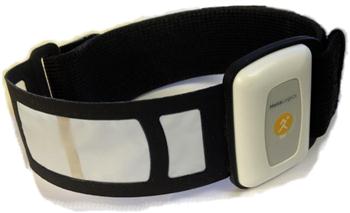
A novel, body-worn direct calorimeter (Figure 1) was designed to overcome the limitations associated with the reliable measurement of conductive, radiant and convective, and evaporative heat losses. A commercial version of this device is now available.1 This wearable sensor was achieved by designing a heat-flow gauge for this specific application. The gauge was designed to have minimal impact on the skin surface (factors such as occluded area and thermal resistance being considered) and the addition of a membrane covering the heat-flow gauge, which allows perspiration to be transported onto the gauge surface and evaporate.
2 Energy Expenditure Background
Energy expenditure at first glance should be simply related to the amount of work performed during a particular activity, and it would seem that simple physics would allow for a precise calculation. For example, lift a 5 kg weight 30 cm and you would expend a known amount of energy that can be expressed through the simple formula we learned in Physics 101:
(m is mass, g is gravity, and h is distance lifted).
Solving this for the above example results in 14.7 J, or 3.51 calories required. However, in the human body there are internal processes required to allow the performance of that external work. Everything from the thought processes used in planning the movement, to the movement of blood to feed nourishment to the muscles, to actually performing the movement requires energy expenditure.
The primary currency for energy expenditure within the body is adenosine triphosphate (ATP). When an action potential is generated in the neuron to initiate the movement, ATP is consumed (i.e., dephosphorylated to ADP) to restore the resting membrane potential. The contraction of the muscle cells in response to the firing of the neuron consumes ATP, as does the pumping of blood through the muscle to provide glucose and oxygen to the tissue and removing lactic acid and other metabolic wastes. Even maintenance of the hemoglobin in the red cells to allow it to transport oxygen requires energy. All of this “internal” work is required in order to perform that external work of lifting the weight. Thus, knowing ATP consumption would allow a much more accurate determination of energy expenditure for the activity than the physics calculation. Of course, the direct measure of intra-cellular ATP consumption in vivo is neither practical nor feasible for measuring total energy expenditure.
Fortunately, there are two aspects of ATP consumption in metabolic processes that allow it to be measured and used to determine energy expenditure (Figure 2). The first is that the formation of the ATP from ADP is proportional to the oxygen consumed by an organism. The second is that significant heat energy is released as ATP is dephosphorylated. Indirect calorimetry takes advantage of the former and measures the oxygen consumed, while direct calorimetry, by measuring the heat generated, takes advantage of the latter aspect.

The production of ATP occurs by the catabolic metabolism of a number of substrates. Carbohydrates, especially glucose, are usually considered as the primary energy substrate, and often are. These substrates drive the resynthesis of ATP via the glycolysis pathway, Kreb’s cycle, and oxidative phosphorylation [1]. Conversion of one molecule of glucose through the pathways consumes six oxygen molecules and produces six molecules of carbon dioxide, while generating as many as 38 molecules of ATP. If the substrate is a fat, the picture is a bit more complicated since fats are not as uniform in composition as carbohydrates. The actual size of the fatty acid molecules found in fat dictates the actual oxygen consumption and carbon dioxide production, but in general, utilization of fats consumes approximately three oxygen molecules for every two carbon dioxides produced. The ratio of carbon dioxide produced to oxygen consumed is known as the respiratory quotient (RQ) and is an indication of the substrates being utilized during metabolism. For carbohydrates, RQ is 1 but for lipids it can be as low as 0.7.
The number of ATP molecules produced also varies by the substrates being utilized. Utilization of carbohydrates for ATP production is the most efficient, providing 5.047 kcal for each liter of oxygen consumed. Fat utilization, on the other hand, only produces 4.686 kcal for each liter of oxygen. Thus, to accurately determine ATP production it is important to measure both oxygen consumption and carbon dioxide production. When measured in expired air, the ratio of the volume of CO2 produced (VCO2) to volume of oxygen consumed (VO2) is termed the respiratory exchange ratio (RER). Indirect calorimeters measure the volume of respired air and the concentration of oxygen in the expired air to determine the volume of oxygen consumed and, in most cases, they also measure the concentration of carbon dioxide expired to determine the substrate utilized. These values are then used to calculate the energy expenditure needed for the regeneration of ATP utilized during the metabolic processes.
While indirect calorimetry relies on determining what was “burned” to replace the ATPs consumed during metabolic activity, direct calorimetry relies on measuring the heat released during the cellular metabolism. When ATP is used as an energy source to drive a metabolic process, only a fraction of the energy used to create the high-energy phosphate bond is converted to actual work. Most of the energy, approximately 80%, is dissipated as heat (Figure 2). As homeotherms, our body’s goal of maintaining a constant core temperature dictates that it balance this metabolic heat gained from the use of ATP with heat losses from the body (i.e., the body seeks to achieve thermal balance). The heat side of the thermal balance ledger consists mostly of metabolic processes, but also includes heat gained from the environment. The body can lose heat by several means, including conduction, radiation, convection, and evaporation. At rest, radiative heat loss (which allows infrared photography to work) and convective losses predominate. With increased activities or in an environment warmer than the body, evaporation provides the mechanism for heat loss. The body has a number of control mechanisms for actively altering heat loss from the body, including controlling capillary beds of the extremities and the activation of sweat glands.
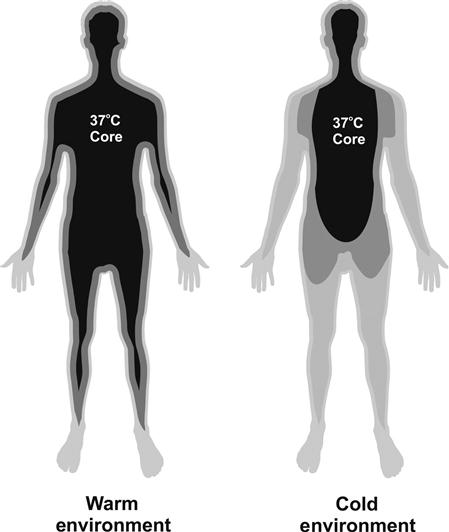
While the body attempts to achieve thermal balance (Figure 3), it is not always in that state. This is in part due to the time constants involved in generation and dissipation of heat. Also, the thermal balance is dictated by the body’s goal of maintaining a constant core temperature, not necessarily a constant mean body temperature. We experience this in cool or cold environments as the body shunts circulation away from the periphery allowing the temperature of those tissues to fall (cold hands) in order to maintain a constant core temperature (Figure 4). Thus, the body’s average temperature may be cooler than the core temperature, which is typically the case at rest in normal room temperature environments. The cooler average body temperature represents a thermal heat sink that the body can dump heat into, causing the average body temperature to rise. This means that generated heat may not need to be dissipated to the environment, at least not right away. As a result, heat loss usually lags behind production. In addition, the core temperature set point is typically 37°C, but this temperature can and does change. The net result is that thermal balance should be considered as occurring over time as opposed to being instantaneous.

Direct calorimetry relies on the body’s desire for thermal balance and accurate measurement of all four forms of heat flux from the body. Historically, direct calorimeters have generally been constructed as specialized rooms with the walls, ceiling, and floor designed to measure heat flow by what is known as gradient layer calorimetry. The room measures the conductive, radiant, and convective heat fluxes directly, and by measuring the increase in water vapor that occurs with evaporation, one can determine the evaporative heat losses. The expense of building these special rooms and inherent limitations, such as the need to account for heat flux from other sources in the room (e.g., a personal computer), has allowed comparatively less expensive and more practical indirect calorimetry systems to supplant direct calorimetry in the research and clinical environments.
3 Examples of Body-Worn Devices
3.1 Motion-Based Estimation of Energy Expenditure
There are a large number of body-worn physical activity monitors that measure body movements and estimate EE from the movement data. The movement measures can range from the pendulum-based step counting found in simple pedometers to multi-axis accelerometers. Irrespective of the way in which movement is measured, these devices utilize correlations between activities and energy expenditure. These devices are typically worn on the waist. For a number of activities, such as walking, this correlation is quite strong. These correlations are so strong that a simple pendulum mechanism worn at the hip can detect and count strides and provide reliable energy expenditure walking on a flat surface. It, however, cannot provide a good estimate when worn while walking up a hill nor for activities that generate energy expenditure without steps, such as bicycle riding. Accelerometers, especially those that measure acceleration in multiple axes, overcome these limitations since they are able to detect motions other than stride, which allows a more sophisticated correlation of movement to energy expenditure that can be utilized for calculating energy expenditure. The performance of these devices also benefits from the fact that acceleration has a stronger correlation with energy expenditure than motion (e.g., stride) [2]. Positioning of motion-based devices can, however, influence their performance. For instance, it has been shown that tri-axial accelerometers worn on the hip, a common and convenient mounting position, cannot distinguish between sedentary and light intensity physical activities [3].
The underlying algorithms for estimating energy expenditure with multi-axis accelerometers impact their performance. The earliest algorithms, and perhaps the simplest, rely on just counting movement events over a period of time. A more sophisticated approach that has been used utilizes underlying characteristics of the motion data, such as coefficient of variation or other features, to classify the activity. The energy expenditure can then be calculated using correlations for specific activities, which can improve the estimate. Even more sophisticated approaches, such as the use of hidden Markov models and neural networks, are also being used to identify activities from the raw acceleration data. By improving the classification of the activity, these approaches again improve on the estimation by using more appropriate correlations.
There are a number of commercially available accelerometer-based devices. These include uniaxial Biotrainer and Actigraph, and triaxial devices such as Actical and Tracmor. More recent market entries include devices from Fitbit, Nike, Jawbone, and several others. It has been shown that these devices often underestimate energy expenditure for some activities and overestimate it for others, but generally underpredict daily EE [4]. This is most likely due to the differences in energy expenditures that occur for tasks that produce similar movements and accelerations. In fact, performance of accelerometer-based devices has been shown to improve when the activity is set as a variable in the correlation. Despite the shortcomings, accelerometer-based devices are used extensively by consumers and researchers. A comprehensive review of many activity monitors [4] is available.
3.2 Indirect Calorimeters
Measurement of energy expenditure with an indirect calorimeter relies on the known proportionality of oxygen consumption and carbon dioxide production from the substrates used for energy production within the cells of the body. As a result, these systems require capturing at least the volume and oxygen content of the exhaled air. Thus these systems require a face mask or mouthpiece be used to reliably determine the entire volume of exhaled air as well as the necessary sensor(s) to measure the gas concentration(s) in order to derive VO2 (and VCO2). As a result, these devices do not easily fit into the typical image of a body-worn sensor, but instead may more accurately be described as handheld or portable wearable indirect calorimeter systems. Two examples of these types of devices include the Cosmed K4b2 and the MicroLife Bodygem.
3.2.1 Cosmed K4b2
The K4b2 (Figure 5) is a miniaturized high-performance respiratory gas analysis system, in essence a miniature version of a standard laboratory indirect calorimeter that is small and light enough to be carried by the user. It utilizes a face mask with a turbine flowmeter and an air-sampling system with a galvanic fuel cell oxygen sensor and non-dispersive infrared carbon dioxide sensor in an electronics enclosure that is strapped to the body. Specifications for these components are equivalent in performance to laboratory indirect calorimeters, but in a significantly smaller and lighter configuration. Since the K4b2 requires a facemask (or mouthpiece/noseclip), it restricts some of the activities it can be used for, and the length of time it can be used, making it impractical for free-living energy expenditure measurements.

3.2.2 MicroLife Bodygem
A handheld device, the Bodygem (also marketed as Medgem) utilizes an oxygen sensor based on the fluorescent quenching of light by ruthenium. The device is designed for assessment of resting metabolic rate (RMR). Since during rest it is can be assumed that the metabolic substrate will be constant, this allows measurement of just oxygen as there is no need to determine REQ. The device assumes a mixed fuel use and utilizes a fixed REQ of 0.85. This device is limited to measurement of RMR and therefore cannot be considered a device for measuring total EE.
3.3 Direct Calorimeters
A body-worn direct calorimeter by definition must measure the heat flux from the body in order to determine energy expenditure. Historically, two approaches have been utilized for measuring heat flows: water-cooled suits and heat-flow gauges.
3.3.1 Historical Water-Cooled Suits
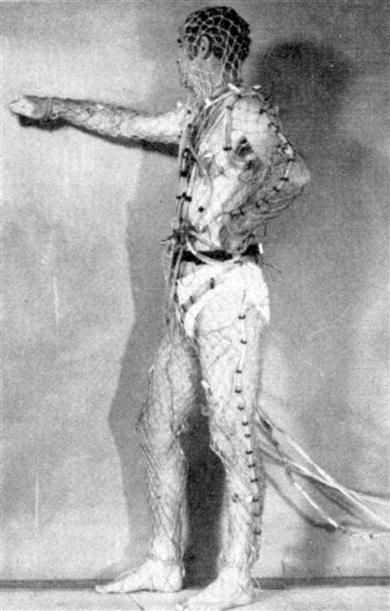
These systems utilize a garment constructed with numerous tubes (Figure 6) and require significant water-chilling equipment. The water circulated throughout the tubing of the suit is warmed by the heat generated within the body. By measuring the temperature of the entering and exiting water and the volume of flow, it is possible to calculate the energy expenditure necessary to warm the coolant. When the heat removed is equal to the metabolic heat generated, the wearer experiences thermal comfort. The suits can be operated outside this paradigm, and studies have used coolant temperatures as low as 5°C. These suits typically often only cover the trunk as full-body coverage can be impractical. A major limitation of this method is that the suit itself disrupts the body’s normal heat flux by occluding the skin. This issue, coupled with the need for the user to be tethered to a device to cool, circulate, and record the temperature of the water, limits their utility for monitoring energy expenditure in a free-living environment. Water-cooled suits do, however, still find use in thermal maintenance systems, such as astronaut spacesuits.
3.3.2 Historical Heat-Flow Gauges
Direct calorimetry systems based on heat-flow gauges fit better into the image of a body-worn device. The heat-flow gauges (HFG), which are easily worn on the skin, work by measuring the small thermal difference that develops when heat flows across an insulator. Measuring the temperature difference and knowing the heat-flow resistance of the insulator allows calculation of the heat flow. Most HFGs utilize a pair of thermocouples (TCs) to measure the temperature difference, wired in series rather than discretely so that the output of the pair of TCs is directly proportional to the temperature difference (Figure 7) and thus the heat flow. This approach is more accurate than measuring the skin and air-side temperatures and calculating the difference. The voltage output of the HFG is then directly proportional to the heat flux, which has units of energy per time per area. There are numerous heat flux units, including joule/sec/m2 (equivalent to watt/m2) and kcal/hr/m2, that are suitable for human calorimetry (1 joule/sec/m2=1 watt/m2=0.8598 kcal/hr/m2=0.317 BTU/hr/ft2).

Since the HFG adds thermal resistance to the surface it’s measuring, thus altering the local heat flow, the thermal resistance of the HFG will generally be kept small to minimize the effect. Minimizing the thermal resistance will, however, decrease the temperature difference across the insulator and thus the voltage difference between the pair of thermocouples. This can render the signal generated too small to measure. To increase the sensitivity, a ladder of TC pairs is typically used, with each TC pair stacked end-to-end like a string of batteries to increase the voltage produced for a given heat flux (Figure 8). This stacked arrangement of TCs is commonly referred to as a thermopile. By using the ladder of TC pairs, signals in the uV per kcal/hr/m2 range can easily be generated from the HFG while still maintaining low thermal resistance.

A number of research studies using HFGs on the body to measure heat flux or as a calorimeter were published in the 1980s and 1990s. In 1983 Layton et al. [5] reported use of an array of commercially available HFGs attached to the body underneath a cooling tube network “suit calorimeter.” A range of heat flows was apparently obtained by altering the temperature of the suit coolant rather than by altering the physical activity of the individuals. The researchers measured heat flux from multiple body segments by both the HFG and the suit calorimeter and calculated an overall heat flux from a sum that weighted heat fluxes based upon body surface area. The output of the HFGs compared to the suit calorimeter showed good agreement. Danielsson and English both published studies in 1990 on regional heat flux measurements using HFGs. Danielsson produced his gauges in-house [6], while English utilized commercially available gauges [7]. These studies focused on the measurement of the heat flux and did not utilize the measurement to obtain energy expenditure. None of these studies mentioned measurement of evaporative heat flux.
The apparent inability of the HFGs used in these studies to measure evaporative losses is mostly due to the geometry of the HFGs that were used. The HFGs that were used were fairly large both in terms of surface area and also in terms of thickness, both of which can alter the heat flow from the site. A large surface area sensor might not be of concern in the typical in vitro applications of HFGs, but when mounted on the body, the occlusion of the skin surface can alter perspiration at the site and potentially alter local skin temperature. By altering skin temperature, the heat flux would also be altered. A thick sensor, by projecting above the surface being measured, will also alter the air currents over the surface and thus the convective heat loss at that site. The errors caused by the thermal resistance of the HFG and changes to convective losses measured from the human body were aptly described in literature of the period by Ducharme [8] (Figure 9). Another potential source of error using a body-worn direct calorimeter is that it can only measure heat flux, not total energy. As a result it must rely on an estimation of the total body surface area to determine total body heat loss.

3.4 Body Media
This commercially available body-worn system has a heat-flow sensor among other sensing modalities. The description of the heat-flow measurement portion of the device states that it uses thermistors on the skin and air side of a “heat pipe” to measure what is described as a convective heat flux. The device also measures galvanic skin resistance, which is influenced by perspiration production that should correlate with evaporative losses, thus permitting an indirect estimation of evaporative loss. In addition, the device utilizes a three-axis accelerometer to measure arm motion. Energy expenditure estimation is performed by proprietary algorithms that combine information from these sensors.
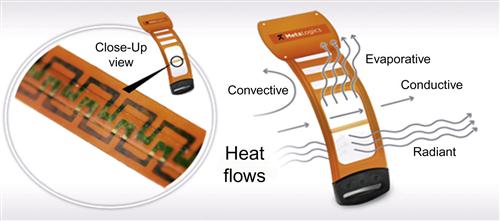
3.5 MetaLogics Personal Calorie Monitor
The MetaLogics Personal Calorie Monitor (PCM) (Figure 1) has been designed as a body-worn direct calorimeter by directly measuring all four forms of heat flux from the body surface. To do so, a number of careful design details were considered. The heat flux gauge in the PCM is designed to minimize its impact on the skin surface and to allow it to effectively measure evaporative losses, something commercially available HFGs are not designed to do and generally are not capable of doing. Several design features allow transport of perspiration onto the impermeable HFG so that evaporative heat loss can be measured. In addition, careful attention was given to the supporting structures of the device to minimize impact on measured heat flux at the site the PCM is worn.
4 Design Considerations
Utilizing a thin and flexible HFG has impacts on several areas of the performance. The flexibility of the HFG allows it to conform to the body surface to help insure reliable contact with the skin. By choosing a 7 mm thick HFG, the alteration to convective losses are minimized. This choice also has the benefit of reducing the thermal resistance of the device. But the original intent for choosing a thin HFG was to minimize the height to facilitate transport of perspiration onto the HFG. The HFG itself is impervious to perspiration, so in order to measure evaporative heat flow, perspiration must find its way onto the surface of the gauge. The millimeters thick HFGs used by Layton, Danielsson, and English present a wall that would block the movement of perspiration onto the HFG surface, thus preventing the HFG from experiencing the same evaporation as the surrounding skin surface. A thinner device would hopefully provide only a speed bump by comparison, allowing an easier movement of perspiration onto the HFG surface.
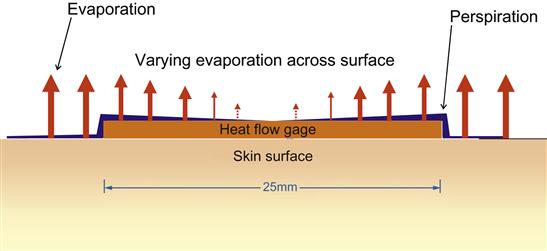
The thickness of the HFG isn’t the only dimension that affects the ability to reliably measure evaporative losses. The other is the width. If perspiration has to migrate across a large dimension, as is found in typical commercially available HFGs (Figure 10), a non-uniform evaporation profile can result – higher at the outer edges compared to the center (Figure 11). To minimize this, the width of the HFG was reduced (Figure 12). The reduced width also minimized the occluded area.

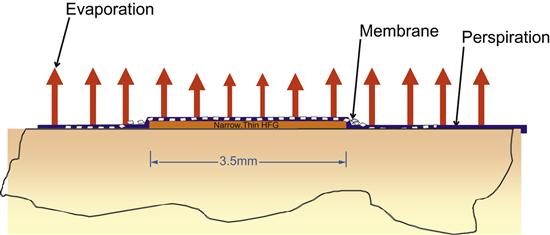
An additional design element proved necessary to ensure perspiration transport onto the surface of the heat-flow gauge, especially at insensible levels of perspiration. This design element took the form of a membrane over the HFG to facilitate the transport of the perspiration horizontally without significantly altering the surface area for evaporation (Figure 13), which combined with the narrow width, would produce a more uniform evaporation profile. This membrane was carefully chosen so that it would neither act like a sponge and hold perspiration nor artificially increase the wicking of perspiration such as fibers with increased surface area (e.g., Coolmax®). This is important since any change that would alter when evaporation took place (delaying and/or prolonging it) would decouple the heat flow sensed from that of the adjacent skin surface changes. Likewise, an increased rate of evaporation would significantly alter the evaporative heat flux from the HFG compared to the skin surface. A number of properties of proposed membrane materials were considered during selection. These include wetting angle, wicking properties, thickness, and robustness. Candidate membranes were then tested by constructing sensors and comparing their energy expenditure output to indirect calorimetry during periods of insensible and frank perspiration. Eventually, a membrane was chosen that is matched to the perfusion rate of the skin itself, and this characteristic was validated through testing.
These design elements produced an HFG assembly that is sensitive to conductive, radiant, convective, and evaporative heat losses. The design of the supporting structures for the HFG also was considered. One of the most significant design features was the height above the skin surface in order to minimize alteration of air currents over the HFG. If the heat-flow gauge was less than a several millimeter thick supporting structure, the microenvironment within the walls would have significantly reduced air movement that would alter convective heat loss. Also, a tall supporting structure would potentially act as a dam, either blocking perspiration outside the sensor area from moving across the HFG or trapping perspiration within the sensing area instead of allowing it to move away. In either case, the heat flux felt by the HFG would not match the surrounding skin surface. The HFG assembly therefore utilizes an extremely thin supporting structure to minimize these effects.
The location of the HFG in relationship to the electronics enclosure was also carefully considered. It was assumed that the enclosure’s occlusion of the skin surface would alter the local skin temperature and also produce an area of increased perspiration around its edges, as perspiration produced under the enclosure would migrate outwards. To minimize these possible effects, the HFG was placed at least 3 cm from the electronics, as can be seen in Figure 1. This also has the benefit of isolating the HFG from any heat generated by the electronics, although these are small considering the micro-ampere current operation of the device. The housing for the integrated circuit components was also kept as small as possible to further minimize any effect on the skin temperature or perspiration near the area of heat flux measurement.
Finally, the calculations of energy expenditure needed to reflect that the heat flux measured by the PCM (kcal/hr/m2) needs to be converted to rate (kcal/hr) by multiplying by the body surface area (BSA). Also, since the heat that is measured is only the portion of the ATP derived energy that is dissipated as heat, the measured heat output must therefore be corrected for the amount of energy that produces work rather than heat, i.e., the metabolic efficiency (ME). Therefore, the PCM calculates energy expenditure by multiplying the measured flux times the BSA times ME:
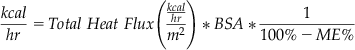
Assuming metabolic efficiency of 25%, the ME correction factor would be 1.33.
5 Performance
In a properly designed device, the active area of the HFG should have the same heat losses, including evaporative losses, as the surrounding skin surface, which results in the skin and sensor having the same temperature. When infrared images of the sensor mounted on the skin surface were examined, the active area was not discernable but the electronics housing was easily seen (Figure 14). This was validated through all levels of activity, including during heavy exercise and frank perspiration.

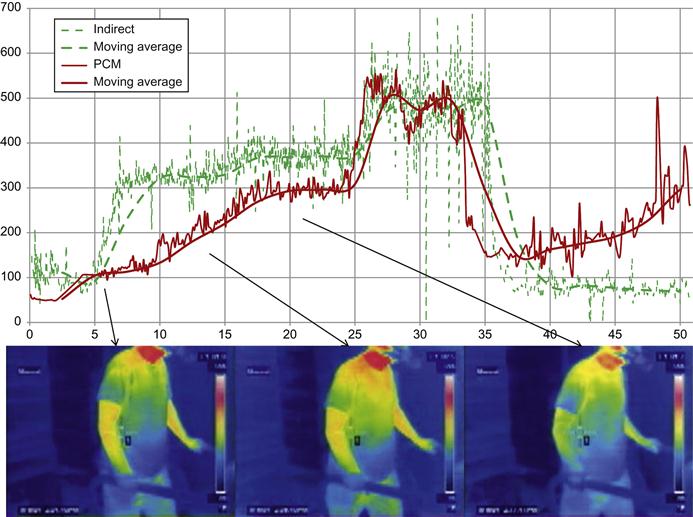
Infrared images also validated that the PCM was measuring evaporative losses. During exercise, it was observed that the skin surface for many participants would initially warm from resting temperatures, then fall due to the onset of perspiration (Figure 15). If the sensor only measured convective and radiant heat flux from the exposed skin surface (since exposed to air, conductive losses would not be occurring) the sensor output would fall due to the cooling. However, the output of the HFG increased during the cooling phase, indicating that it was detecting the evaporative heat flux that was cooling the skin surface. It was also noted that on the IR images the active area of the sensor was essentially invisible, which indicates that its surface was matching that of the surrounding skin.
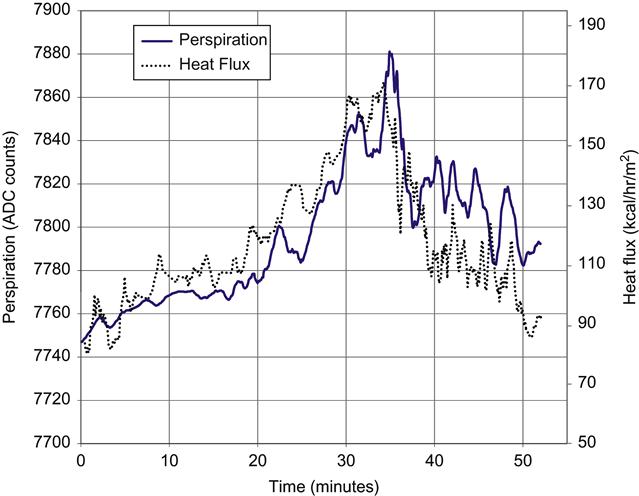
The sensor output was also compared to the rate of perspiration production using a custom transepidermal water loss instrument that measured perspiration production by measuring the increase in humidity in an air stream passing over the skin surface. The comparison had to be limited to the onset of frank perspiration since presence of visible unevaporated perspiration indicates evaporation has reached maximum levels at the ambient condition. The results of this testing are shown in Figure 16. The heat flux (in kcal/hr/m2) and perspiration (in arbitrary units) both independently scaled to align the plots. As can be seen, the heat flux tracks the rate of perspiration.
During development, comparisons were conducted against indirect calorimetry for relatively short trials of approximately 45 to 60 minutes. The typical trial consisted of a period of rest, followed by 2 or 3 levels of activity and a final period of rest. This type of testing was used to evaluate and select the evaporative membrane. Two activities, walking/running on a treadmill and pedaling a stationary bike under various resistance loads, were used most commonly, although more treadmill tests were conducted since it was easier to get consistent activity levels across trials and subjects compared to the stationary bike.
An additional goal of the early validations was to determine if a single sensor located at a single body site could be utilized since the intent of the PCM development was a consumer product. For these studies, the subjects were fitted with multiple sensors typically located on the chest and back, the upper arm and thigh, but also in some cases additional sites including forearm, calf, and forehead. These studies showed that a sensor mounted on or near the trunk, specifically on the chest or back, upper arm or thigh, showed better correlation with indirect calorimetry. The upper arm was chosen over the other sites for a number of reasons, including difficulties with maintaining position on the thigh, and actual or perceived issues with wearing a chest strap.
6 Validations
6.1 Comparison to Metabolic Cart
An early study [9] compared a prototype PCM to indirect calorimetry for several levels of energy expenditure using treadmill, stepping, and stationary bike. In this study, seven healthy male subjects (age=21.57±5.06 years, BMI=22.37±1.91 kg/m2) wore sensors on the upper arm, thigh, chest, and back, and the activity periods were long enough for the heat flux to reach near steady state. The area-weighted sum of the sensors at steady state was then compared to the indirect calorimeter output at the same time point. The PCM showed good correlation to the metabolic cart for walking (44.42±6.12 (IC) vs. 42.46±16.89 kcal (PCM)), stepping (47.26±5.61 (IC) vs. 43.23±18.48 kcal (PCM)), and cycling (43.06±4.65 (IC) vs. 43.08±25.85 kcal (PCM)).
Another early study [10] with 20 subjects (age=21.5±3.38 years; BMI=23.3±3.55 kg/m2) included walking, stepping, cycling, and sliding. Two activities, stepping and sliding, were chosen because they are problematic to accurately measure energy expenditure with the available devices using accelerometers. This study utilized a single PCM mounted on the upper arm for measurement. The sensor was calibrated utilizing treadmill data from several of the subjects. When this calibration was applied to all data from the subjects, no significant differences between the indirect calorimeter and the PCMs were found for all four activities (Figure 17).

6.2 Comparison to Room Calorimeter
Since the PCM relies on thermal balance, and the PCM and metabolic cart measure distinct aspects of energy expenditure with very different time frames, comparison of the PCM to the metabolic cart may not always be favorable. The thermal lag means that the PCM is more likely to reflect earlier activities (i.e., activities that occurred prior to the session) than the indirect measurement, which could cause the PCM to over-report. Similarly, thermal storage can delay release of heat generated during an activity, causing the PCM to under-report energy expenditure. Ideally, longer time periods for the comparisons would allow thermal equilibrium to be achieved. However, most subjects don’t tolerate the mask or mouthpiece required for the metabolic cart for more than one hour. A room calorimeter, on the other hand, allows for much longer sessions since the subjects are not required to wear a mask. Access to a room calorimeter was provided by the University of Colorado at Denver’s Anschutz Medical Center, allowing validation to be performed across longer timeframes [11].
A small number of subjects from an ongoing study at the UCD metabolic chamber were fitted with the PCM (identified as LifeChek calorie sensor) and were housed in the room calorimeter for a 24-hr period. During this time, there were several short exercise bouts, but otherwise they were mostly sedentary. Due to durability issues with these early prototype devices, not all subjects were able to wear the PCM for the full 24-hr period (average time was 17 hrs). There was good correlation (r=0.98) in total EE between room and PCM (Figure 18). In addition, minute-by-minute comparisons were made, and the measured EE for the PCM and room for one subject are shown in Figure 19.


Another study at UCD [12] examined the performance in thermal neutral conditions. For these trials, 34 subjects were in the room calorimeter for five hours wearing clothing appropriate to the thermal neutral condition. There were two 20-minute bouts of walking on the treadmill at one hour and three hours after entry into the room. The performance in the thermal neutral condition showed an overall good correlation with the room (Room mean EE 547.0 kcal and PCM mean EE 546.8 kcal).
There are additional studies ongoing and planned to address several aspects of device performance. This includes testing at different ambient temperatures and longer intervals. There will also be studies on the effect of clothing.
7 Conclusion
The accurate measurement of energy expenditure in a free-living environment is something that has been highly sought after by both researchers and clinicians who understand the need for accuracy, especially when using this data in clinical interventions such as weight-management programs. However, it is well documented in the literature that current body-worn devices are lacking in precision for a variety of reasons, as described above. This is especially true for those devices that estimate energy expenditure by relying on measurement of activity. Of the two methods that measure energy expenditure, it appears that only direct calorimetry may be the most practical for consumer use.
The MetaLogics Corp Personal Calorie Monitor was designed to measure all four forms of heat flow from the body. As such, it has the potential to be the first body-worn direct calorimeter commercially available that is suitable for accurately measuring total energy expenditure in free-living environments. By measuring heat loss from the body, even from a single site, it is able to measure the energy expenditures from activities that accelerometer-based systems fail to detect. However, its reliance on thermal balance places its temporal resolution somewhere between indirect calorimeters and doubly labeled water. Activity bouts are detectable, but may not be discretely measurable due to time delays between heat production and heat losses. Other potential sources of error using a single HFG can be temporary disturbances of local environment, which do not represent the entire body, and which can be caused by events such as leaning against a cold surface or occluding heat flux in the are of the HFG with a heavy insulator (e.g., during sleep the gauge is positioned between the users skin and the mattress for an extended period and heat flux is reduced in that particular are of the body). Similarly, adding or removing clothing may temporarily disturb an HFG. However, the clothing, if appropriate for the thermal conditions, will generally simply allow the body to maintain a comfortable skin temperature at a given heat loss. Future studies are planned to validate this.
Glossary
Heat flux the amount of heat energy transferred across a surface expressed as a heat rate per unit area. In SI units this is Watt/m2 but can be expressed in other units including kcal/hr/m2
Heat-flow gauge any of a number of transducers that produce an electrical signal proportional to heat flux through the device.