Fundamentals of Wearable Sensors for the Monitoring of Physical and Physiological Changes in Daily Life
Masaaki Makikawa1, Naruhiro Shiozawa1 and Shima Okada2, 1Ritsumeikan University, Kyoto, Japan, 2Kinki University, Osaka, Japan
This chapter provides an overview of wearable sensors for the monitoring of physical and physiological change in daily life, their fundamentals, and applications. The following three cases need to be considered for the applications of a wearable biosignal measurement system: continuous and long-term measurement for accident prevention (e.g., an alarm for heart attack), once-daily measuring for the evaluation of health condition, and biosignal monitoring as the machine interface. In long-term monitoring, the biosignal measurement system must be small in size, with minimal power consumption, and portable. However, in the case of sleep monitoring, the biosignal sensors should not be wearable, but incorporated into a bed. This chapter presents several kinds of wearable and ambient sensors for the monitoring of physiological and physical changes in daytime and nighttime.
Keywords
Physiological sensor; physical sensor; daily life monitoring; wearable sensor; house-equipment sensor
1 Introduction
This chapter provides an overview of wearable sensors for the monitoring of physical and physiological changes in daily life, including their fundamentals and applications.
Here arises one question: Should all physical or physiological sensors be wearable? Table 1 shows the classification of biological signal monitoring by its measurement frequency. As shown in this table, many types of biosignals need not be measured continuously for 24 hours. Almost no user may want to know his/her body weight change at each step while walking. In addition, the reasons for monitoring are not limited to “health check to find any signs of abnormality,” but vary with application. For example, “checking the level of fitness,” “acquiring changes in disease condition in daily life,” and “as a part of the clinical diagnosis and/or treatment” are all parts of clinical monitoring. In the workplace “monitoring of health condition to prevent accidents can also be an important aspect of ambulatory monitoring. Besides health-related monitoring activities, “quantitative evaluation of comfort/discomfort for new industrial products” and “human-machine interface for the visually or auditory handicapped” can be easily imagined as applications of wearable sensors. Every day wearable sensor technology becomes more important in our daily lives.
Table 1
Classification of Biological Signal Monitoring.
| Monitoring Frequency | Applications | Monitoring Purposes |
| Once a day – Once a year | Physical examination, Periodic medical check | Health check to find any sign of the abnormality |
| A few minutes every day | Blood pressure manometer | Health check to find any sign of the abnormality |
| A few hours every day | Step counter, Fitness monitoring | Check of the attainment level of health goal |
| Monitoring of cardiovascular system, Sleep meter | Health check to find any sign of the abnormality | |
| Evaluation of clothing and shoe | Quantitative evaluation of comfort/discomfort | |
| Always during being active | Prediction of fall | Attack monitoring for accident prevention |
| Detection of heart abnormality | Health check to find any sign of the abnormality | |
| Detection of drowsy driving | ||
| Detection of gas leak | ||
| Full time monitoring for a certain period | Holter monitor | Provision of daily health data for clinical diagnosis |
| Quantitative evaluation of drug effect | Monitoring of disease condition for continuous treatment | |
| Almost Always | Brain-machine interface | New human-machine interface |
Figure 1 shows the current situation of a wearable digital biological monitoring device and its near future. As shown in Figure 1(b) the goal of this type of mobile monitoring system is to realize a “virtual doctor” system that watches our health 24 hours and sends emergency information to a real, responsible doctor. Figure 1(a) shows a current research or commercially available smartphone-based health-monitoring device. Smartphones are widely used, and it is possible to take advantage of their capabilities for mobile health monitoring by adding biological sensors. Here, the sensor is interfaced to the smartphone through a popular digital interface such as USB. Hence, digitization of biological sensor data is important.

2 Wearable Sensors for Physiological Signal Measurement
This section describes frequently used biosignal sensors for health monitoring in daily life. In addition, motion sensors and physical activity sensors are introduced in other chapters of the book.
2.1 Fundamentals of the Three Types of Electrodes and ECG Monitoring by Non-Contact Electrodes
Electrodes are essential in the measurement of bioelectric phenomena, such as heart activity and muscle activity. Table 2 shows the classification of electrodes. There are three types of electrodes: the most popular “skin electrodes,” “capacitively coupled electrodes,” which have recently become practical, and “dry electrodes,” which have intermediate properties between the skin electrodes and capacitively coupled types. Description of “needle electrodes” is omitted here, because this type is invasive and imposes unnecessary pain to the user.
Table 2
| Type | Use | Defect |
| Skin electrode | This is most popular electrode and is used to measure ECG, EMG, and EEG. Electro-conductive paste is needed to keep constant adhesion between electrode and skin. | Skin irritation caused by paste. |
| Drying of paste during long time measurement. | ||
| Capacitivey-coupled electrode | This is reaching a practical level in recent years. ECG can be measured through clothing | This cannot be used in case of air existing between electrode and skin |
| Dry electrode | This has intermediate properties between capacitively-coupled electrode and the skin electrode. Paste is not required and skin irritation is negligible. | Adhesion to the skin should be assured. |
| Electrodes on the skin induce discomfort of the subject. |
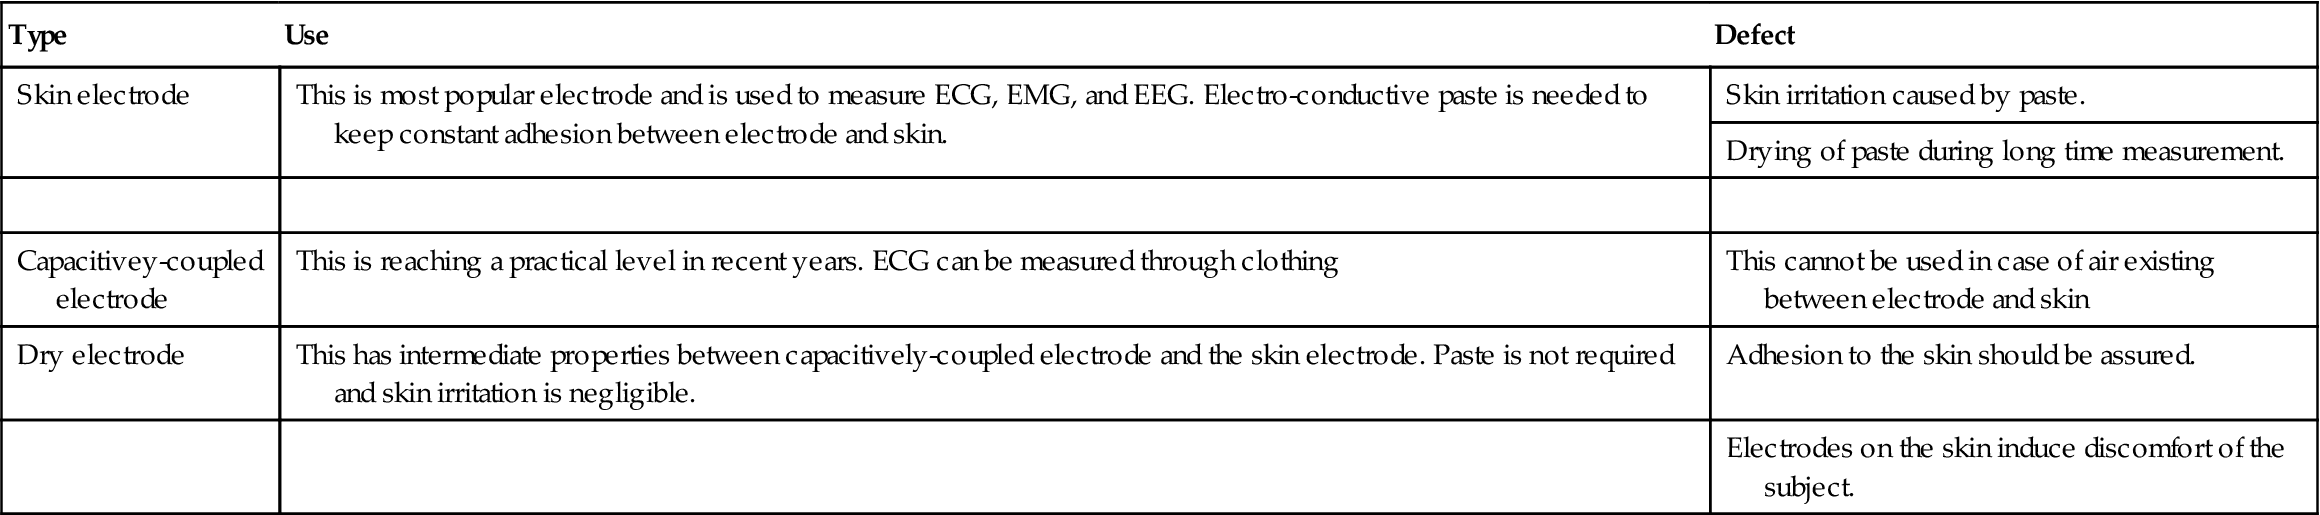
Figure 2 shows an equivalent electrical circuit of skin, capacitively coupled, and dry electrodes. As shown in this figure, the skin electrode can be roughly compared to a resistor connecting skin with the signal cable, although the actual circuit is more complicated. For a capacitively coupled electrode, a capacitor is the coupling component, and for a dry electrode a parallel resistor and a capacitor comprise the coupling circuit. As shown in Figure 2(c), there are many small projections on the surface of the dry electrode to have better adherence because an electro-conductive paste is not used for this electrode. This dry electrode was developed to monitor a biosignal for a long time without any skin redness or skin irritation caused by the paste or drying of the paste itself.

An illustration of the operating principle of the capacitively coupled electrode is shown in Figure 3. As a capacitor in electromagnetism, the principle of this electrode is that charges are generated on the metal surface in response to the electrical fluctuations occurring at a distance. In practice, a capacitor can be assumed between metal plates and electrical body signal source such as the heart.
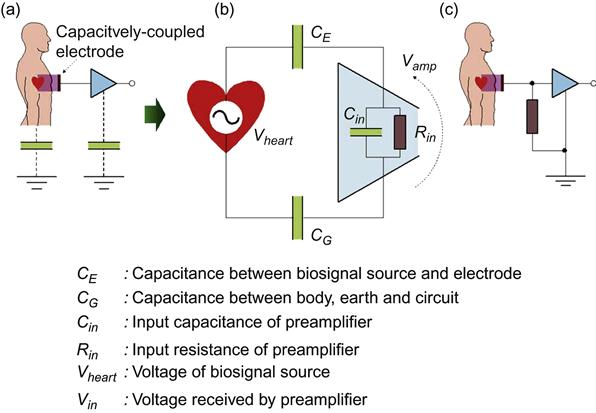
Figure 3(b) shows the equivalent circuit of a system consisting of body signal source ![]() , input impedance of a preamplifier, (resistance:
, input impedance of a preamplifier, (resistance: ![]() , capacitance:
, capacitance: ![]() ), capacitance between a capacitively coupled electrode and signal source
), capacitance between a capacitively coupled electrode and signal source ![]() , and capacitance
, and capacitance ![]() between body and ground. Then the voltage generated at the input of preamplifier
between body and ground. Then the voltage generated at the input of preamplifier ![]() is calculated as
is calculated as
(1)
Here, if the input resistance of preamplifier is large enough, and capacitance is small enough, i.e., ![]() ,
, ![]() , then the voltage
, then the voltage ![]() becomes almost equal to the voltage of signal source
becomes almost equal to the voltage of signal source ![]() as shown Eq. (2), and
as shown Eq. (2), and ![]() can be taken out as
can be taken out as ![]() .
.
(2)
Input impedance and capacitance of the op-amp, which we used in our laboratory, are 10 TΩ and 1 pF. Such input impedance is orders of magnitude greater than that of a representative commonly available op-amp such as 741 (2 MΩ and 1.4 pF, respectively). Technologies have remarkably progressed and now allow for indirect measurement of bioelectric signals.
The limitation of the capacitively coupled electrode is that the static electricity generated by the friction between clothes and electrodes accumulate on the surface of the electrode, and the amplifier’s output voltage is often saturated. To avoid this saturation, a resistor is inserted between the electrode and ground to release this static charge, as shown in Figure 3(c). This resistor breaks the relation shown in Eq. (2). Therefore, the selection of the resistor is rather complex. In addition, the capacitor formed between skin and electrode should be at least 30 pF based on our experiences or the biosignal will disappear in the environmental noise.
Figure 4 shows examples of ECG measured by capacitively coupled electrodes (red) and ECG measured simultaneously by skin electrodes (green); Figure 4(a) and (b) show the measurement with bipolar leads using a differential amplifier, and all electrodes are the capacitively coupled type. No ground electrode was used in the case of Figure 4(b). Figure 4(c) shows the measurement with a single electrode and a single-ended amplifier. While the signal in Figure 4(c) is noisy, the peaks of R-wave are still detectable. As shown in this figure, heart activity can be acquired by one metal plate set near the human body. From our experiences, a 1 mm layer of air between the skin and the electrode makes the measurement impossible, because the dielectric constant of air is slightly greater than that of vacuum or 1. However, measurement is possible when some dielectric material with a higher dielectric constant (such as cloth or plastic film) exists between the skin and the electrode. For example, we could measure ECG if a bundle of copy paper of 5.0 mm thickness is placed between the skin and the electrode.
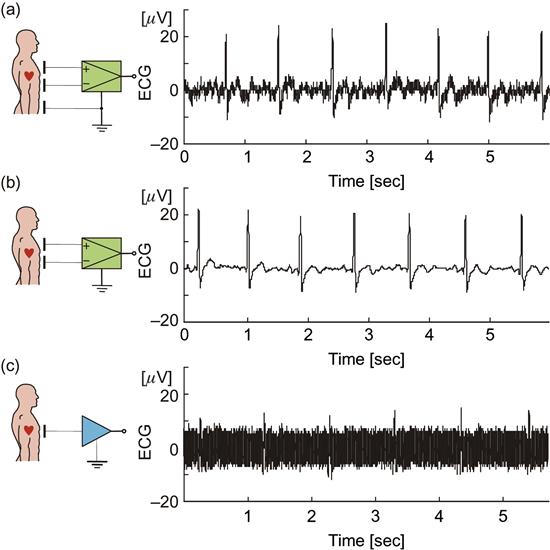
Figure 5(a) shows a configuration of a system to measure ECG of a driver while he is driving. An electro-conductive cloth is placed on the surface of the driver seat as an indirect electrode, i.e., capacitively coupled electrode, and a metal band is attached around the steering as a ground electrode. Thus, in this system ECG is measured and amplified by a single-ended type amplifier while the subject is wearing normal clothing and driving a car. The seat surface is the place where the best contact between the skin and the electrode is expected while driving, and steering is the only place where direct contact between the body and electrode is expected. Moreover, the environment inside the car is noise-less electrically as in a shielded room, and a single-ended amplifier can be used. Figure 5(b) shows an example of ECG measured by this system. The middle plot is the original data and magnified plots of two periods are shown above and below. The top plot is the plot when the car was on a bumpy road, and the bottom plot is when the driver turned the steering wheel. The colored plot shows the processed data using digital band pass filter of 10 to 60 Hz. As shown in this plot ECG of a driver can be measured except at the moment when the driver changes his hand to grip the steering wheel. At this moment, noise contaminates the ECG data because the ground is unstable.

2.2 Biosignal Sensors for Cardiovascular System Monitoring
Sensors for measuring the change in physiological condition in daily life will be described in this section. A wide range of biosignals should be measured in “physiology,” but not so many kinds of biosignals are necessary to be monitored in daily life. Here, sensors for the measurement of blood pressure, pulse volume, blood flow, SPO2 (saturation of peripheral oxygen), respiration, and body temperature are described.
2.2.1 Measurement of Blood Pressure
Blood pressure, i.e., the pressure in the artery, pulsates periodically in response to the heartbeat. Hypertension is the cause of cardiovascular diseases, and is considered one of the three major underlying causes for stroke, together with diabetes and hypercholesterolemia. Therefore, the importance of measuring blood pressure has been recognized for a long time, and it is considered one of the four clinical vital signs. Blood pressure measurement is divided into two methods: the indirect method to measure the blood pressure without invading the body and the direct method to measure by inserting a catheter into an artery. The direct method is usually not suitable for routine blood pressure monitoring.
Table 3 shows the representative indirect blood pressure measurement methods. The principle of these methods is the same: the arterial pressure is measured by increasing and decreasing the pressure of an inflatable cuff (Riva-Rocci cuff) wrapped around the arm. The first trial to measure blood pressure, which is omitted in the table, was conducted by E.J. Marey in 1876. He measured the systolic pressure by detecting the heartbeat transmitted through the cuff.
Table 3
Various Indirect Blood Pressure Measuring Methods
| Metrology | Designer | Systolic Blood Pressure | Average Blood Pressure | Diastolic Blood Pressure | Sphygmotono-gram |
| Cuff-oscillometric method: Detects blood vessel pulsation vibration that is propagated to the cuff | Marey, 1876 | Estimable | Estimable | Non-applicable | Non-applicable |
| Palpatory method: Detects blood vessel pulsation of the distal side of cuff | Riva-Rocci, 1896 | Measurable | Non-applicable | Non-applicable | Non-applicable |
| Flash method: Detects the color change of the skin | Gaertner, 1899 | Measurable | Non-applicable | Non-applicable | Non-applicable |
| Auscultatory method: Detects a change in tone Korotkoff sound that occurs within the artery. Mercury sphygmomanometer. | Korotkoff, 1905 | Measurable | Non-applicable | Measurable | Non-applicable |
| Oscillometric method: Detects vibration of the cuff instead of Korotkoff sound. Home blood pressure monitor | Mauck, et al. 1980 | Measurable | Non-applicable | Measurable | Non-applicable |
| Ultrasound Kinetoarteriography: Measured by ultrasound changes in blood flow velocity | Ware & Laenger, 1967 | Measurable | Non-applicable | Estimable | Non-applicable |
| Volume-Oscillometric method: Detection of volume pulse wave just below the pressurization portion | Yamakoshi, et al., 1982 | Measurable | Measurable | Estimable | Non-applicable |
| Arterial Tonometry: Utilization of the pressure of equilibrium through the artery wall | Mackay, 1962 | Estimable | Estimable | Estimable | Measurable |
| Volume-compensation method: Controlled to maintain a no load condition is always the artery wall | Yamakoshi, et al., 1980 | Measurable | Measurable | Measurable | Measurable |

Figure 6 shows the measurement principle of the “volume compensation method.” As shown in the figure, a cuff is also used in this method, but the cuff pressure generating circuit and a control circuit for precisely controlling the cuff pressure are different from the widely used auscultatory method. Blood volume in the finger is detected by the optical sensor and LED and the blood volume is kept constant by varying the cuff pressure, which should match the variation of blood pressure.

Figure 7 introduces a blood pressure measurement method using a pulse wave and ECG. The relationship between flow rate and its velocity is used as the operating principle of this method, which is well known in fluid dynamics. For example, water flow rate in a water pipe is proportional to water pressure. Therefore, blood pressure can be estimated from the velocity of blood flow. Figure 7 shows a method for estimating blood pressure by simultaneous measurement of the pulse wave and ECG. As shown in Figure 7(a), blood-flow velocity can be known from the peak time of the R wave of ECG indicating the timing of blood flow from the heart ventricle, and the peak time of the pulse wave arrival time of the blood flow to the periphery. Figure 6(b) shows the relationship between the pulse wave propagation velocity and systolic blood pressure. As shown in this figure, the propagation velocity of the pulse wave increases according to the blood pressure. Figure 7(c) is a blood pressure measuring watch a Japanese company has been making commercially available. This watch is equipped with a pulse-wave sensor consisting of an optical sensor and light source, and also equipped with one electrode on the face and another on the back. ECG can be measured when the user puts his/her hand on the surface electrode.

However, there is a serious problem with this method. If the artery is modeled as a rigid pipe, it is possible to determine the absolute value of the systolic blood pressure. However, an artery is actually an elastic body, and its elastic modulus changes according to arterial sclerosis, which can significantly affect the blood flow velocity. This method can be used if there is little change in the artery characteristics due to aging and appropriate calibration is done for each user. This method is not very practical for daily monitoring, but it can be used for chronic monitoring when one is only interested in the changes in blood pressure and not its actual value.
2.2.2 Plethysmogram and Oximeter
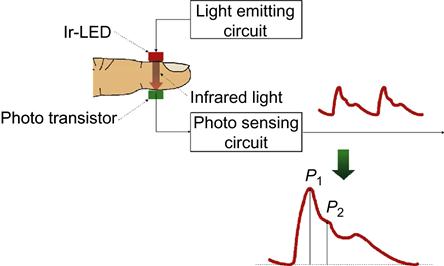
The pulse wave is composed of a pressure wave generated by the contraction of heart ventricle and its reflection from the periphery, which is different from the blood flow. Blood-flow velocity in the aorta is about 1 m/sec, and the velocity of the pulse wave is about 10 m/sec, i.e., 10 times faster than blood flow itself. Figure 8 shows the configuration of a plethysmograph. As shown in this figure, the actual pulse wave is measured as the volume change of blood at the capillaries using near-infrared light. This figure demonstrates plethysmography at the fingertip, in which infrared light emitted by an LED is transmitted through the fingertip and received by a phototransistor on the opposite side. Because hemoglobin in the red blood cell absorbs infrared light well, a signal synchronized with the heartbeat can be obtained as output of the phototransistor (Figure 8). Here, ![]() is the pressure wave generated by the heartbeat and
is the pressure wave generated by the heartbeat and ![]() is its reflection wave from the periphery. Since the reflection wave
is its reflection wave from the periphery. Since the reflection wave ![]() becomes large with respect to the pressure wave
becomes large with respect to the pressure wave ![]() as the arteries become hardened, the pulse wave is often used as an indicator of arteriosclerosis.
as the arteries become hardened, the pulse wave is often used as an indicator of arteriosclerosis.
The measurement path commonly used for plethysmogram on fingertip is shown in Figure 8. Earlobe, forehead, and wrist are also used as measurement sites in adults, and toes, palms, and ankles are of interest for newborns.
Plethysmography utilizes the fact that blood absorbs infrared light. How about light of a different wave length? Figure 9(b) shows the extinction coefficient of deoxyhemoglobin and oxyhemoglobin as a function of wavelength. Hemoglobin is a protein having an iron atom in the center, which carries oxygen and makes hemoglobin red. As shown in Figure 9(b), the extinction coefficients of deoxyhemoglobin and oxyhemoglobin are different. Pulse oxymetry was developed using this phenomenon to measure the oxygen saturation in the blood. In this system two sources of light of different wavelengths, i.e., infrared light of 910 nm and red light of 660 nm, are used. The oxygen saturation in the blood can be estimated from the difference in absorption of these two wavelengths. By looking at the ratio of the amplitudes of pulses at these two wavelengths, one can determine the relative oxygen saturation of the hemoglobin in the blood in the capillaries being illuminated. Pulse oxmetry is used for not only patient management in hospitals during surgery, or ICU, but also for home oxygen therapy and mountain climbing.

2.2.3 Respirometry
Respiration rate is clinically important as it is also one of the four vital signs. Breathing measurement or respirometry in daily life is classified by two different categories of measurement. One is the measurement in daily activities such as during working, and the other is the measurement of breathing during sleep. The respiration sensor is different according to the purpose of the measurement and where it is being done.
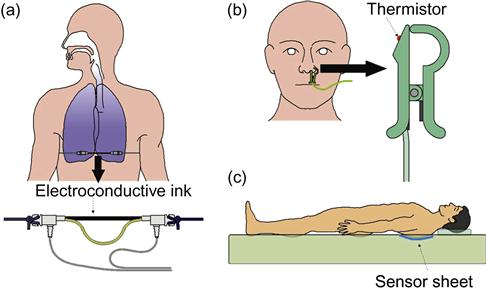
A respiration measurement band shown in Figure 10(a) and respiration pickup sensor in Figure 10(b) installed in the nostril are used for breathing pattern monitoring. The respiration measurement band is composed of an elastic tube filled with conductive ink and a string, and it is wrapped around the rib cage to record changes in the chest circumference due to breathing. A thermistor is set at the tip of the nasal respiration sensor. The thermistor senses the change in the temperature due to air intake and exhalation. Both sensors measure the actual respiration waveform from which the respiration rate and apnea can be determined. Therefore, these sensors are popular in daily monitoring. A biometric sensor sheet shown in Figure 10(c) was developed to monitor the respiration during sleep. Respiration monitoring during sleep should be unrestrained and unconscious and the sensor should be soft, flexible, and can be installed in a pillow or under the sheets. Details of this sheet sensor will be described in the next section.
2.2.4 Measurement of Body Temperature
Temperature is the third of the four vital signs in clinical medicine. Temperature sensors are classified into contact type, e.g., thermistor and thermocouple, and non-contact type, which senses infrared light emitted from the body surface based on the principle of black-body radiation. Figure 11 shows a thermistor most popular in body-temperature measurement. The thermistor utilizes the property that resistance of semiconductor or metal oxide changes with temperature. As shown in Figure 11(a), the thermistor is small, resin-molded, and inexpensive, and hence thermistors are commonly used to measure core body temperature by rectal placement during routine activities of human subjects. A bridge circuit shown in Figure 11(b) is commonly used for temperature measurement by a thermistor.

The core body temperature in humans is different from body surface temperature. Human beings are homeothermal animals, and the core temperature is controlled to be nearly constant. On the other hand the skin surface temperature varies greatly depending on the environment. Therefore, core temperature is required to be measured in daily monitoring. Rectal temperature is representative of the core temperature, but this measurement is not comfortable for long-term observation. The eardrum temperature, gullet temperature, sublingual temperature, and axillary temperature are often selected as related to core temperature. However, considering temperature monitoring in daily life, the gullet, sublingual, and axillary temperature measurements are invasive and sensitive to body motion. Hence, an earphone-type eardrum temperature monitoring device is now available commercially.
Figure 12 shows another representative temperature sensor, i.e., a thermocouple and a thermopile, which is an application of several thermocouples. As shown in Figure 12(a), when both ends of two different kinds of metal wire are connected, thermally a small voltage is generated by the Seebeck effect when a temperature difference exists between two connected ends of wires. This is the measurement principle of the thermocouple. However, this sensor is difficult to use in daily monitoring. Figure 12(b) shows the structure of a thermopile, in which about 100 thermocouples are sequentially set to attain high sensitivity to small increases of temperature at the hot junction. This sensor is small, lightweight, low power, and is suitable for daily monitoring. Figure 12(c) shows a wearable body temperature monitoring device that senses the tympanum temperature by a thermopile set inside.

2.3 Biosignal Sensors for Sleep Monitoring
Human beings spend one-third of each day sleeping, and sleep is essential for people to maintain healthy physical functions. Daily long-term monitoring of physical condition during sleep and sleep quality is important for health management. This section introduces the ballistic cardiogram, non-contact ECG, sheet type respiratory and body motion sensors, and video camera monitoring.
2.3.1 Ballistic Cardiogram
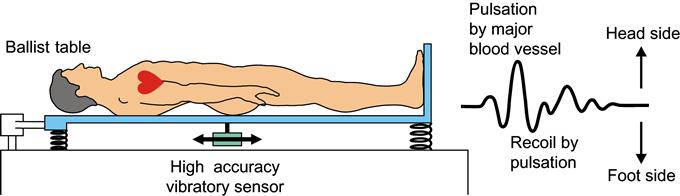
A number of methods have been proposed for the non-restrictive measurement of the resting heart rate in a lying position, along with detection of resting heart rate and respiration by changes in electrical capacitance. In recent years, many new sensors have been developed to offer comparatively easy operation and installation. Methods developed to date include: non-restrictive measurement of respiratory and heart rates from the internal pressure changes in an air mat affected by body motion due to respiration or heart activity, and non-restrictive measurement of respiratory and heart rate using sheets or pillows with a wire-shaped respiratory pickup sensor attached to an air mat. These methods are known as “ballistocardiography”. Ballistocardiography is a method of measuring delicate body motions caused by heart activity and blood movement in blood vessels. In general, the motion transmitted to the back of a subject in a supine position is measured by ballistocardiography as shown in Figure 13. The basic problem with ballistocardiography is that it is influenced by body weight and motion, movement of organs inside the abdomen, and the distortion of fat and musculature.
2.3.2 Non-Restrictive Heart-Rate Measurement
Long-term monitoring of heart rates is important for health management. Heart rate is the fourth clinical vital sign. An analysis of heart-rate variability can facilitate the early discovery of a variety of illnesses and health conditions. For example, high blood pressure, diabetes and obesity are accompanied by a decrease in heart-rate variability, while psychological stress, lack of exercise and other factors are also known to affect heart-rate variability. Research has also been conducted in relation to the prognosis of heart diseases, particularly following myocardial infarction. In many cases, researchers analyzed heart-rate variability by using the resting heart rate because the resting heart-rate variability can be an index of sympathetic or parasympathetic dominance. To analyze heart rate for such prognosis of lifestyle-related diseases, we should measure the long-term resting heart rate. In this section, we show a non-restrictive measurement method using only an acceleration sensor set inside a down quilt. This method was easy for use at home.
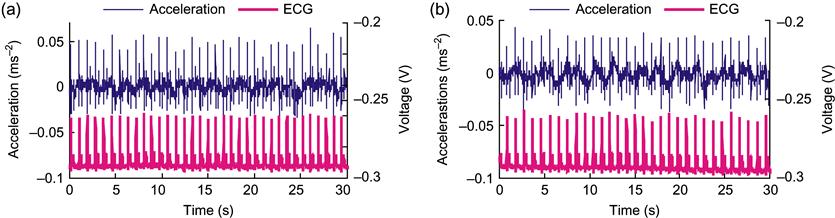
We introduce the system to achieve the method of non-restrictive measurement of resting heart rate in a lying position. Figure 14 shows an outline of the experimental system. A small acceleration sensor is installed in the middle layer of a down quilt. When the subject lies down and is covered with the down quilt, the minute mechanical vibrations resulting from the subject’s heart activity are transmitted to the down quilt, and the acceleration sensor picks up this vibration. The acceleration sensor is sewn into the down quilt directly above the left side of the anterior chest, which is the location of the heart. This system employs a piezoelectric acceleration sensor and was set as its sensitivity axis (z-axis) oriented to the Earth’s gravity. As shown in Figure 14, the sensitive axis of the acceleration sensor installed in the down quilt is always perpendicular to the surface of the quilt, so the sensitive axis of the acceleration sensor still faces the heart when the subject is in a lateral position. The sensitivity of measurements using this experimental system depends more on the distance from the heart to the sensor than on the subject’s position.

An image of the acceleration sensor and its features are shown on the left half of Figure 15. The right-hand side of Figure 15 shows the specifications of the piezoelectric acceleration sensor (MA3-01Aa, Micro Stone Co., Ltd.). This table indicates that the sensor has a built-in amplifier and a comparatively high-sensitivity output of 1.9 V per 1 ms−2 of acceleration. This sensor also features high linearity and a response frequency over 0.8 Hz, so it prevents the heart activity vibrations from overlapping with the vibration caused from respiration. Furthermore, the sensor is small and light, so even when installed in the down quilt, it did not disturb the subject, and a low-consumption current of 0.5 mA allows for long-term measurements under battery power. The original resonant frequency is between 10 and 15 KHz, which is sufficiently high in comparison to the frequency of mechanical vibrations generated by the heart’s activity. Heart activity data obtained with this acceleration sensor was taken at 200 Hz by a 12-bit A/D conversion board (PCI-3153, Interface Corp.).
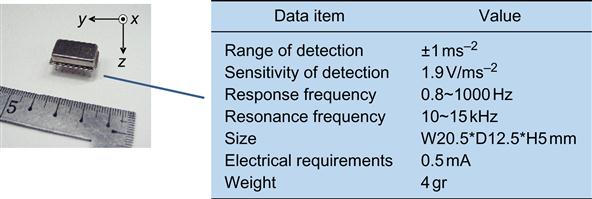
Figure 16 shows an example of a detected heart-rate signal in a supine position by using the system and ECG for 30 seconds. As shown in this graph, high-frequency noise overlaps the heart-rate signal by the experimental system, but the peak is obtained at the same position as the ECG-R wave.
Using this method makes it possible to achieve non-restrictive heart-rate measurement throughout the night. Figure 17 shows the calculated R-R interval during sleep.

2.3.3 Sheet Type Respiratory and Body Motion Sensor
From the standpoint of ensuring the safety of patients in hospitals, a system to monitor the condition of sleep in patients is becoming necessary. Sleep-monitoring systems have been developed in recent years that are useful for managing physiological conditions by measuring the respiratory movement and heart rate of sleeping patients using highly sensitive pressure sensors placed on the bed. These technologies are extremely useful as monitoring systems because they do not restrict the patient during sleep.
In this section, a sheet-type sensor for measuring heart rate, respiratory movement, and body movement based on electrostatic capacitance is introduced. The outline of this sheet-type sensor is shown in Figure 18. A capacitor is formed with a conducting electrode on both sides of an insulating sheet. Displacement of the minute pressure, which arises from a human’s heartbeats, respiratory movement, and body movement, is changed into the capacitance change between the electrodes. Here, ![]() is dielectric constant, area of polar plates is
is dielectric constant, area of polar plates is ![]() , distance between polar plates is set to
, distance between polar plates is set to ![]() , and capacity value is set to
, and capacity value is set to ![]() in Figure 18, as shown in Eq. (3). If the area of an electrode is constant, the capacity value
in Figure 18, as shown in Eq. (3). If the area of an electrode is constant, the capacity value ![]() will change with the distance
will change with the distance ![]() between polar plates:
between polar plates:
(3)

Body movement and respiratory movement are measurable as a comparatively big displacement. However, the displacement by a heartbeat is very minute, and it is difficult to detect heartbeat signal. In order to detect the capacitance change by the minute displacement originating from a heartbeat with sufficient accuracy, the LC oscillation-type detector circuit was used. This circuit changes minute vibrations into the frequency domain. Figure 19 shows an example of a detected heart-rate signal and respiratory movement.

2.3.4 Video Camera
When wearing some sensors, even adults feel constrained and tied-up, and for children it is a cause of significant stress. Therefore, it was necessary to develop new measurement and assessment systems to enable unconscious monitoring of daily sleep. As one such approach, we developed a method to monitor sleep using a video camera and image analysis. This method monitors sleep stage with only body movement obtained from video images recorded. With this method, it is possible to conduct completely non-contact monitoring and estimate all-night sleep stages such as awake, slow-wave sleep (SWS), and rapid eye movement (REM) sleep. This method focused on the strong relationship between sleep stage and body movement. The body movements during sleep were divided into the following three states by Fukumoto et al.: twitch movements (TMs), localized movements (LMs), and gross movements (GMs). Among these three movements, GMs indicate the body movements that occur for a longer time period, such as turning over in bed, which usually continues for over 2 sec. GMs are most directly related to the sleep-wake cycle.
Figure 20 shows the outline of the video processing. The video output was converted to BMP-format still images and analyzed. As mentioned above, GMs continue for over 2 sec. Therefore, 1 fps was considered to be an appropriate value for the frame rate. The region of interest (ROI) was specified for high-speed processing. The ROI is used to distinguish the necessary region from the overall image. ROI processing enables high-speed processing by eliminating excess noise and decreasing the image size. After ROI processing, the image was converted to gray scale, and the changes in the gray values between frames were detected using image processing.

GMs are thought to be inhibited during SWS. Therefore, we predicted that SWS could be classified by extracting the continuous time of non-movement. Regarding the GM data, a “section” of body movement is defined as the interval from the period when GMs are inhibited, then activated, then inhibited again. In each section, the time at which activated GMs are inhibited is ![]() , the time at which GMs are activated from the inhibited state is
, the time at which GMs are activated from the inhibited state is ![]() , and the time at which the inhibition of GMs is restarted is
, and the time at which the inhibition of GMs is restarted is ![]() . As such, the continuous time of non-movement, at time
. As such, the continuous time of non-movement, at time ![]() , in each section is expressed as
, in each section is expressed as
(4)
The wake stage could be extracted by considering parameters related to the amount of GMs when they were not controlled. Based on the notion that sleep stage is correlated with GMs immediately before the stage, the simple moving average of a 60 sec interval could be calculated. The reference section for the moving average was set as 60 sec immediately before the section because we intended for at least one epoch to be included.
The linear discriminant function method was utilized to estimate the sleep stage from body movements during sleep using video image processing. Linear discriminant analysis can be used to distinguish no fewer than two groups of data clusters. In the current analysis, the independent variables were the continuous time of non-movement and the moving average amount of body movement. The response variables were the three clusters wake, light and REM, and SWS.
Eq. (5) and Eq. (6) define the linear discriminant function. Here, ![]() and
and ![]() represent the continuous time of non-movement and the moving average amount of body movement, respectively. We are able to distinguish the three groups by solving for the coefficients
represent the continuous time of non-movement and the moving average amount of body movement, respectively. We are able to distinguish the three groups by solving for the coefficients ![]() ,
, ![]() ,
, ![]() ,
, ![]() , and the constants
, and the constants ![]() ,
, ![]() . Moreover, Eq. (7) and Eq. (8) define the linear discriminant function. Eq. (6) distinguishes the discriminant functions of wake and categories other than wake, while Eq. (8) is the discriminant function that distinguishes SWS and categories other than SWS. In these equations,
. Moreover, Eq. (7) and Eq. (8) define the linear discriminant function. Eq. (6) distinguishes the discriminant functions of wake and categories other than wake, while Eq. (8) is the discriminant function that distinguishes SWS and categories other than SWS. In these equations, ![]() and
and ![]() are the linear discriminant scores, and the division of categories is determined by the positive and negative numbers of
are the linear discriminant scores, and the division of categories is determined by the positive and negative numbers of ![]() ,
, ![]() :
:
(5)
(6)
(7)
(8)
Below we explain the calculation method for ![]() ,
, ![]() , and
, and ![]() in Eq. (5). As demonstrated in Eq. (9) and Eq. (10), we calculate the total sum of squares
in Eq. (5). As demonstrated in Eq. (9) and Eq. (10), we calculate the total sum of squares ![]() of the difference between the discriminant score
of the difference between the discriminant score ![]() and the average
and the average ![]() of all discriminant groups, as well as the total sum of squares
of all discriminant groups, as well as the total sum of squares ![]() of the difference between the discriminant score
of the difference between the discriminant score ![]() and the average
and the average ![]() of the discriminant group wake. Parameter
of the discriminant group wake. Parameter ![]() indicates the number of the linear discriminant scores of all discriminant groups, while
indicates the number of the linear discriminant scores of all discriminant groups, while ![]() indicates the number of linear discriminant scores of the discriminant group wake. Moreover,
indicates the number of linear discriminant scores of the discriminant group wake. Moreover, ![]() indicates all variations within the data, while
indicates all variations within the data, while ![]() indicates the variations among the groups of the discriminant group wake:
indicates the variations among the groups of the discriminant group wake:
(9)
(10)
The value ![]() is the variation rate, which is determined by dividing
is the variation rate, which is determined by dividing ![]() (the variation among the group of the discriminant group wake) by the total variation
(the variation among the group of the discriminant group wake) by the total variation ![]() . This is demonstrated in Eq. (11). To divide the discriminant group wake and other groups optimally, it is necessary to calculate
. This is demonstrated in Eq. (11). To divide the discriminant group wake and other groups optimally, it is necessary to calculate ![]() ,
, ![]() , which will determine the maximum value of the variation rate
, which will determine the maximum value of the variation rate ![]() . Therefore, as indicated in Eq. (12) we intend for
. Therefore, as indicated in Eq. (12) we intend for ![]() ,
, ![]() to give us the value 0 when
to give us the value 0 when ![]() has been partially differentiated by
has been partially differentiated by ![]() ,
, ![]() , respectively. The calculation methods for
, respectively. The calculation methods for ![]() ,
, ![]() , and
, and ![]() are the same:
are the same:
(11)
(12)
Figure 21 shows an example of an estimated sleep stage determined by a polysomnogram and linear discriminant.

2.4 Wearable Sensors for Physical Activity Measurement
Physical activity in daily life is the most preferable monitoring aspect because it is the nature of human beings to move and our daily activities are closely related to our health. There are many kinds of motion sensors to measure physical activities, such as accelerometers, gyrosensors, goniometers, GPS sensors, etc. However, these sensors are discussed in other chapters of this book. Therefore, three new topics are introduced in this chapter. The first topic is “flexible goniomer,” the second is “joint motion measurement using two accelerometers set both near sides around the joint,” and the last is “flexible force sensors during walking.”
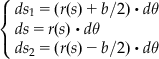
2.4.1 Flexible Goniometer for Articular Motion
Morimoto developed a flexible goniometer as an articular motion sensor that does not make use of a rotary encoder to measure human articular motion shown in Figure 22(a). Figure 22(b) illustrates the configuration and the operating principles of a single-axis flexible goniometer. As shown in this figure, the goniometer has a strain gauge attached to both sides of the flexible plate between the end blocks. It generates a value that depends on the angle ![]() between the two end blocks. The operating principles of the flexible goniometer are illustrated in Figure 22(c). When the angle between the end blocks at both ends is
between the two end blocks. The operating principles of the flexible goniometer are illustrated in Figure 22(c). When the angle between the end blocks at both ends is ![]() , and when the locus at a distance s is considered to be ds, the curvature radius will be r(s) and the central angle will be
, and when the locus at a distance s is considered to be ds, the curvature radius will be r(s) and the central angle will be ![]() . During extension and contraction,
. During extension and contraction, ![]() ,
, ![]() , and
, and ![]() for the top, bottom, and center of this arc are given by
for the top, bottom, and center of this arc are given by
(13)
 (13)
(13)
The extensions ![]() ,
, ![]() for the top and the bottom are given by
for the top and the bottom are given by
(14)
 (14)
(14)Accordingly, the extension and the contraction ![]() ,
, ![]() for the measured part, in its entirety, are given by
for the measured part, in its entirety, are given by
(15)
 (15)
(15)The extension ![]() for the measured part, in its entirety, is found to be proportional to the angle
for the measured part, in its entirety, is found to be proportional to the angle ![]() , formed by the fixed ends at both the ends, for both the top and bottom sides. However, in this form, the extension and the contraction of the fixed ends, i.e., the extension and the contraction of the measured part in its entirety, can be mistaken to be a change in the angle
, formed by the fixed ends at both the ends, for both the top and bottom sides. However, in this form, the extension and the contraction of the fixed ends, i.e., the extension and the contraction of the measured part in its entirety, can be mistaken to be a change in the angle ![]() . Moreover, as longitudinal twists in the measured part can also be a cause for miscalculation of the angle, an accurate measurement of the angles can be made by setting up a bridge circuit using four strain gauges, as shown in Figure 22(d). The use of the flexible goniometer can be extended to measure the bi-axial rotational angles by attaching strain gauges to the top and bottom sides, as well as the left and right sides of the flexible square rod, as shown in Figure 22(e).
. Moreover, as longitudinal twists in the measured part can also be a cause for miscalculation of the angle, an accurate measurement of the angles can be made by setting up a bridge circuit using four strain gauges, as shown in Figure 22(d). The use of the flexible goniometer can be extended to measure the bi-axial rotational angles by attaching strain gauges to the top and bottom sides, as well as the left and right sides of the flexible square rod, as shown in Figure 22(e).
2.4.2 Joint Motion Measurement Using Two Accelerometers Set Near Both Sides of the Joint
The last topic is a unique joint motion monitoring method using accelerometers, which we developed previously. Figure 23(a) is the schematic representation of the principle and the equipment to measure the angle change of a one-axis joint, such as the elbow. In this method, two accelerometers are set on both sides of the joint and as close as possible (“both-near-sides”) to its joint axis.

In this case, it is assumed that the acceleration a1 loaded on the accelerometer 1 is largely similar to acceleration a2 loaded on the accelerometer 2 under the below conditions; 1) the rotation radius around the joint is small, and the centrifugal force and the turning force loaded on sensor 1 can be regarded as zero, and 2) when this system including two limbs and its joint rotates on other center, these two sensors receive the same magnitude of centrifugal force and turning force.
In Figure 23, the x-axis and y-axis components of acceleration ![]() are defined as
are defined as ![]() , those of acceleration
, those of acceleration ![]() as
as ![]() , and the joint angle as
, and the joint angle as ![]() . Using the rotation matrix of
. Using the rotation matrix of ![]() , the relation between
, the relation between ![]() and
and ![]() can be described by
can be described by
(16)
Thus, the joint angle ![]() can easily be solved as follows:
can easily be solved as follows:
(17)
Figure 24 shows the method to measure three-axis joint motion, such as a shoulder joint. In the same manner as the monitoring of one-axis joint, two accelerometers 1 and 2 are set at "both-near-sides" around the joint. The accelerometer set on the body is adjusted so that the z-axis is in the vertical direction, the y-axis in the longitudinal direction and x-axis in the horizontal direction. The accelerometer set on the upper limb is adjusted so that the x-, y- and z-axis correspond to that of the accelerometer on the body.

The components on the x- , y- and z-axis of the acceleration measured by the accelerometer mounted on the shoulder are defined as ![]() and that on the upper limb are defined as
and that on the upper limb are defined as ![]() . In this case, the acceleration loaded on the accelerometer mounted on the shoulder is much the same as that in the upper limb in the same manner as the monitoring of a one-axis joint. Using the rotation matrix
. In this case, the acceleration loaded on the accelerometer mounted on the shoulder is much the same as that in the upper limb in the same manner as the monitoring of a one-axis joint. Using the rotation matrix ![]() , the relation between the components
, the relation between the components ![]() and
and ![]() is described by
is described by
(18)
 (18)
(18)Here the rotation matrix ![]() is given by
is given by
(19)
 (19)
(19)However, angle ψ, φ, θ can’t be calculated from this equation, because this equation is indeterminate. To get the solution of equation (18), one remarkable feature of the shoulder joint should be considered, i.e. the skin of the arm, where the accelerometer 2 is set, shows almost no motion when the subject rotates his arm around the z-axis. Therefore, the rotation angle φ can be regarded as zero, and the rotation matrix Rxyz can be modified as shown in equation (20), and the flexion/extension angle ψ and abduction/adduction angle θ can easily be obtained from this equation (18).
(20)
 (20)
(20)
On the other hand, the rotation angle φ can be decided as the twist angle α of the upper arm, which is calculated from outputs of accelerometer 2 and 3. Of course the flexion/extension angle β of the elbow can be easily calculated as mentioned before.
Figure 25(b) shows an example of upper limb motion monitoring. In this case a series of limb motions are measured, calculated, and reproduced in real time on a personal computer display as a stick figure picture.
2.4.3 Force Monitoring During Walking
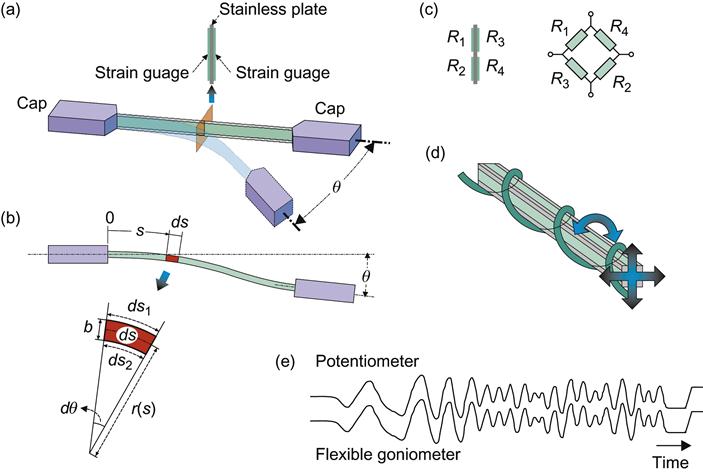
In kinematics, which explains the human movement and motion from a mechanical standpoint, the external forces acting on the subjects need to be found. While walking, the external force of the ground acts on a person through their feet. This force is called the ground reaction force. This ground reaction force must be measured for the purpose of the kinematic gait analysis. However, a typical ground reaction force gauge is set up on the floor and cannot measure the ground reaction force in the course of daily life. To measure the load on the soles of the feet while measuring the daily behavior, sensors need to be fitted to measure the external forces on footwear such as shoes or slippers. To that end, we have developed a foot sole pressure distribution sensor, as illustrated in Figure 25. For these sensors, the electrode bands are printed on the top and the bottom of a flexible sheet, so that they intersect with each other. A conductive ink is applied on the surface of all the electrodes shown in Figure 25(a). When pressure is applied, the ink is compressed and the resistance value for the conductive ink in that area drops. This is measured as the variation in resistance between grid ends and can be obtained for each grid point as pressure values.
3 Summary
It is seen that there can be a wide variety of sensors that can pick up clinical vital signs as well as other physiological and physical signals from the human body. In most examples, these sensors were wearable or non-obstructably located in the environment of the human subject. At the beginning of this chapter, we asked if such sensing systems needed to be wearable. There is no unique answer to such a question. It all depends on how the information from the sensor, or more correctly the group of sensors, is to be used. How much will the instrumentation affect the behavior and physiology of the subject? In answering such a question, we need to remember the fundamental principle of physiological measurement: make sure that the instrumentation doesn’t affect the system being measured or at least only minimally affects it.