The mobile radio channel places fundamental limitations on the performance of wireless communication systems. The transmission path between the transmitter and the receiver can vary from simple line-of-sight to one that is severely obstructed by buildings, mountains, and foliage. Unlike wired channels that are stationary and predictable, radio channels are extremely random and do not offer easy analysis. Even the speed of motion impacts how rapidly the signal level fades as a mobile terminal moves in space. Modeling the radio channel has historically been one of the most difficult parts of mobile radio system design, and is typically done in a statistical fashion, based on measurements made specifically for an intended communication system or spectrum allocation.
The mechanisms behind electromagnetic wave propagation are diverse, but can generally be attributed to reflection, diffraction, and scattering. Most cellular radio systems operate in urban areas where there is no direct line-of-sight path between the transmitter and the receiver, and where the presence of high-rise buildings causes severe diffraction loss. Due to multiple reflections from various objects, the electromagnetic waves travel along different paths of varying lengths. The interaction between these waves causes multipath fading at a specific location, and the strengths of the waves decrease as the distance between the transmitter and receiver increases.
Propagation models have traditionally focused on predicting the average received signal strength at a given distance from the transmitter, as well as the variability of the signal strength in close spatial proximity to a particular location. Propagation models that predict the mean signal strength for an arbitrary transmitter–receiver (T–R) separation distance are useful in estimating the radio coverage area of a transmitter and are called large-scale propagation models, since they characterize signal strength over large T–R separation distances (several hundreds or thousands of meters). On the other hand, propagation models that characterize the rapid fluctuations of the received signal strength over very short travel distances (a few wavelengths) or short time durations (on the order of seconds) are called small-scale or fading models.
As a mobile moves over very small distances, the instantaneous received signal strength may fluctuate rapidly giving rise to small-scale fading. The reason for this is that the received signal is a sum of many contributions coming from different directions, as described in Chapter 5. Since the phases are random, the sum of the contributions varies widely; for example, obeys a Rayleigh fading distribution. In small-scale fading, the received signal power may vary by as much as three or four orders of magnitude (30 or 40 dB) when the receiver is moved by only a fraction of a wavelength. As the mobile moves away from the transmitter over much larger distances, the local average received signal will gradually decrease, and it is this local average signal level that is predicted by large-scale propagation models. Typically, the local average received power is computed by averaging signal measurements over a measurement track of 5 λ to 40 λ. For cellular and PCS frequencies in the 1 GHz to 2 GHz band, this corresponds to measuring the local average received power over movements of 1 m to 10 m.
Figure 4.1 illustrates small-scale fading and the more gradual large-scale variations for an indoor radio communication system. Notice in the figure that the signal fades rapidly (small-scale fading) as the receiver moves, but the local average signal changes much more gradually with distance. This chapter covers large-scale propagation and presents a number of common methods used to predict received power in mobile communication systems. Chapter 4 treats small-scale fading models and describes methods to measure and model multipath in the mobile radio environment.
The free space propagation model is used to predict received signal strength when the transmitter and receiver have a clear, unobstructed line-of-sight path between them. Satellite communication systems and microwave line-of-sight radio links typically undergo free space propagation. As with most large-scale radio wave propagation models, the free space model predicts that received power decays as a function of the T–R separation distance raised to some power (i.e. a power law function). The free space power received by a receiver antenna which is separated from a radiating transmitter antenna by a distance d, is given by the Friis free space equation,

where Pt is the transmitted power, Pr(d) is the received power which is a function of the T–R separation, Gt is the transmitter antenna gain, Gr is the receiver antenna gain, d is the T–R separation distance in meters, L is the system loss factor not related to propagation (L ≥ 1), and λ is the wavelength in meters. The gain of an antenna is related to its effective aperture, Ae, by
The effective aperture Ae is related to the physical size of the antenna, and λ is related to the carrier frequency by
where f is the carrier frequency in Hertz, ωc is the carrier frequency in radians per second, and c is the speed of light given in meters/s. The values for Pt and Pr must be expressed in the same units, and Gt and Gr are dimensionless quantities. The miscellaneous losses L (L ≥ 1) are usually due to transmission line attenuation, filter losses, and antenna losses in the communication system. A value of L = 1 indicates no loss in the system hardware.
The Friis free space equation of (4.1) shows that the received power falls off as the square of the T–R separation distance. This implies that the received power decays with distance at a rate of 20 dB/decade.
An isotropic radiator is an ideal antenna which radiates power with unit gain uniformly in all directions, and is often used to reference antenna gains in wireless systems. The effective isotropic radiated power (EIRP) is defined as
and represents the maximum radiated power available from a transmitter in the direction of maximum antenna gain, as compared to an isotropic radiator.
In practice, effective radiated power (ERP) is used instead of EIRP to denote the maximum radiated power as compared to a half-wave dipole antenna (instead of an isotropic antenna). Since a dipole antenna has a gain of 1.64 (2.15 dB above an isotrope), the ERP will be 2.15 dB smaller than the EIRP for the same transmission system. In practice, antenna gains are given in units of dBi (dB gain with respect to an isotropic antenna) or dBd (dB gain with respect to a half-wave dipole) [Stu81].
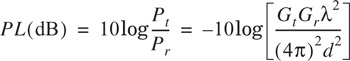
The path loss, which represents signal attenuation as a positive quantity measured in dB, is defined as the difference (in dB) between the effective transmitted power and the received power, and may or may not include the effect of the antenna gains. The path loss for the free space model when antenna gains are included is given by
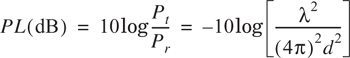
When antenna gains are excluded, the antennas are assumed to have unity gain, and path loss is given by
The Friis free space model is only a valid predictor for Pr for values of d which are in the far-field of the transmitting antenna. The far-field, or Fraunhofer region, of a transmitting antenna is defined as the region beyond the far-field distance df, which is related to the largest linear dimension of the transmitter antenna aperture and the carrier wavelength. The Fraunhofer distance is given by
where D is the largest physical linear dimension of the antenna. Additionally, to be in the far-field region, df must satisfy
and
Furthermore, it is clear that Equation (4.1) does not hold for d = 0. For this reason, large-scale propagation models use a close-in distance, d0, as a known received power reference point. The received power, Pr(d), at any distance d > d0, may be related to Pr at d0. The value Pr(d0) may be predicted from Equation (4.1), or may be measured in the radio environment by taking the average received power at many points located at a close-in radial distance d0 from the transmitter. The reference distance must be chosen such that it lies in the far-field region, that is, d0 ≥ df, and d0 is chosen to be smaller than any practical distance used in the mobile communication system. Thus, using Equation (4.1), the received power in free space at a distance greater than d0 is given by
In mobile radio systems, it is not uncommon to find that Pr may change by many orders of magnitude over a typical coverage area of several square kilometers. Because of the large dynamic range of received power levels, often dBm or dBW units are used to express received power levels. Equation (4.8) may be expressed in units of dBm or dBW by simply taking the logarithm of both sides and multiplying by 10. For example, if Pr is in units of dBm, the received power is given by
where Pr(d0) is in units of watts.
The reference distance d0 for practical systems using low-gain antennas in the 1–2 GHz region is typically chosen to be 1 m in indoor environments and 100 m or 1 km in outdoor environments, so that the numerator in Equations (4.8) and (4.9) is a multiple of 10. This makes path loss computations easy in dB units.
Example 4.1.
Find the far-field distance for an antenna with maximum dimension of 1 m and operating frequency of 900 MHz.
Solution
Given:
|
|
|
Example 4.2.
If a transmitter produces 50 W of power, express the transmit power in units of (a) dBm, and (b) dBW. If 50 W is applied to a unity gain antenna with a 900 MHz carrier frequency, find the received power in dBm at a free space distance of 100 m from the antenna. What is Pr(10 km)? Assume unity gain for the receiver antenna.
Solution
Given:
|
|
|
Transmitter power,
Pt (dBm)
=
10log[Pt(mW)/(1 mW)]
=
10log[50 × 103] = 47.0 dBm.
Transmitter power,
Pt (dBW)
=
10log[Pt(W)/(1 W)]
=
10log[50] = 17.0 dBW.
The received power can be determined using Equation (4.1)
Pr (dBm) = 10logPr(mW) = 10log(3.5 × 10⁻³ mW) = −24.5 dBm.
The received power at 10 km can be expressed in terms of dBm using Equation (4.9), where d0 = 100m and d = 10km

The free space path loss model of Section 4.2 is readily derived from first principles. It can be proven that any radiating structure produces electric and magnetic fields [Gri87], [Kra50]. Consider a small linear radiator of length L, that is placed coincident with the z-axis and has its center at the origin, as shown in Figure 4.2.
If a current flows through such an antenna, it launches electric and magnetic fields that can be expressed as
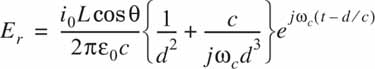


with Eф = Hr = Hθ = 0. In the above equations, all 1/d terms represent the radiation field component, all 1/d2 terms represent the induction field component, and all 1/d3 terms represent the electrostatic field component. As seen from Equations (4.10) to (4.12), the electrostatic and inductive fields decay much faster with distance than the radiation field. At regions far away from the transmitter (far-field region), the electrostatic and inductive fields become negligible and only the radiated field components of Eθ and Hф need be considered.
In free space, the power flux density Pd (expressed in W/m2) is given by

where Rfs is the intrinsic impedance of free space given by η = 120 πΩ (377 Ω). Thus, the power flux density is
where |E| represents the magnitude of the radiating portion of the electric field in the far field. Figure 4.3a illustrates how the power flux density disperses in free space from an isotropic point source. Pd may be thought of as the EIRP divided by the surface area of a sphere with radius d. The power received at distance d, Pr(d), is given by the power flux density times the effective aperture of the receiver antenna, and can be related to the electric field using Equations (4.1), (4.2), (4.13), and (4.14).
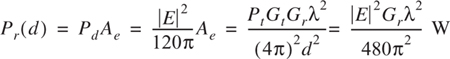
Equation (4.15) relates electric field (with units of V/m) to received power (with units of watts), and is identical to Equation (4.1) with L = 1.
Often it is useful to relate the received power level to a receiver input voltage, as well as to an induced E-field at the receiver antenna. If the receiver antenna is modeled as a matched resistive load to the receiver, then the receiver antenna will induce an rms voltage into the receiver which is half of the open circuit voltage at the antenna. Thus, if V is the rms voltage at the input of a receiver (measured by a high impedance voltmeter), and Rant is the resistance of the matched receiver, the received power is given by

Through Equations (4.14) to (4.16), it is possible to relate the received power to the received E-field or the open circuit rms voltage at the receiver antenna terminals. Figure 4.3b illustrates an equivalent circuit model. Note Vant = V when there is no load.
Example 4.3.
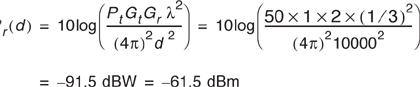
Assume a receiver is located 10 km from a 50 W transmitter. The carrier frequency is 900 MHz, free space propagation is assumed, Gt = 1, and Gr = 2, find (a) the power at the receiver, (b) the magnitude of the E-field at the receiver antenna, (c) the rms voltage applied to the receiver input assuming that the receiver antenna has a purely real impedance of 50 Ω and is matched to the receiver.
Solution
Given:
|
|
|
|
|
Using Equation (4.5), the power received at distance d = 10 km is
Using Equation (4.15), the magnitude of the received E-field is
Using Equation (4.16), the open circuit rms voltage at the receiver input is
Reflection, diffraction, and scattering are the three basic propagation mechanisms which impact propagation in a mobile communication system. These mechanisms are briefly explained in this section, and propagation models which describe these mechanisms are discussed subsequently in this chapter. Received power (or its reciprocal, path loss) is generally the most important parameter predicted by large-scale propagation models based on the physics of reflection, scattering, and diffraction. Small-scale fading and multipath propagation (discussed in Chapter 5) may also be described by the physics of these three basic propagation mechanisms.
Reflection occurs when a propagating electromagnetic wave impinges upon an object which has very large dimensions when compared to the wavelength of the propagating wave. Reflections occur from the surface of the earth and from buildings and walls.
Diffraction occurs when the radio path between the transmitter and receiver is obstructed by a surface that has sharp irregularities (edges). The secondary waves resulting from the obstructing surface are present throughout the space and even behind the obstacle, giving rise to a bending of waves around the obstacle, even when a line-of-sight path does not exist between transmitter and receiver. At high frequencies, diffraction, like reflection, depends on the geometry of the object, as well as the amplitude, phase, and polarization of the incident wave at the point of diffraction.
Scattering occurs when the medium through which the wave travels consists of objects with dimensions that are small compared to the wavelength, and where the number of obstacles per unit volume is large. Scattered waves are produced by rough surfaces, small objects, or by other irregularities in the channel. In practice, foliage, street signs, and lamp posts induce scattering in a mobile communications system.
When a radio wave propagating in one medium impinges upon another medium having different electrical properties, the wave is partially reflected and partially transmitted. If the plane wave is incident on a perfect dielectric, part of the energy is transmitted into the second medium and part of the energy is reflected back into the first medium, and there is no loss of energy in absorption. If the second medium is a perfect conductor, then all incident energy is reflected back into the first medium without loss of energy. The electric field intensity of the reflected and transmitted waves may be related to the incident wave in the medium of origin through the Fresnel reflection coefficient (Γ). The reflection coefficient is a function of the material properties, and generally depends on the wave polarization, angle of incidence, and the frequency of the propagating wave.
In general, electromagnetic waves are polarized, meaning they have instantaneous electric field components in orthogonal directions in space. A polarized wave may be mathematically represented as the sum of two spatially orthogonal components, such as vertical and horizontal, or left-hand or right-hand circularly polarized components. For an arbitrary polarization, superposition may be used to compute the reflected fields from a reflecting surface.
Figure 4.4 shows an electromagnetic wave incident at an angle θi with the plane of the boundary between two dielectric media. As shown in the figure, part of the energy is reflected back to the first media at an angle θr, and part of the energy is transmitted (refracted) into the second media at an angle θt. The nature of reflection varies with the direction of polarization of the E-field. The behavior for arbitrary directions of polarization can be studied by considering the two distinct cases shown in Figure 4.4. The plane of incidence is defined as the plane containing the incident, reflected, and transmitted rays [Ram65]. In Figure 4.4a, the E-field polarization is parallel with the plane of incidence (that is, the E-field has a vertical polarization, or normal component, with respect to the reflecting surface) and in Figure 4.4b, the E-field polarization is perpendicular to the plane of incidence (that is, the incident E-field is pointing out of the page toward the reader, and is perpendicular to the page and parallel to the reflecting surface).
In Figure 4.4, the subscripts i, r, t refer to the incident, reflected, and transmitted fields, respectively. Parameters ε1, μ1, σ1, and ε2, μ2, σ2 represent the permittivity, permeability, and conductance of the two media, respectively. Often, the dielectric constant of a perfect (lossless) dielectric is related to a relative value of permittivity, εr, such that ε = ε0εr, where ε0 is a constant given by 8.85 × 10⁻¹² F/m. If a dielectric material is lossy, it will absorb power and may be described by a complex dielectric constant given by
where
and σ is the conductivity of the material measured in Siemens/meter. The terms εr and σ are generally insensitive to operating frequency when the material is a good conductor (f < σ/(ε0εr)). For lossy dielectrics, ε0 and εr are generally constant with frequency, but σ may be sensitive to the operating frequency, as shown in Table 4.1. Electrical properties of a wide range of materials were characterized over a large frequency range by Von Hipple [Von54].
Table 4.1. Material Parameters at Various Frequencies
Material | Relative Permittivity εr | Conductivity σ (s/m) | Frequency (MHz) |
|---|---|---|---|
Poor Ground | 4 | 0.001 | 100 |
Typical Ground | 15 | 0.005 | 100 |
Good Ground | 25 | 0.02 | 100 |
Sea Water | 81 | 5.0 | 100 |
Fresh Water | 81 | 0.001 | 100 |
Brick | 4.44 | 0.001 | 4000 |
Limestone | 7.51 | 0.028 | 4000 |
Glass, Corning 707 | 4 | 0.00000018 | 1 |
Glass, Corning 707 | 4 | 0.000027 | 100 |
Glass, Corning 707 | 4 | 0.005 | 10000 |
Because of superposition, only two orthogonal polarizations need be considered to solve general reflection problems. The reflection coefficients for the two cases of parallel and perpendicular E-field polarization at the boundary of two dielectrics are given by
where ηi is the intrinsic impedance of the i th medium (i = 1, 2), and is given by ![]() , the ratio of electric to magnetic field for a uniform plane wave in the particular medium. The velocity of an electromagnetic wave is given by
, the ratio of electric to magnetic field for a uniform plane wave in the particular medium. The velocity of an electromagnetic wave is given by ![]() , and the boundary conditions at the surface of incidence obey Snell’s Law which, referring to Figure 4.4, is given by
, and the boundary conditions at the surface of incidence obey Snell’s Law which, referring to Figure 4.4, is given by
The boundary conditions from Maxwell’s equations are used to derive Equations (4.19) and (4.20) as well as Equations (4.22), (4.23.a), and (4.23.b).
and
where Γ is either Γ‖ or Γ┴, depending on whether the E-field is in (vertical) or normal (horizontal) to the plane of incidence.
For the case when the first medium is free space and μ1 = μ2, the reflection coefficients for the two cases of vertical and horizontal polarization can be simplified to

and

For the case of elliptical polarized waves, the wave may be broken down (depolarized) into its vertical and horizontal E-field components, and superposition may be applied to determine transmitted and reflected waves. In the general case of reflection or transmission, the horizontal and vertical axes of the spatial coordinates may not coincide with the perpendicular and parallel axes of the propagating waves. An angle θ measured counter-clockwise from the horizontal axis is defined as shown in Figure 4.5 for a propagating wave out of the page (toward the reader) [Stu93]. The vertical and horizontal field components at a dielectric boundary may be related by

where ![]() and
and ![]() are the depolarized field components in the horizontal and vertical directions, respectively,
are the depolarized field components in the horizontal and vertical directions, respectively, ![]() and
and ![]() are the horizontally and vertically polarized components of the incident wave, respectively, and
are the horizontally and vertically polarized components of the incident wave, respectively, and ![]() ,
, ![]() ,
, ![]() , and
, and ![]() are time varying components of the E-field which may be represented as phasors. R is a transformation matrix which maps vertical and horizontal polarized components to components which are perpendicular and parallel to the plane of incidence. The matrix R is given by
are time varying components of the E-field which may be represented as phasors. R is a transformation matrix which maps vertical and horizontal polarized components to components which are perpendicular and parallel to the plane of incidence. The matrix R is given by
where θ is the angle between the two sets of axes, as shown in Figure 4.5. The depolarization matrix DC is given by
where Dxx = Γx for the case of reflection and Dxx = Tx = 1 + Γx for the case of transmission [Stu93].
Figure 4.6 shows a plot of the reflection coefficient for both horizontal and vertical polarization as a function of the incident angle for the case when a wave propagates in free space (εr = 1) and the reflection surface has (a) εr = 4, and (b) εr = 12.

Figure 4.6. Magnitude of reflection coefficients as a function of angle of incidence for εr = 4, εr = 12, using geometry in Figure 4.4.
Example 4.4.
Demonstrate that if medium 1 is free space and medium 2 is a dielectric, both |Γ‖| and |Γ┴| approach 1 as θi approaches 0° regardless of εr.
Solution
Substituting θi = 0° in Equation (4.24)
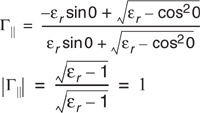
Substituting θi = 0° in Equation (4.25)
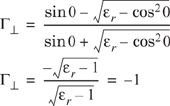
This example illustrates that ground may be modeled as a perfect reflector with a reflection coefficient of unit magnitude when an incident wave grazes the earth, regardless of polarization or ground dielectric properties (some texts define the direction of Er to be opposite to that shown in Figure 4.4a, resulting in Γ = −1 for both parallel and perpendicular polarization).
The Brewster angle is the angle at which no reflection occurs in the medium of origin. It occurs when the incident angle θB is such that the reflection coefficient Γ‖ is equal to zero (see Figure 4.6). The Brewster angle is given by the value of θB which satisfies
For the case when the first medium is free space and the second medium has a relative permittivity εr, Equation (4.27) can be expressed as

Note that the Brewster angle occurs only for vertical (i.e. parallel) polarization.
Example 4.5.
Calculate the Brewster angle for a wave impinging on ground having a permittivity of εr = 4.
Solution
The Brewster angle can be found by substituting the values for εr in Equation (4.28).

Thus Brewster angle for εr = 4 is equal to 26.56°.
Since electromagnetic energy cannot pass through a perfect conductor a plane wave incident on a conductor has all of its energy reflected. As the electric field at the surface of the conductor must be equal to zero at all times in order to obey Maxwell’s equations, the reflected wave must be equal in magnitude to the incident wave. For the case when E-field polarization is in the plane of incidence, the boundary conditions require that [Ram65]
and
Similarly, for the case when the E-field is horizontally polarized, the boundary conditions require that
and
Referring to Equations (4.29) to (4.32), we see that for a perfect conductor, Γ‖ = 1, and Γ┴ = −1, regardless of incident angle. Elliptical polarized waves may be analyzed by using superposition, as shown in Figure 4.5 and Equation (4.26).
In a mobile radio channel, a single direct path between the base station and a mobile is seldom the only physical means for propagation, and hence the free space propagation model of Equation (4.5) is in most cases inaccurate when used alone. The two-ray ground reflection model shown in Figure 4.7 is a useful propagation model that is based on geometric optics, and considers both the direct path and a ground reflected propagation path between transmitter and receiver. This model has been found to be reasonably accurate for predicting the large-scale signal strength over distances of several kilometers for mobile radio systems that use tall towers (heights which exceed 50 m), as well as for line-of-sight microcell channels in urban environments [Feu94].
In most mobile communication systems, the maximum T–R separation distance is at most only a few tens of kilometers, and the earth may be assumed to be flat. The total received E-field, ETOT, is then a result of the direct line-of-sight component, ELOS, and the ground reflected component, Eg.
Referring to Figure 4.7, ht is the height of the transmitter and hr is the height of the receiver. If E0 is the free space E-field (in units of V/m) at a reference distance d0 from the transmitter, then for d > d0, the free space propagating E-field is given by
where |E(d, t)| = E0d0/d represents the envelope of the E-field at d meters from the transmitter.
Two propagating waves arrive at the receiver: the direct wave that travels a distance d′; and the reflected wave that travels a distance d″. The E-field due to the line-of-sight component at the receiver can be expressed as
and the E-field for the ground reflected wave, which has a propagation distance of d″, can be expressed as
According to laws of reflection in dielectrics given in Section 4.5.1
and
where Γ is the reflection coefficient for ground. For small values of θi (i.e., grazing incidence), the reflected wave is equal in magnitude and 180° out of phase with the incident wave, as shown in Example 4.4. The resultant E-field, assuming perfect horizontal E-field polarization and ground reflection (i.e., Γ┴ = −1 and Et = 0), is the vector sum of ELOS and Eg, and the resultant total E-field envelope is given by
The electric field ETOT(d, t) can be expressed as the sum of Equations (4.34) and (4.35)
Using the method of images, which is demonstrated by the geometry of Figure 4.8, the path difference, Δ, between the line-of-sight and the ground reflected paths can be expressed as
When the T–R separation distance d is very large compared to ht + hr, Equation (4.40) can be simplified using a Taylor series approximation
Once the path difference is known, the phase difference θΔ between the two E-field components and the time delay τd between the arrival of the two components can be easily computed using the following relations
and
It should be noted that as d becomes large, the difference between the distances d′ and d″ becomes very small, and the amplitudes of ELOS and Eg are virtually identical and differ only in phase. That is
If the received E-field is evaluated at some time, say at t = d″/c, Equation (4.39) can be expressed as a phasor sum

where d is the distance over a flat earth between the bases of the transmitter and receiver antennas. Referring to the phasor diagram of Figure 4.9 which shows how the direct and ground reflected rays combine, the electric field (at the receiver) at a distance d from the transmitter can be written as
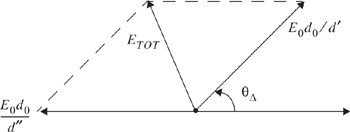
Figure 4.9. Phasor diagram showing the electric field components of the line-of-sight, ground reflected, and total received E-fields, derived from Equation (4.45).
or
Note that if the E-field is assumed to be in the plane of incidence (i.e., vertical polarization) then Γ‖ = 1 and Equation (4.47) would have a “+” instead of a “–”.
Using trigonometric identities, Equation (4.47) can be expressed as
Equation (4.48) is an important expression, as it provides the exact received E-field for the two-ray ground reflection model. One notes that for increasing distance from the transmitter, ETOT(d) decays in an oscillatory fashion, with local maxima being 6 dB greater than the free space value and the local minima plummeting to –∞ dB (the received E-field cancels out to zero volts at certain values of d, although in reality this never happens). Once the distance d is sufficiently large, θΔ becomes ≤ π and the received E-field, ETOT(d), then falls off asymtotically with increasing distance. Note that Equation (4.48) may be simplified whenever sin(θΔ/2) ≈ θΔ/2. This occurs when θΔ/2 is less than 0.3 radian. Using Equations (4.41) and (4.42)

which implies that Equation (4.48) may be simplified whenever
Thus, as long as d satisfies (4.50), the received E-field can be approximated as

where k is a constant related to E0, the antenna heights, and the wavelength. This asymptotic behavior is identical for both the E-field in the plane of incidence or normal to the plane of incidence. The free space power received at d is related to the square of the electric field through Equation (4.15). Combining Equations (4.2), (4.15), and (4.51), the received power at a distance d from the transmitter for the two-ray ground bounce model can be expressed as

As seen from Equation (4.52) at large distances (![]() ), the received power falls off with distance raised to the fourth power, or at a rate of 40 dB/decade. This is a much more rapid path loss than is experienced in free space. Note also that at large values of d, the received power and path loss become independent of frequency. The path loss for the two-ray model (with antenna gains) can be expressed in dB as
), the received power falls off with distance raised to the fourth power, or at a rate of 40 dB/decade. This is a much more rapid path loss than is experienced in free space. Note also that at large values of d, the received power and path loss become independent of frequency. The path loss for the two-ray model (with antenna gains) can be expressed in dB as
At small T–R separation distances, Equation (4.39) must be used to compute the total E-field. When Equation (4.42) is evaluated for θΔ = π, then d = (4hthr)/λ is where the ground appears in the first Fresnel zone between the transmitter and receiver (Fresnel zones are treated in Section 4.7.1). The first Fresnel zone distance is a useful parameter in microcell path loss models [Feu94].
Example 4.6.
A mobile is located 5 km away from a base station and uses a vertical λ/4 monopole antenna with a gain of 2.55 dB to receive cellular radio signals. The E-field at 1 km from the transmitter is measured to be 10−3 V/m. The carrier frequency used for this system is 900 MHz.
Find the length and the effective aperture of the receiving antenna.
Find the received power at the mobile using the two-ray ground reflection model assuming the height of the transmitting antenna is 50 m and the receiving antenna is 1.5 m above ground.
Solution
Given:
|
|
|
Length of the antenna, L = λ/4 = 0.333/4 = 0.0833 m = 8.33 cm.
Effective aperture of λ/4 monopole antenna can be obtained using Equation (4.2).
Effective aperture of antenna = 0.016 m2.
Since
 , the electric field is given by
The received power at a distance d can be obtained using Equation (4.15)


Diffraction allows radio signals to propagate around the curved surface of the earth, beyond the horizon, and to propagate behind obstructions. Although the received field strength decreases rapidly as a receiver moves deeper into the obstructed (shadowed) region, the diffraction field still exists and often has sufficient strength to produce a useful signal.
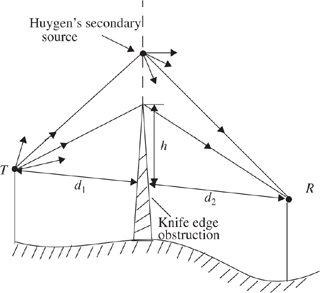
The phenomenon of diffraction can be explained by Huygen’s principle, which states that all points on a wavefront can be considered as point sources for the production of secondary wavelets, and that these wavelets combine to produce a new wavefront in the direction of propagation. Diffraction is caused by the propagation of secondary wavelets into a shadowed region. The field strength of a diffracted wave in the shadowed region is the vector sum of the electric field components of all the secondary wavelets in the space around the obstacle.
Consider a transmitter and receiver separated in free space as shown in Figure 4.10a. Let an obstructing screen of effective height h with infinite width (going into and out of the paper) be placed between them at a distance d1 from the transmitter and d2 from the receiver. It is apparent that the wave propagating from the transmitter to the receiver via the top of the screen travels a longer distance than if a direct line-of-sight path (through the screen) existed. Assuming h « d1, d2 and h » λ, then the difference between the direct path and the diffracted path, called the excess path length (Δ), can be obtained from the geometry of Figure 4.10b as
The corresponding phase difference is given by
and when tanx ≈ x, then α = β + γ from Figure 4.10c and
(a proof of Equations (4.54) and (4.55) is left as an exercise for the reader).
Equation (4.55) is often normalized using the dimensionless Fresnel–Kirchoff diffraction parameter v which is given by
where α has units of radians and is shown in Figure 4.10b and Figure 4.10c. From Equation (4.56), ф can be expressed as
From the above equations it is clear that the phase difference between a direct line-of-sight path and diffracted path is a function of height and position of the obstruction, as well as the transmitter and receiver location.
In practical diffraction problems, it is advantageous to reduce all heights by a constant, so that the geometry is simplified without changing the values of the angles. This procedure is shown in Figure 4.10c.
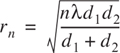
The concept of diffraction loss as a function of the path difference around an obstruction is explained by Fresnel zones. Fresnel zones represent successive regions where secondary waves have a path length from the transmitter to receiver which are nλ/2 greater than the total path length of a line-of-sight path. Figure 4.11 demonstrates a transparent plane located between a transmitter and receiver. The concentric circles on the plane represent the loci of the origins of secondary wavelets which propagate to the receiver such that the total path length increases by λ/2 for successive circles. These circles are called Fresnel zones. The successive Fresnel zones have the effect of alternately providing constructive and destructive interference to the total received signal. The radius of the nth Fresnel zone circle is denoted by rn and can be expressed in terms of n, λ, d1, and d2 by
This approximation is valid for d1, d2 » rn.
The excess total path length traversed by a ray passing through each circle is nλ/2, where n is an integer. Thus, the path traveling through the smallest circle corresponding to n = 1 in Figure 4.11 will have an excess path length of λ/2 as compared to a line-of-sight path, and circles corresponding to n = 2, 3, etc. will have an excess path length of λ, 3λ/2, etc. The radii of the concentric circles depend on the location of the plane. The Fresnel zones of Figure 4.11 will have maximum radii if the plane is midway between the transmitter and receiver, and the radii become smaller when the plane is moved toward either the transmitter or the receiver. This effect illustrates how shadowing is sensitive to the frequency as well as the location of obstructions with relation to the transmitter or receiver.
In mobile communication systems, diffraction loss occurs from the blockage of secondary waves such that only a portion of the energy is diffracted around an obstacle. That is, an obstruction causes a blockage of energy from some of the Fresnel zones, thus allowing only some of the transmitted energy to reach the receiver. Depending on the geometry of the obstruction, the received energy will be a vector sum of the energy contributions from all unobstructed Fresnel zones.
As shown in Figure 4.12, an obstacle may block the transmission path, and a family of ellipsoids can be constructed between a transmitter and receiver by joining all the points for which the excess path delay is an integer multiple of half wavelengths. The ellipsoids represent Fresnel zones. Note that the Fresnel zones are elliptical in shape with the transmitter and receiver antenna at their foci. In Figure 4.12, different knife edge diffraction scenarios are shown. In general, if an obstruction does not block the volume contained within the first Fresnel zone, then the diffraction loss will be minimal, and diffraction effects may be neglected. In fact, a rule of thumb used for design of line-of-sight microwave links is that as long as 55% of the first Fresnel zone is kept clear, then further Fresnel zone clearance does not significantly alter the diffraction loss.
Estimating the signal attenuation caused by diffraction of radio waves over hills and buildings is essential in predicting the field strength in a given service area. Generally, it is impossible to make very precise estimates of the diffraction losses, and in practice prediction is a process of theoretical approximation modified by necessary empirical corrections. Though the calculation of diffraction losses over complex and irregular terrain is a mathematically difficult problem, expressions for diffraction losses for many simple cases have been derived. As a starting point, the limiting case of propagation over a knife-edge gives good insight into the order of magnitude of diffraction loss.
When shadowing is caused by a single object such as a hill or mountain, the attenuation caused by diffraction can be estimated by treating the obstruction as a diffracting knife edge. This is the simplest of diffraction models, and the diffraction loss in this case can be readily estimated using the classical Fresnel solution for the field behind a knife edge (also called a half-plane). Figure 4.13 illustrates this approach.
Consider a receiver at point R, located in the shadowed region (also called the diffraction zone). The field strength at point R in Figure 4.13 is a vector sum of the fields due to all of the secondary Huygen’s sources in the plane above the knife edge. The electric field strength, Ed, of a knife-edge diffracted wave is given by

where Eo is the free space field strength in the absence of both the ground and the knife edge, and F(v) is the complex Fresnel integral. The Fresnel integral, F(v), is a function of the Fresnel–Kirchoff diffraction parameter v, defined in Equation (4.56), and is commonly evaluated using tables or graphs for given values of v. The diffraction gain due to the presence of a knife edge, as compared to the free space E-field, is given by
In practice, graphical or numerical solutions are relied upon to compute diffraction gain. A graphical representation of Gd(dB) as a function of v is given in Figure 4.14. An approximate solution for Equation (4.60) provided by Lee [Lee85] is
Example 4.7.
Compute the diffraction loss for the three cases shown in Figure 4.12. Assume λ = 1/3 m, d1 = 1km, d2 = 1 km, and (a) h = 25 m, (b) h = 0, (c) h = −25 m. Compare your answers using values from Figure 4.14, as well as the approximate solution given by Equation (4.61.a)–(4.61.e). For each of these cases, identify the Fresnel zone within which the tip of the obstruction lies.
Given:
|
|
|
h = 25 m
Using Equation (4.56), the Fresnel diffraction parameter is obtained as
From Figure 4.14, the diffraction loss is obtained as 22 dB.
Using the numerical approximation in Equation (4.61.e), the diffraction loss is equal to 21.7 dB.
The path length difference between the direct and diffracted rays is given by Equation (4.54) as
To find the Fresnel zone in which the tip of the obstruction lies, we need to compute n which satisfies the relation Δ = nλ/2. For λ = 1/3 m, and Δ = 0/625 m, we obtain
Therefore, the tip of the obstruction completely blocks the first three Fresnel zones.
h = 0 m
Therefore, the Fresnel diffraction parameter ν = 0.
From Figure 4.14, the diffraction loss is obtained as 6 dB. Using the numerical approximation in Equation (4.61.b), the diffraction loss is equal to 6 dB.
For this case, since h = 0, we have Δ = 0, and the tip of the obstruction lies in the middle of the first Fresnel zone.
h = −25 m
Using Equation (4.56), the Fresnel diffraction parameter is obtained as −2.74.
From Figure 4.14, the diffraction loss is approximately equal to 1 dB.
Using the numerical approximation in Equation (4.61.a), the diffraction loss is equal to 0 dB.
Since the absolute value of the height h is the same as part (a), the excess path length Δ and hence n will also be the same. It should be noted that although the tip of the obstruction completely blocks the first three Fresnel zones, the diffraction losses are negligible, since the obstruction is below the line-of-sight (h is negative).
Example 4.8.
Given the following geometry, determine (a) the loss due to knife-edge diffraction, and (b) the height of the obstacle required to induce 6 dB diffraction loss. Assume f = 900 MHz.

Solution
The wavelength

Redraw the geometry by subtracting the height of the smallest structure.
and
α = β + γ = 2.434° = 0.0424 rad
Then using Equation (4.56)
From Figure 4.14 or (4.61.e), the diffraction loss is 25.5 dB.
For 6 dB diffraction loss, ν = 0. The obstruction height h may be found using similar triangles (β = γ), as shown below.
It follows that
 , thus h = 4.16 m.


In many practical situations, especially in hilly terrain, the propagation path may consist of more than one obstruction, in which case the total diffraction loss due to all of the obstacles must be computed. Bullington [Bul47] suggested that the series of obstacles be replaced by a single equivalent obstacle so that the path loss can be obtained using single knife-edge diffraction models. This method, illustrated in Figure 4.15, oversimplifies the calculations and often provides very optimistic estimates of the received signal strength. In a more rigorous treatment, Millington et al. [Mil62] gave a wave-theory solution for the field behind two knife edges in series. This solution is very useful and can be applied easily for predicting diffraction losses due to two knife edges. However, extending this to more than two knife edges becomes a formidable mathematical problem. Many models that are mathematically less complicated have been developed to estimate the diffraction losses due to multiple obstructions [Eps53], [Dey66].
The actual received signal in a mobile radio environment is often stronger than what is predicted by reflection and diffraction models alone. This is because when a radio wave impinges on a rough surface, the reflected energy is spread out (diffused) in all directions due to scattering. Objects such as lamp posts and trees tend to scatter energy in all directions, thereby providing additional radio energy at a receiver.
Flat surfaces that have much larger dimension than a wavelength may be modeled as reflective surfaces. However, the roughness of such surfaces often induces propagation effects different from the specular reflection described earlier in this chapter. Surface roughness is often tested using the Rayleigh criterion which defines a critical height (hc) of surface protuberances for a given angle of incidence θi, given by

A surface is considered smooth if its minimum to maximum protuberance h is less than hc, and is considered rough if the protuberance is greater than hc. For rough surfaces, the flat surface reflection coefficient needs to be multiplied by a scattering loss factor, ρS, to account for the diminished reflected field. Ament [Ame53] assumed that the surface height h is a Gaussian distributed random variable with a local mean and found ρS to be given by
where σh is the standard deviation of the surface height about the mean surface height. The scattering loss factor derived by Ament was modified by Boithias [Boi87] to give better agreement with measured results, and is given in (4.63)
where I0 is the Bessel function of the first kind and zero order.
The reflected E-fields for h > hc can be solved for rough surfaces using a modified reflection coefficient given as
Figure 4.16a and Figure 4.16b illustrate experimental results found by Landron et al. [Lan96]. Measured reflection coefficient data is shown to agree well with the modified reflection coefficients of Equations (4.64) and (4.65) for large exterior walls made of rough limestone.
![Measured reflection coefficients versus incident angle at a rough stone wall site. In these graphs, incident angle is measured with respect to the normal, instead of with respect to the surface boundary as defined in Figure 4.4. These graphs agree with Figure 4.6 [Lan96].](http://imgdetail.ebookreading.net/system_admin/3/0130422320/0130422320__wireless-communications-principles__0130422320__graphics__04fig16.jpg)
(a) E-field in the plane of incidence (parallel polarization).
![Measured reflection coefficients versus incident angle at a rough stone wall site. In these graphs, incident angle is measured with respect to the normal, instead of with respect to the surface boundary as defined in Figure 4.4. These graphs agree with Figure 4.6 [Lan96].](http://imgdetail.ebookreading.net/system_admin/3/0130422320/0130422320__wireless-communications-principles__0130422320__graphics__04fig16b.jpg)
(b) E-field normal to plane of incidence (perpendicular polarization).
Figure 4.16. Measured reflection coefficients versus incident angle at a rough stone wall site. In these graphs, incident angle is measured with respect to the normal, instead of with respect to the surface boundary as defined in Figure 4.4. These graphs agree with Figure 4.6 [Lan96].
In radio channels where large, distant objects induce scattering, knowledge of the physical location of such objects can be used to accurately predict scattered signal strengths. The radar cross section (RCS) of a scattering object is defined as the ratio of the power density of the signal scattered in the direction of the receiver to the power density of the radio wave incident upon the scattering object, and has units of square meters. Analysis based on the geometric theory of diffraction and physical optics may be used to determine the scattered field strength.
For urban mobile radio systems, models based on the bistatic radar equation may be used to compute the received power due to scattering in the far field. The bistatic radar equation describes the propagation of a wave traveling in free space which impinges on a distant scattering object, and is then reradiated in the direction of the receiver, given by
where dT and dR are the distance from the scattering object to the transmitter and receiver, respectively. In Equation (4.66), the scattering object is assumed to be in the far field (Fraunhofer region) of both the transmitter and receiver. The variable RCS is given in units of dB · m2, and can be approximated by the surface area (in square meters) of the scattering object, measured in dB with respect to a one square meter reference [Sei91]. Equation (4.66) may be applied to scatterers in the far-field of both the transmitter and receiver (as illustrated in [Van87], [Zog87], [Sei91]) and is useful for predicting receiver power which scatters off large objects, such as buildings, which are for both the transmitter and receiver.
Several European cities were measured from the perimeter [Sei91], and RCS values for several buildings were determined from measured power delay profiles. For medium and large size buildings located 5–10 km away, RCS values were found to be in the range of 14.1 to 55.7 dB · m2.
Most radio propagation models are derived using a combination of analytical and empirical methods. The empirical approach is based on fitting curves or analytical expressions that recreate a set of measured data. This has the advantage of implicitly taking into account all propagation factors, both known and unknown, through actual field measurements. However, the validity of an empirical model at transmission frequencies or environments other than those used to derive the model can only be established by additional measured data in the new environment at the required transmission frequency. Over time, some classical propagation models have emerged, which are now used to predict large-scale coverage for mobile communication systems design. By using path loss models to estimate the received signal level as a function of distance, it becomes possible to predict the SNR for a mobile communication system. Using noise analysis techniques given in Appendix B, the noise floor can be determined. For example, the two-ray model described in Section 4.6 was used to estimate capacity in a spread spectrum cellular system, before such systems were deployed [Rap92b]. Practical path loss estimation techniques are now presented.
Both theoretical and measurement-based propagation models indicate that average received signal power decreases logarithmically with distance, whether in outdoor or indoor radio channels. Such models have been used extensively in the literature. The average large-scale path loss for an arbitrary T–R separation is expressed as a function of distance by using a path loss exponent, n
or
where n is the path loss exponent which indicates the rate at which the path loss increases with distance, d0 is the close-in reference distance which is determined from measurements close to the transmitter, and d is the T–R separation distance. The bars in Equations (4.67) and (4.68) denote the ensemble average of all possible path loss values for a given value of d. When plotted on a log–log scale, the modeled path loss is a straight line with a slope equal to 10n dB per decade. The value of n depends on the specific propagation environment. For example, in free space, n is equal to 2, and when obstructions are present, n will have a larger value.
It is important to select a free space reference distance that is appropriate for the propagation environment. In large coverage cellular systems, 1 km reference distances are commonly used [Lee85], whereas in microcellular systems, much smaller distances (such as 100 m or 1 m) are used. The reference distance should always be in the far field of the antenna so that near-field effects do not alter the reference path loss. The reference path loss is calculated using the free space path loss formula given by Equation (4.5) or through field measurements at distance d0. Table 4.2 lists typical path loss exponents obtained in various mobile radio environments.
The model in Equation (4.68) does not consider the fact that the surrounding environmental clutter may be vastly different at two different locations having the same T–R separation. This leads to measured signals which are vastly different than the average value predicted by Equation (4.68). Measurements have shown that at any value of d, the path loss PL(d) at a particular location is random and distributed log-normally (normal in dB) about the mean distance-dependent value [Cox84], [Ber87]. That is
and
where Xσ is a zero-mean Gaussian distributed random variable (in dB) with standard deviation σ (also in dB).
The log-normal distribution describes the random shadowing effects which occur over a large number of measurement locations which have the same T–R separation, but have different levels of clutter on the propagation path. This phenomenon is referred to as log-normal shadowing. Simply put, log-normal shadowing implies that measured signal levels at a specific T–R separation have a Gaussian (normal) distribution about the distance-dependent mean of (4.68), where the measured signal levels have values in dB units. The standard deviation of the Gaussian distribution that describes the shadowing also has units in dB. Thus, the random effects of shadowing are accounted for using the Gaussian distribution which lends itself readily to evaluation (see Appendix F).
The close-in reference distance d0, the path loss exponent n, and the standard deviation σ, statistically describe the path loss model for an arbitrary location having a specific T–R separation, and this model may be used in computer simulation to provide received power levels for random locations in communication system design and analysis.
In practice, the values of n and σ are computed from measured data, using linear regression such that the difference between the measured and estimated path losses is minimized in a mean square error sense over a wide range of measurement locations and T–R separations. The value of ![]() in (4.69.a) is based on either close-in measurements or on a free space assumption from the transmitter to d0. An example of how the path loss exponent is determined from measured data follows. Figure 4.17 illustrates actual measured data in several cellular radio systems and demonstrates the random variations about the mean path loss (in dB) due to shadowing at specific T–R separations.
in (4.69.a) is based on either close-in measurements or on a free space assumption from the transmitter to d0. An example of how the path loss exponent is determined from measured data follows. Figure 4.17 illustrates actual measured data in several cellular radio systems and demonstrates the random variations about the mean path loss (in dB) due to shadowing at specific T–R separations.
Since PL(d) is a random variable with a normal distribution in dB about the distance-dependent mean, so is Pr(d), and the Q-function or error function (erf) may be used to determine the probability that the received signal level will exceed (or fall below) a particular level. The Q-function is defined as

where
The probability that the received signal level (in dB power units) will exceed a certain value γ can be calculated from the cumulative density function as
Similarly, the probability that the received signal level will be below γ is given by
Appendix F provides tables for evaluating the Q and erf functions.
It is clear that due to random effects of shadowing, some locations within a coverage area will be below a particular desired received signal threshold. It is often useful to compute how the boundary coverage relates to the percent of area covered within the boundary. For a circular coverage area having radius R from a base station, let there be some desired received signal threshold γ. We are interested in computing U(γ), the percentage of useful service area (i.e. the percentage of area with a received signal that is equal or greater than γ), given a known likelihood of coverage at the cell boundary. Letting d = r represent the radial distance from the transmitter, it can be shown that if Pr[Pr(r)>γ] is the probability that the random received signal at d = r exceeds the threshold γ within an incremental area dA, then U(γ) can be found by [Jak74]
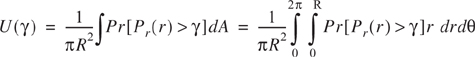
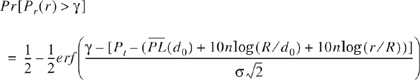
Using (4.71), Pr[Pr(r) > γ] is given by

In order to determine the path loss as referenced to the cell boundary (r = R), it is clear that
and Equation (4.74) may be expressed as
If we let ![]() and
and ![]() , then
, then

By substituting t = a + blog(r/R) in Equation (4.77), it can be shown that
By choosing the signal level such that ![]() (i.e. a = 0), U(γ) can be shown to be
(i.e. a = 0), U(γ) can be shown to be
Equation (4.78) may be evaluated for a large number of values of σ and n, as shown in Figure 4.18 [Reu74]. For example, if n = 4 and σ = 8 dB, and if the boundary is to have 75% boundary coverage (75% of the time the signal is to exceed the threshold at the boundary), then the area coverage is equal to 94%. If n = 2 and σ = 8 dB, a 75% boundary coverage provides 91% area coverage. If n = 3 and σ = 9 dB, then 50% boundary coverage provides 71% area coverage.
Example 4.9.
Four received power measurements were taken at distances of 100 m, 200 m, 1 km, and 3 km from a transmitter. These measured values are given in the following table. It is assumed that the path loss for these measurements follows the model in Equation (4.69.a), where d0 = 100 m: (a) find the minimum mean square error (MMSE) estimate for the path loss exponent, n; (b) calculate the standard deviation about the mean value; (c) estimate the received power at d = 2 km using the resulting model; (d) predict the likelihood that the received signal level at 2 km will be greater than −60 dBm; and (e) predict the percentage of area within a 2 km radius cell that receives signals greater than −60 dBm, given the result in (d).
Distance from Transmitter | Received Power |
|---|---|
100 m | 0 dBm |
200 m | −20 dBm |
1000 m | −35 dBm |
3000 m | −70 dBm |
Solution
The MMSE estimate may be found using the following method. Let pi be the received power at a distance di and let ![]() i be the estimate for pi using the (d/d0)n path loss model of Equation (4.67). The sum of squared errors between the measured and estimated values is given by
i be the estimate for pi using the (d/d0)n path loss model of Equation (4.67). The sum of squared errors between the measured and estimated values is given by

The value of n which minimizes the mean square error can be obtained by equating the derivative of J(n) to zero, and then solving for n.
Using Equation (4.68), we find
 i = pi(d0)−10nlog(di § 100 m). Recognizing that P(d0) = 0 dBm, we find the following estimates for i in dBm:1 = 0, 2 = −3n, 3 = −10n, 4 = −14.77n.
The sum of squared errors is then given by
Setting this equal to zero, the value of n is obtained as n = 4.4.
The sample variance σ2 = J(n)/4 at n = 4.4 can be obtained as follows.
J(n)
=
(0 + 0) + (−20 + 13.2)2 + (−35 + 44)2 + (−70 + 64.988)2
=
152.36.
σ2
=
152.36/4 = 38.09
therefore
σ = 617 dB, which is a biased estimate. In general, a greater number of measurements are needed to reduce σ2.
The estimate of the received power at d = 2 km is given by
(d = 2km) = 0 − 10(4.4)log(2000 § 100) = −57.24 dBm.A Gaussian random variable having zero mean and σ = 617 could be added to this value to simulate random shadowing effects at d = 2 km.
The probability that the received signal level will be greater than −60 dBm is given by
If 67.4% of the users on the boundary receive signals greater than −60 dBm, then Equation (4.78) or Figure 4.18 may be used to determine that 92% of the cell area receives coverage above −60 dBm.

Radio transmission in a mobile communications system often takes place over irregular terrain. The terrain profile of a particular area needs to be taken into account for estimating the path loss. The terrain profile may vary from a simple curved earth profile to a highly mountainous profile. The presence of trees, buildings, and other obstacles also must be taken into account. A number of propagation models are available to predict path loss over irregular terrain. While all these models aim to predict signal strength at a particular receiving point or in a specific local area (called a sector), the methods vary widely in their approach, complexity, and accuracy. Most of these models are based on a systematic interpretation of measurement data obtained in the service area. Some of the commonly used outdoor propagation models are now discussed.
The Longley–Rice model [Ric67], [Lon68] is applicable to point-to-point communication systems in the frequency range from 40 MHz to 100 GHz, over different kinds of terrain. The median transmission loss is predicted using the path geometry of the terrain profile and the refractivity of the troposphere. Geometric optics techniques (primarily the two-ray ground reflection model) are used to predict signal strengths within the radio horizon. Diffraction losses over isolated obstacles are estimated using the Fresnel–Kirchoff knife-edge models. Forward scatter theory is used to make troposcatter predictions over long distances, and far field diffraction losses in double horizon paths are predicted using a modified Van der Pol-Bremmer method. The Longley–Rice propagation prediction model is also referred to as the ITS irregular terrain model.
The Longley–Rice model is also available as a computer program [Lon78] to calculate large-scale median transmission loss relative to free space loss over irregular terrain for frequencies between 20 MHz and 10 GHz. For a given transmission path, the program takes as its input the transmission frequency, path length, polarization, antenna heights, surface refractivity, effective radius of earth, ground conductivity, ground dielectric constant, and climate. The program also operates on path-specific parameters such as horizon distance of the antennas, horizon elevation angle, angular trans-horizon distance, terrain irregularity, and other specific inputs.
The Longley–Rice method operates in two modes. When a detailed terrain path profile is available, the path-specific parameters can be easily determined and the prediction is called a point-to-point mode prediction. On the other hand, if the terrain path profile is not available, the Longley–Rice method provides techniques to estimate the path-specific parameters, and such a prediction is called an area mode prediction.
There have been many modifications and corrections to the Longley–Rice model since its original publication. One important modification [Lon78] deals with radio propagation in urban areas, and this is particularly relevant to mobile radio. This modification introduces an excess term as an allowance for the additional attenuation due to urban clutter near the receiving antenna. This extra term, called the urban factor (UF), has been derived by comparing the predictions by the original Longley–Rice model with those obtained by Okumura [Oku68].
One shortcoming of the Longley–Rice model is that it does not provide a way of determining corrections due to environmental factors in the immediate vicinity of the mobile receiver, or consider correction factors to account for the effects of buildings and foliage. Further, multipath is not considered.
A classical propagation prediction approach similar to that used by Longley–Rice is discussed by Edwards and Durkin [Edw69], as well as Dadson [Dad75]. These papers describe a computer simulator, for predicting field strength contours over irregular terrain, that was adopted by the Joint Radio Committee (JRC) in the U.K. for the estimation of effective mobile radio coverage areas. Although this simulator only predicts large-scale phenomena (i.e. path loss), it provides an interesting perspective into the nature of propagation over irregular terrain and the losses caused by obstacles in a radio path. An explanation of the Edwards and Durkin method is presented here in order to demonstrate how all of the concepts described in this chapter are used in a single model.
The execution of the Durkin path loss simulator consists of two parts. The first part accesses a topographic data base of a proposed service area and reconstructs the ground profile information along the radial joining the transmitter to the receiver. The assumption is that the receiving antenna receives all of its energy along that radial and, therefore, experiences no multipath propagation. In other words, the propagation phenomena that is modeled is simply LOS and diffraction from obstacles along the radial, and excludes reflections from other surrounding objects and local scatterers. The effect of this assumption is that the model is somewhat pessimistic in narrow valleys, although it identifies isolated weak reception areas rather well. The second part of the simulation algorithm calculates the expected path loss along that radial. After this is done, the simulated receiver location can be iteratively moved to different locations in the service area to deduce the signal strength contour.
The topographical data base can be thought of as a two-dimensional array. Each array element corresponds to a point on a service area map while the actual contents of each array element contain the elevation above sea level data as shown in Figure 4.19. These types of digital elevation models (DEM) are readily available from the United States Geological Survey (USGS). Using this quantized map of service area heights, the program reconstructs the ground profile along the radial that joins the transmitter and the receiver. Since the radial may not always pass through discrete data points, interpolation methods are used to determine the approximate heights that are observed when looking along that radial. Figure 4.20a shows the topographic grid with arbitrary transmitter and receiver locations, the radial between the transmitter and receiver, and the points with which to use diagonal linear interpolation. Figure 4.20b also shows what a typical reconstructed radial terrain profile might look like. In actuality, the values are not simply determined by one interpolation routine, but by a combination of three for increased accuracy. Therefore, each point of the reconstructed profile consists of an average of the heights obtained by diagonal, vertical (row), and horizontal (column) interpolation methods. From these interpolation routines, a matrix of distances from the receiver and corresponding heights along the radial is generated. Now the problem is reduced to a one-dimensional point-to-point link calculation. These types of problems are well-established and procedures for calculating path loss using knife-edge diffraction techniques described previously are used.
At this point, the algorithm must make decisions as to what the expected transmission loss should be. The first step is to decide whether a line-of-sight (LOS) path exists between the transmitter and the receiver. To do this, the program computes the difference, δj, between the height of the line joining the transmitter and receiver antennas from the height of the ground profile for each point along the radial (see Figure 4.21).
If any δj(j = 1, .....,n) is found to be positive along the profile, it is concluded that a LOS path does not exist, otherwise it can be concluded that a LOS path does exist. Assuming the path has a clear LOS, the algorithm then checks to see whether first Fresnel zone clearance is achieved. As shown earlier, if the first Fresnel zone of the radio path is unobstructed, then the resulting loss mechanism is approximately that of free space. If there is an obstruction that just barely touches the line joining the transmitter and the receiver then the signal strength at the receiver is 6 dB less than the free space value due to energy diffracting off the obstruction and away from the receiver. The method for determining first Fresnel zone clearance is done by first calculating the Fresnel diffraction parameter v, defined in Equation (4.59), for each of the j ground elements.
If vj≤ −0.8 for all j = 1, ....,n, then free space propagation conditions are dominant. For this case, the received power is calculated using the free space transmission formula given in Equation (4.1). If the terrain profile failed the first Fresnel zone test (i.e. any vj > −0.8), then there are two possibilities:
Non-LOS
LOS, but with inadequate first Fresnel-zone clearance.
For both of these cases, the program calculates the free space power using Equation (4.1) and the received power using the plane earth propagation equation given by Equation (4.52). The algorithm then selects the smaller of the powers calculated with Equations (4.1) and (4.52) as the appropriate received power for the terrain profile. If the profile is LOS with inadequate first Fresnel zone clearance, the next step is to calculate the additional loss due to inadequate Fresnel zone clearance and add it (in dB) to the appropriate received power. This additional diffraction loss is calculated by Equation (4.60).
For the case of non-LOS, the system grades the problem into one of four categories:
Single diffraction edge
Two diffraction edges
Three diffraction edges
More than three diffraction edges
The method tests for each case sequentially until it finds the one that fits the given profile. A diffraction edge is detected by computing the angles between the line joining the transmitter and receiver antennas and the lines joining the receiver antenna to each point on the reconstructed terrain profile. The maximum of these angles is located and labeled by the profile point (di, hi). Next, the algorithm steps through the reverse process of calculating the angles between the line joining the transmitter and receiver antennas and the lines joining the transmitter antenna to each point on the reconstructed terrain profile. The maximum of these angles is found, and it occurs at (dj, hj) on the terrain profile. If di = dj, then the profile can be modeled as a single diffraction edge. The Fresnel parameter, vj, associated with this edge can be determined from the length of the obstacle above the line joining the transmitter and receiver antennas. The loss can then be evaluated by calculating PL using the Equation (4.60). This extra loss caused by the obstacle is then added to either the free space or plane earth loss, whichever is greater.
If the condition for a single diffraction edge is not satisfied, then the check for two diffraction edges is executed. The test is similar to that for a single diffraction edge, with the exception that the computer looks for two edges in sight of each other (see Figure 4.22).
The Edwards and Durkin [Edw69] algorithm uses the Epstein and Peterson method [Eps53] to calculate the loss associated with two diffraction edges. In short, it is the sum of two attenuations. The first attenuation is the loss at the second diffraction edge caused by the first diffraction edge with the transmitter as the source. The second attenuation is the loss at the receiver caused by the second diffraction edge with the first diffraction edge as the source. The two attenuations sum to give the additional loss caused by the obstacles that is added to the free space loss or the plane earth loss, whichever is larger.
For three diffraction edges, the outer diffraction edges must contain a single diffraction edge in between. This is detected by calculating the line between the two outer diffraction edges. If an obstacle between the two outer edges passes through the line, then it is concluded that a third diffraction edge exists (see Figure 4.22). Again, the Epstein and Peterson method is used to calculate the shadow loss caused by the obstacles. For all other cases of more than three diffraction edges, the profile between the outer two obstacles is approximated by a single, virtual knife edge. After the approximation, the problem is that of a three edge calculation.
This method is very attractive because it can read in a digital elevation map and perform a site-specific propagation computation on the elevation data. It can produce a signal strength contour that has been reported to be good within a few dB. The disadvantages are that it cannot adequately predict propagation effects due to foliage, buildings, other man-made structures, and it does not account for multipath propagation other than ground reflection, so additional loss factors are often included. Propagation prediction algorithms which use terrain information are typically used for the design of modern wireless systems.
Okumura’s model is one of the most widely used models for signal prediction in urban areas. This model is applicable for frequencies in the range 150 MHz to 1920 MHz (although it is typically extrapolated up to 3000 MHz) and distances of 1 km to 100 km. It can be used for base station antenna heights ranging from 30 m to 1000 m.
Okumura developed a set of curves giving the median attenuation relative to free space (Amu), in an urban area over a quasi-smooth terrain with a base station effective antenna height (hte) of 200 m and a mobile antenna height (hre) of 3 m. These curves were developed from extensive measurements using vertical omnidirectional antennas at both the base and mobile, and are plotted as a function of frequency in the range 100 MHz to 1920 MHz and as a function of distance from the base station in the range 1 km to 100 km. To determine path loss using Okumura’s model, the free space path loss between the points of interest is first determined, and then the value of Amu(f, d) (as read from the curves) is added to it along with correction factors to account for the type of terrain. The model can be expressed as
where L50 is the 50th percentile (i.e., median) value of propagation path loss, LF is the free space propagation loss, Amu is the median attenuation relative to free space, G(hte) is the base station antenna height gain factor, G(hre) is the mobile antenna height gain factor, and GAREA is the gain due to the type of environment. Note that the antenna height gains are strictly a function of height and have nothing to do with antenna patterns.
Plots of Amu(f, d) and GAREA for a wide range of frequencies are shown in Figure 4.23 and Figure 4.24. Furthermore, Okumura found that G(hte) varies at a rate of 20 dB/decade and G(hre) varies at a rate of 10 dB/decade for heights less than 3 m
Other corrections may also be applied to Okumura’s model. Some of the important terrain related parameters are the terrain undulation height (Δh), isolated ridge height, average slope of the terrain and the mixed land–sea parameter. Once the terrain related parameters are calculated, the necessary correction factors can be added or subtracted as required. All these correction factors are also available as Okumura curves [Oku68].
Okumura’s model is wholly based on measured data and does not provide any analytical explanation. For many situations, extrapolations of the derived curves can be made to obtain values outside the measurement range, although the validity of such extrapolations depends on the circumstances and the smoothness of the curve in question.
Okumura’s model is considered to be among the simplest and best in terms of accuracy in path loss prediction for mature cellular and land mobile radio systems in cluttered environments. It is very practical and has become a standard for system planning in modern land mobile radio systems in Japan. The major disadvantage with the model is its slow response to rapid changes in terrain, therefore the model is fairly good in urban and suburban areas, but not as good in rural areas. Common standard deviations between predicted and measured path loss values are around 10 dB to 14 dB.
Example 4.10.
Find the median path loss using Okumura’s model for d = 50 km, hte = 100 m, hre = 10 m in a suburban environment. If the base station transmitter radiates an EIRP of 1 kW at a carrier frequency of 900 MHz, find the power at the receiver (assume a unity gain receiving antenna).
Solution
The free space path loss LF can be calculated using Equation (4.6) as
From the Okumura curves
Amu(900 MHz(50 km)) = 43 dB |
and
GAREA = 9 dB. |
Using Equation (4.81.a) and (4.81.c), we have

Using Equation (4.80), the total mean path loss is
L50(dB) | = | LF + Amu(f, d) − G(hte) − G(hre) − GAREA |
= | 125.5 dB + 43 dB −(−6) dB − 10.46 dB −9 dB | |
= | 155.04 dB. |
Therefore, the median received power is
Pr(d) | = | EIRP(dBm) − L50(dB) + Gr(dB) |
= | 60 dBm − 155.04 dB + 0 dB = −95.04 dBm. |
The Hata model [Hat90] is an empirical formulation of the graphical path loss data provided by Okumura, and is valid from 150 MHz to 1500 MHz. Hata presented the urban area propagation loss as a standard formula and supplied correction Equations for application to other situations. The standard formula for median path loss in urban areas is given by
where fc is the frequency (in MHz) from 150 MHz to 1500 MHz, hte is the effective transmitter (base station) antenna height (in meters) ranging from 30 m to 200 m, hre is the effective receiver (mobile) antenna height (in meters) ranging from 1 m to 10 m, d is the T–R separation distance (in km), and a(hre) is the correction factor for effective mobile antenna height which is a function of the size of the coverage area. For a small to medium sized city, the mobile antenna correction factor is given by
and for a large city, it is given by
To obtain the path loss in a suburban area, the standard Hata formula in Equation (4.82) is modified as
and for path loss in open rural areas, the formula is modified as
Although Hata’s model does not have any of the path-specific corrections which are available in Okumura’s model, the above expressions have significant practical value. The predictions of the Hata model compare very closely with the original Okumura model, as long as d exceeds 1 km. This model is well suited for large cell mobile systems, but not personal communications systems (PCS) which have cells on the order of 1 km radius.
The European Cooperative for Scientific and Technical research (EURO-COST) formed the COST-231 working committee to develop an extended version of the Hata model. COST-231 proposed the following formula to extend Hata’s model to 2 GHz. The proposed model for path loss is [EUR91]
where a(hre) is defined in Equations (4.83), (4.84.a), and (4.84.b) and
The COST-231 extension of the Hata model is restricted to the following range of parameters:
f | : 1500 MHz to 2000 MHz |
hte | : 30 m to 200 m |
hre | : 1 m to 10 m |
d | : 1 km to 20 km |
A model developed by Walfisch and Bertoni [Wal88] considers the impact of rooftops and building height by using diffraction to predict average signal strength at street level. The model considers the path loss, S, to be a product of three factors.
where p0 represents free space path loss between isotropic antennas given by
The factor Q2 gives the reduction in the rooftop signal due to the row of buildings which immediately shadow the receiver at street level. The P1 term is based upon diffraction and determines the signal loss from the rooftop to the street.
In dB, the path loss is given by
where L0 represents free space loss, Lrts represents the “rooftop-to-street diffraction and scatter loss,” and Lms denotes multiscreen diffraction loss due to the rows of buildings [Xia92]. Figure 4.25 illustrates the geometry used in the Walfisch Bertoni model [Wal88], [Mac93]. This model is being considered for use by ITU-R in the IMT-2000 standards activities.
Work by Feuerstein et al. in 1991 used a 20 MHz pulsed transmitter at 1900 MHz to measure path loss, outage, and delay spread in typical microcellular systems in San Francisco and Oakland. Using base station antenna heights of 3.7 m, 8.5 m, and 13.3 m, and a mobile receiver with an antenna height of 1.7 m above ground, statistics for path loss, multipath, and coverage area were developed from extensive measurements in line-of-sight (LOS) and obstructed (OBS) environments [Feu94]. This work revealed that a two-ray ground reflection model (shown in Figure 4.7) is a good estimate for path loss in LOS microcells, and a simple log-distance path loss model holds well for OBS microcell environments.
For a flat earth ground reflection model, the distance df at which the first Fresnel zone just becomes obstructed by the ground (first Fresnel zone clearance) is given by

For LOS cases, a double regression path loss model that uses a regression breakpoint at the first Fresnel zone clearance was shown to fit well to measurements. The model assumes omnidirectional vertical antennas and predicts average path loss as
where p1 is equal to ![]() (the path loss in decibels at the reference distance of d0 = 1 m), d is in meters and n1, n2 are path loss exponents which are a function of transmitter height, as given in Figure 4.8. It can easily be shown that at 1900 MHz, p1 = 38.0 dB.
(the path loss in decibels at the reference distance of d0 = 1 m), d is in meters and n1, n2 are path loss exponents which are a function of transmitter height, as given in Figure 4.8. It can easily be shown that at 1900 MHz, p1 = 38.0 dB.
For the OBS case, the path loss was found to fit the standard log-distance path loss law of Equation (4.69.a)
where n is the OBS path loss exponent given in Figure 4.26 as a function of transmitter height. The standard deviation (in dB) of the log-normal shadowing component about the distance-dependent mean was found from measurements using the techniques described in Example 4.9. The log-normal shadowing component is also listed as a function of height for both the LOS and OBS microcell environments. Figure 4.26 indicates that the log-normal shadowing component is between 7 and 9 dB regardless of antenna height. It can be seen that LOS environments provide slightly less path loss than the theoretical two-ray ground reflected model, which would predict n1 = 2 and n2 = 4.
With the advent of Personal Communication Systems (PCS), there is a great deal of interest in characterizing radio propagation inside buildings. The indoor radio channel differs from the traditional mobile radio channel in two aspects—the distances covered are much smaller, and the variability of the environment is much greater for a much smaller range of T–R separation distances. It has been observed that propagation within buildings is strongly influenced by specific features such as the layout of the building, the construction materials, and the building type. This section outlines models for path loss within buildings.
Indoor radio propagation is dominated by the same mechanisms as outdoor: reflection, diffraction, and scattering. However, conditions are much more variable. For example, signal levels vary greatly depending on whether interior doors are open or closed inside a building. Where antennas are mounted also impacts large-scale propagation. Antennas mounted at desk level in a partitioned office receive vastly different signals than those mounted on the ceiling. Also, the smaller propagation distances make it more difficult to insure far-field radiation for all receiver locations and types of antennas.
The field of indoor radio propagation is relatively new, with the first wave of research occurring in the early 1980s. Cox [Cox83b] at AT&T Bell Laboratories and Alexander [Ale82] at British Telecom were the first to carefully study indoor path loss in and around a large number of homes and office buildings. Excellent literature surveys are available on the topic of indoor propagation [Mol91], [Has93].
In general, indoor channels may be classified either as line-of-sight (LOS) or obstructed (OBS), with varying degrees of clutter [Rap89]. Some of the key models which have recently emerged are now presented.
Buildings have a wide variety of partitions and obstacles which form the internal and external structure. Houses typically use a wood frame partition with plaster board to form internal walls and have wood or nonreinforced concrete between floors. Office buildings, on the other hand, often have large open areas (open plan) which are constructed by using moveable office partitions so that the space may be reconfigured easily, and use metal reinforced concrete between floors. Partitions that are formed as part of the building structure are called hard partitions, and partitions that may be moved and which do not span to the ceiling are called soft partitions. Partitions vary widely in their physical and electrical characteristics, making it difficult to apply general models to specific indoor installations. Nevertheless, researchers have formed extensive data bases of losses for a great number of partitions, as shown in Table 4.3.
Table 4.3. Average Signal Loss Measurements Reported by Various Researchers for Radio Paths Obstructed by Common Building Material
Material Type | Loss (dB) | Frequency | Reference |
|---|---|---|---|
All metal | 26 | 815 MHz | |
Aluminum siding | 20.4 | 815 MHz | |
Foil insulation | 3.9 | 815 MHz | |
Concrete block wall | 13 | 1300 MHz | |
Loss from one floor | 20-30 | 1300 MHz | |
Loss from one floor and one wall | 40-50 | 1300 MHz | |
Fade observed when transmitter turned a right angle corner in a corridor | 10-15 | 1300 MHz | |
Light textile inventory | 3-5 | 1300 MHz | |
Chain-like fenced in area 20 ft high containing tools, inventory, and people | 5-12 | 1300 MHz | |
Metal blanket — 12 sq ft | 4-7 | 1300 MHz | |
Metallic hoppers which hold scrap metal for recycling — 10 sq ft | 3-6 | 1300 MHz | |
Small metal pole — 6″ diameter | 3 | 1300 MHz | |
Metal pulley system used to hoist metal inventory — 4 sq ft | 6 | 1300 MHz | |
Light machinery < 10 sq ft | 1-4 | 1300 MHz | |
General machinery — 10 - 20 sq ft | 5-10 | 1300 MHz | |
Heavy machinery > 20 sq ft | 10-12 | 1300 MHz | |
Metal catwalk/stairs | 5 | 1300 MHz | |
Light textile | 3-5 | 1300 MHz | |
Heavy textile inventory | 8-11 | 1300 MHz | |
Area where workers inspect metal finished products for defects | 3-12 | 1300 MHz | |
Metallic inventory | 4-7 | 1300 MHz | |
Large 1-beam — 16 - 20″ | 8-10 | 1300 MHz | |
Metallic inventory racks — 8 sq ft | 4-9 | 1300 MHz | |
Empty cardboard inventory boxes | 3-6 | 1300 MHz | |
Concrete block wall | 13-20 | 1300 MHz | |
Ceiling duct | 1-8 | 1300 MHz | |
2.5 m storage rack with small metal parts (loosely packed) | 4-6 | 1300 MHz | |
4 m metal box storage | 10-12 | 1300 MHz | |
5 m storage rack with paper products (loosely packed) | 2-4 | 1300 MHz | |
5 m storage rack with large paper products (tightly packed) | 6 | 1300 MHz | |
5 m storage rack with large metal parts (tightly packed) | 20 | 1300 MHz | |
Typical N/C machine | 8-10 | 1300 MHz | |
Semi-automated assembly line | 5-7 | 1300 MHz | |
0.6 m square reinforced concrete pillar | 12-14 | 1300 MHz | |
Stainless steel piping for cook-cool process | 15 | 1300 MHz | |
Concrete wall | 8-15 | 1300 MHz | |
Concrete floor | 10 | 1300 MHz | |
Commercial absorber | 38 | 9.6 GHz | |
Commercial absorber | 51 | 28.8 GHz | |
Commercial absorber | 59 | 57.6 GHz | |
Sheetrock (3/8 in) — 2 sheets | 2 | 9.6 GHz | |
Sheetrock (3/8 in) — 2 sheets | 2 | 28.8 GHz | |
Sheetrock (3/8 in) — 2 sheets | 5 | 57.6 GHz | |
Dry plywood (3/4 in) — 1 sheet | 1 | 9.6 GHz | |
Dry plywood (3/4 in) — 1 sheet | 4 | 28.8 GHz | |
Dry plywood (3/4 in) — 1 sheet | 8 | 57.6 GHz | |
Dry plywood (3/4 in) — 2 sheets | 4 | 9.6 GHz | |
Dry plywood (3/4 in) — 2 sheets | 6 | 28.8 GHz | |
Dry plywood (3/4 in) — 2 sheets | 14 | 57.6 GHz | |
Wet plywood (3/4 in) — 1 sheet | 19 | 9.6 GHz | |
Wet plywood (3/4 in) — 1 sheet | 32 | 28.8 GHz | |
Wet plywood (3/4 in) — 1 sheet | 59 | 57.6 GHz | |
Wet plywood (3/4 in) — 2 sheets | 39 | 9.6 GHz | |
Wet plywood (3/4 in) — 2 sheets | 46 | 28.8 GHz | |
Wet plywood (3/4 in) — 2 sheets | 57 | 57.6 GHz | |
Aluminum (1/8 in) — 1 sheet | 47 | 9.6 GHz | |
Aluminum (1/8 in) — 1 sheet | 46 | 28.8 GHz | |
Aluminum (1/8 in) — 1 sheet | 53 | 57.6 GHz |
The losses between floors of a building are determined by the external dimensions and materials of the building, as well as the type of construction used to create the floors and the external surroundings [Sei92a], [Sei92b]. Even the number of windows in a building and the presence of tinting (which attenuates radio energy) can impact the loss between floors. Table 4.4 illustrates values for floor attenuation factors (FAF) in three buildings in San Francisco [Sei92a]. It can be seen that for all three buildings, the attenuation between one floor of the building is greater than the incremental attenuation caused by each additional floor. Table 4.5 illustrates very similar tendencies. After about five or six floor separations, very little additional path loss is experienced.
Table 4.4. Total Floor Attenuation Factor and Standard Deviation σ (dB) for Three Buildings. Each Point Represents the Average Path Loss Over a 20λ Measurement Track [Sei92a]
Building | 915 MHz FAF (dB) | τ (dB) | Number of locations | 1900 MHz FAF (dB) | τ (dB) | Number of locations |
|---|---|---|---|---|---|---|
Walnut Creek | ||||||
One Floor | 33.6 | 3.2 | 25 | 31.3 | 4.6 | 110 |
Two Floors | 44.0 | 4.8 | 39 | 38.5 | 4.0 | 29 |
SF PacBell | ||||||
One Floor | 13.2 | 9.2 | 16 | 26.2 | 10.5 | 21 |
Two Floors | 18.1 | 8.0 | 10 | 33.4 | 9.9 | 21 |
Three Floors | 24.0 | 5.6 | 10 | 35.2 | 5.9 | 20 |
Four Floors | 27.0 | 6.8 | 10 | 38.4 | 3.4 | 20 |
Five Floors | 27.1 | 6.3 | 10 | 46.4 | 3.9 | 17 |
San Ramon | ||||||
One Floor | 29.1 | 5.8 | 93 | 35.4 | 6.4 | 74 |
Two Floors | 36.6 | 6.0 | 81 | 35.6 | 5.9 | 41 |
Three Floors | 39.6 | 6.0 | 70 | 35.2 | 3.9 | 27 |
Table 4.5. Average Floor Attenuation Factor in dB for One, Two, Three, and Four Floors in Two Office Buildings [Sei92b]
Indoor path loss has been shown by many researchers to obey the distance power law in Equation (4.93)
where the value of n depends on the surroundings and building type, and Xσ represents a normal random variable in dB having a standard deviation of σ dB. Notice that Equation (4.93) is identical in form to the log-normal shadowing model of Equation (4.69.a). Typical values for various buildings are provided in Table 4.6 [And94].
Table 4.6. Path Loss Exponent and Standard Deviation Measured in Different Buildings [And94]
Building | Frequency (MHz) | n | τ (dB) |
|---|---|---|---|
Retail Stores | 914 | 2.2 | 8.7 |
Grocery Store | 914 | 1.8 | 5.2 |
Office, hard partition | 1500 | 3.0 | 7.0 |
Office, soft partition | 900 | 2.4 | 9.6 |
Office, soft partition | 1900 | 2.6 | 14.1 |
Factory LOS | |||
Textile/Chemical | 1300 | 2.0 | 3.0 |
Textile/Chemical | 4000 | 2.1 | 7.0 |
Paper/Cereals | 1300 | 1.8 | 6.0 |
Metalworking | 1300 | 1.6 | 5.8 |
Suburban Home | |||
Indoor Street | 900 | 3.0 | 7.0 |
Factory OBS | |||
Textile/Chemical | 4000 | 2.1 | 9.7 |
Metalworking | 1300 | 3.3 | 6.8 |
The Ericsson radio system model was obtained by measurements in a multiple floor office building [Ake88]. The model has four breakpoints and considers both an upper and lower bound on the path loss. The model also assumes that there is 30 dB attenuation at d0 = 1 m, which can be shown to be accurate for f = 900 MHz and unity gain antennas. Rather than assuming a log-normal shadowing component, the Ericsson model provides a deterministic limit on the range of path loss at a particular distance. Bernhardt [Ber89] used a uniform distribution to generate path loss values within the maximum and minimum range as a function of distance for in-building simulation. Figure 4.27 shows a plot of in-building path loss based on the Ericsson model as a function of distance.
An in-building site-specific propagation model that includes the effect of building type as well as the variations caused by obstacles was described by Seidel [Sei92b] and has been used to accurately deploy indoor and campus networks [Mor00, Ski96]. This model provides flexibility and was shown to reduce the standard deviation between measured and predicted path loss to around 4 dB, as compared to 13 dB when only a log-distance model was used in two different buildings. The attenuation factor model is given by
where nSF represents the exponent value for the “same floor” measurement, FAF represents a floor attenuation factor for a specified number of building floors, and PAF represents the partition attenuation factor for a specific obstruction encountered by a ray drawn between the transmitter and receiver in 3-D. This technique of drawing a single ray between the transmitter and receiver is called primary ray tracing. Summing the cumulative partition losses along the primary ray has been shown to yield excellent accuracy while offering tremendous computational efficiency [Mor00, Ski96, Rap00]. Thus, if a good estimate for n exists (e.g., selected from Table 4.4 or Table 4.6) on the same floor, then the path loss on a different floor can be predicted by adding an appropriate value of FAF (e.g., selected from Table 4.5), and then summing the partition losses selected from Table 4.3. Alternatively, in Equation (4.94), FAF may be replaced by an exponent which already considers the effects of multiple floor separation
where nMF denotes a path loss exponent based on measurements through multiple floors.
Table 4.7 illustrates typical values of n for a wide range of locations in many buildings. This table also illustrates how the standard deviation decreases as the average region becomes smaller and more site specific. Scatter plots illustrating actual measured path loss in two multi-floored office buildings are shown in Figure 4.28 and Figure 4.29.
Table 4.7. Path Loss Exponent and Standard Deviation for Various Types of Buildings [Sei92b]
n | τ (dB) | Number of locations | |
|---|---|---|---|
All Buildings: | |||
| 3.14 | 16.3 | 634 |
| 2.76 | 12.9 | 501 |
| 4.19 | 5.1 | 73 |
| 5.04 | 6.5 | 30 |
| 5.22 | 6.7 | 30 |
| 1.81 | 5.2 | 89 |
| 2.18 | 8.7 | 137 |
Office Building 1: | |||
| 3.54 | 12.8 | 320 |
| 3.27 | 11.2 | 238 |
| 2.68 | 8.1 | 104 |
| 4.01 | 4.3 | 118 |
| 3.18 | 4.4 | 120 |
Office Building 2: | |||
| 4.33 | 13.3 | 100 |
| 3.25 | 5.2 | 37 |
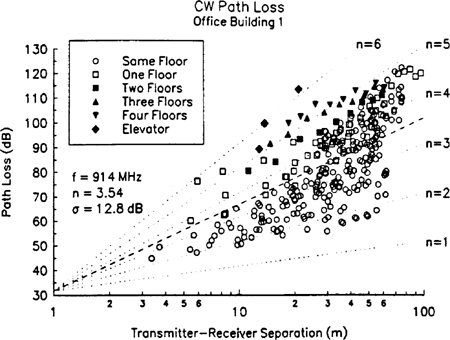
Devasirvatham et al. [Dev90b] found that in-building path loss obeys free space plus an additional loss factor which increases exponentially with distance, as shown in Table 4.8. Based on this work in multi-floor buildings, it would be possible to modify Equation (4.94) such that
Table 4.8. Free Space Plus Linear Path Attenuation Model [Dev90b]
Location | Frequency | β—Attenuation (dB/m) |
|---|---|---|
Building 1: 4 story | 850 MHz | 0.62 |
1.7 GHz | 0.57 | |
4.0 GHz | 0.47 | |
Building 2: 2 story | 850 MHz | 0.48 |
1.7 GHz | 0.35 | |
4.0 GHz | 0.23 |
where α is the attenuation constant for the channel with units of dB per meter (dB/m). Table 4.8 provides typical values of α as a function of frequency as measured in [Dev90b].
Example 4.11.
This example demonstrates how to use Equations (4.94) and (4.95) to predict the mean path loss 30 m from the transmitter, through three floors of Office Building 1 (see Table 4.5). Assume that two concrete block walls are between the transmitter and receiver on the intermediate floors. From Table 4.5, the mean path loss exponent for same-floor measurements in a building is n = 3.27, the mean path loss exponent for three-floor measurements is n = 5.22, and the average floor attenuation factor is FAF = 24.4 dB for three floors between the transmitter and receiver. Table 4.3 shows a concrete block wall has about 13 dB of attenuation.
Solution
The mean path loss using Equation (4.94) is
The mean path loss using Equation (4.95) is
The signal strength received inside of a building due to an external transmitter is important for wireless systems that share frequencies with neighboring buildings or with outdoor systems. As with propagation measurements between floors, it is difficult to determine exact models for penetration as only a limited number of experiments have been published, and they are sometimes difficult to compare. However, some generalizations can be made from the literature. In measurements reported to date, signal strength received inside a building increases with height. At the lower floors of a building, the urban clutter induces greater attenuation and reduces the level of penetration. At higher floors, a LOS path may exist, thus causing a stronger incident signal at the exterior wall of the building.
RF penetration has been found to be a function of frequency as well as height within the building. The antenna pattern in the elevation plane also plays an important role in how much signal penetrates a building from the outside. Most measurements have considered outdoor transmitters with antenna heights far less than the maximum height of the building under test. Measurements in Liverpool [Tur87] showed that penetration loss decreases with increasing frequency. Specifically, penetration attenuation values of 16.4 dB, 11.6 dB, and 7.6 dB were measured on the ground floor of a building at frequencies of 441 MHz, 896.5 MHz, and 1400 MHz, respectively. Measurements by Turkmani [Tur92] showed penetration loss of 14.2 dB, 13.4 dB, and 12.8 dB for 900 MHz, 1800 MHz, and 2300 MHz, respectively. Measurements made in front of windows indicated 6 dB less penetration loss on average than did measurements made in parts of the buildings without windows.
Walker [Wal92] measured radio signals into fourteen different buildings in Chicago from seven external cellular transmitters. Results showed that building penetration loss decreased at a rate of 1.9 dB per floor from the ground level up to the fifteenth floor and then began increasing above the fifteenth floor. The increase in penetration loss at higher floors was attributed to shadowing effects of adjacent buildings. Similarly, Turkmani [Tur87] reported penetration loss decreased at a rate of 2 dB per floor from the ground level up to the ninth floor and then increased above the ninth floor. Similar results were also reported by Durante [Dur73].
Measurements have shown that the percentage of windows, when compared with the building face surface area, impacts the level of RF penetration loss, as does the presence of tinted metal in the windows. Metallic tints can provide from 3 dB to 30 dB RF attenuation in a single pane of glass. The angle of incidence of the transmitted wave upon the face of the building also has a strong impact on the penetration loss, as was shown by Horikishi [Hor86].
In recent years, the computational and visualization capabilities of computers have accelerated rapidly. New methods for predicting radio signal coverage involve the use of Site Specific (SISP) propagation models and graphical information system (GIS) databases [Rus93]. SISP models support ray tracing as a means of deterministically modeling any indoor or outdoor propagation environment. Through the use of building databases, which may be drawn or digitized using standard graphical software packages, wireless system designers are able to include accurate representations of building and terrain features.
For outdoor propagation prediction, ray tracing techniques are used in conjunction with aerial photographs so that three-dimensional (3-D) representations of buildings may be integrated with software that carries out reflection, diffraction, and scattering models. Photogrammetric techniques are used to convert aerial or satellite photographs of cities into usable 3-D databases for the models [Sch92], [Ros93], [Wag94], [Rap00]. In indoor environments, architectural drawings provide a site specific representation for propagation models [Val93], [Sei94], [Kre94], [Ski96], [Mor00].
As building databases become prevalent, wireless systems will be developed using computer aided design tools that provide deterministic, rather than statistical, prediction models of small-scale and large-scale path loss in a wide range of operating environments. For example, in the SitePlanner® computer-aided design (CAD) environment, measurements and predictions of coverage and capacity may be simultaneously viewed, manipulated, optimized, and then archived for future use [Rap00]. SitePlanner® has become a popular research and teaching tool for students and engineers new to the wireless field. Some day such site specific modeling techniques may be downloadable into wireless phones and used to determine instantaneous air interface parameters.
4.1 | If Pt = 10 W, Gt = 0 dB, Gr = 0 dB, and fc = 900 MHz, find Pr in Watts at a free space distance of 1 km. | |||||||||||||||
4.2 | Assume a receiver is located 10 km from a 50 W transmitter. The carrier frequency is 6 GHz and free space propagation is assumed, Gt = 1 and Gr = 1.
| |||||||||||||||
4.3 | Fraunhofer distance: Calculate the gain, half power beamwidth (HPBW), and Fraunhofer distance for a uniformly illuminated horn antenna at 60 GHz with dimensions of 4.6 cm × 3.5 cm. Hint: HPBW for the horn antenna can be estimated as HPBW = 51λ/a, where a is the aperture width, as discussed in [Stu81]. | |||||||||||||||
4.4 | Free space propagation: Assume the transmitter power is 1 W at 60 GHz fed into the transmitter antenna. Using the horn antenna from Problem 4.3 at both the transmitter and receiver:
| |||||||||||||||
4.5 | Reflection coefficients: Find the reflection coefficients for typical ground, brick, limestone, glass, and water from data given in Table 4.1 at an incident angle of 30°. Assume lossless dielectrics. Present your final answers in a table. | |||||||||||||||
4.6 | Surface roughness: Explain the dependence of surface roughness on the frequency and angle of incidence. | |||||||||||||||
4.7 | Show that the Brewster angle (case where Γ‖ = 0) is given by θi where | |||||||||||||||
4.8 |
| |||||||||||||||
4.9 | Prove that in the two-ray ground reflected model, Δ = d″ − d′ ≈ 2hthr/d. Show when this holds as a good approximation. Hint: Use the geometry of Figure P4.9. | |||||||||||||||
4.10 | In a two-ray ground reflected model, assume that θΔ must be kept below 6.261 radians for phase cancellation reasons. Assuming a receiver height of 2 m, and given a requirement that θi be less than 5°, what are the minimum allowable values for the T–R separation distance and the height of the transmitter antenna? The carrier frequency is 900 MHz. Refer to Figure P4.9. | |||||||||||||||
4.11 | In the two-ray path loss model with Γ┴ = −1, derive an appropriate expression for the location of the signal nulls at the receiver. | |||||||||||||||
4.12 | Compare the received power for the exact (Equation (4.47)) and approximate (Equation (4.52)) expressions for the two-ray ground reflection model. Assume the height of the transmitter is 40 m and the height of the receiver is 3 m. The frequency is 1800 MHz, and unity gain antennas are used. Plot the received power for both models continuously over the range of 1 km to 20 km, assuming the ground reflection coefficient of −1 for horizontal polarization. | |||||||||||||||
4.13 | Redo Problem 4.12 for the case where the ground reflection coefficient is 1 (e.g., vertical polarization). | |||||||||||||||
4.14 | Assuming a receiver is located 10 km from a 50 W transmitter. The carrier frequency is 1900 MHz, free space propagation is assumed, Gt = 1, Gr = 2, find: (a) the power at the receiver; (b) the magnitude of the E-field at the receiver antenna; (c) the open-circuit rms voltage applied to the receiver input assuming that the receiver antenna has a purely real impedance of 50 Ω and is matched to the receiver; (d) find the received power at the mobile using the two-ray ground reflection model assuming the height of the transmitting antenna is 50 m, receiving antenna is 1.5 m above the ground, and the ground reflection is −1. | |||||||||||||||
4.15 | Referring to Figure P4.9, compute d = df, the first Fresnel zone distance between transmitter and receiver for a two-ray ground reflected propagation path, in terms of ht, hr, and λ. This is the distance at which path loss begins to transition from d2 to d4 behavior. Assume Γ = −1. | |||||||||||||||
4.16 | For the knife-edge geometry in Figure P4.16, show that
| |||||||||||||||
4.17 | A general design rule for microwave links is 55% clearance of the first Fresnel zone. For a 1 km link at 2.5 GHz, what is the maximum first Fresnel zone radius? What clearance is required for this system? | |||||||||||||||
4.18 | Diffraction: From the knife-edge diffraction model, show how the diffracted power depends on frequency. Assume d1 = d2 = 500 m and h = 10 m in Figure P4.16. Hint: You may need to calculate Fresnel’s integral or use Lee’s approximation, Equations (4.59) and (4.61), respectively. | |||||||||||||||
4.19 | If Pt = 10 W, Gt = 10 dB, Gr = 3 dB and L = 1 dB at 900 MHz, compute the received power for the knife-edge geometry shown in Figure P4.19. Compare this value with the theoretical free space received power if an obstruction did not exist. What is the path loss due to diffraction for this case? | |||||||||||||||
4.20 | If the geometry and all other system parameters remain exactly the same in Problem 4.19, but the frequency is changed, redo Problem 4.19 for the case of (a) f = 50 MHz and (b) f = 1900 MHz. | |||||||||||||||
4.21 | Path loss model: During the first month of work, you get an assignment to perform a measurement campaign to estimate the channel path loss exponent for a new wireless product. You performed field measurements and collected the following data:
Using the path loss exponent model from Equation (4.69), find an expression for the optimum value of the path loss exponent n, which minimizes the mean square error between measurements and the model. Hint: The optimum value of n should minimize the mean square error (MSE) between your predicted path loss and measured path loss. | |||||||||||||||
4.22 | Assume that local average signal strength field measurements were made inside a building, and post processing revealed that the measured data fit a distant-dependent mean power law model having a log-normal distribution about the mean. Assume the mean power law was found to be pr(d)∝d−3.5. If a signal of 1 mW was received at d0 = 1 m from the transmitter, and at a distance of 10 m, 10% of the measurements were stronger than −25 dBm, define the standard deviation, σ, for the path loss model at d = 10 m. | |||||||||||||||
4.23 | If the received power at a reference distance d0 = 1 km is equal to 1 microwatt, find the received powers at distances of 2 km, 5 km, 10 km, and 20 km from the same transmitter for the following path loss models: (a) Free space; (b) n = 3; (c) n = 4; (d) two-ray ground reflection using the exact expression; and (e) extended Hata model for a large city environment. Assume f = 1800 MHz, ht = 40 m, hr = 3 m, Gt = Gr = 0 dB. Plot each of these models on the same graph over the range of 1 km to 20 km. Comment on the differences between these five models. | |||||||||||||||
4.24 | Assume the received power at a reference distance d0 = 1 km is equal to 1 microwatt, and f = 1800 MHz, ht = 40 m, hr = 3 m, Gt = Gr = 0 dB. Compute, compare, and plot the exact two-ray ground reflection model of (4.47) with the approximate expression given in Equation (4.52). At what T–R separations do the models agree and disagree? What are the ramifications of using the approximate expression instead of the exact expression in cellular system design? | |||||||||||||||
4.25 | Suppose that a mobile station is moving along a straight line between base stations BS1 and BS2, as shown in Figure P4.25. The distance between the base stations is D = 1600 m. The received power (in dBm) at base station i, from the mobile station, is modeled as (reverse link)
where di is the distance between the mobile and base station i, in meters, P0 is the received power at distance d0 from the mobile antenna, and n is the path loss exponent. The term P0 − 10nlog10(di/d0) is usually called local area mean power. The terms χi are zero-mean Gaussian random variables with standard deviation σ, in dB, that model the variation of the received signals due to shadowing. Assume that the random components χi of the signals received at different base stations are independent of each other. n is the path loss exponent. The minimum usable signal for acceptable voice quality at the base station receiver is Pr,min, and the threshold level for handoff initiation is Pr,HO, both in dBm. Assume that the mobile is currently connected to BS1. A handoff occurs when the received signal at the base station BS1, from the mobile, drops below threshold Pr,HO, and the signal received at candidate base station BS2 is greater than the minimum acceptable level Pr,min. Using the parameters in Table P4.25, determine:
Table P4.25. Parameters for Problem 4.25
| |||||||||||||||
4.26 | Derive Equations (4.78) and (4.79) from first principles and reproduce some of the curves on Figure 4.18. | |||||||||||||||
4.27 | A transmitter provides 15 W to an antenna having 12 dB gain. The receiver antenna has a gain of 3 dB and the receiver bandwidth is 30 kHz. If the receiver system noise figure is 8 dB and the carrier frequency is 1800 MHz, find the maximum T–R separation that will ensure that a SNR of 20 dB is provided for 95% of the time. Assume n = 4, σ = 8 dB, and d0 = 1 km. | |||||||||||||||
4.28 | Assume a SNR of 25 dB is desired at the receiver. If a 900 MHz cellular transmitter has an EIRP of 100 W, and the AMPS receiver uses a 0 dB gain antenna and has a 10 dB noise figure, find the percentage of time that the desired SNR is achieved at a distance of 10 km from the transmitter. Assume n = 4, σ = 8 dB, and d0 = 1 km. | |||||||||||||||
4.29 | Four received power measurements were taken at distances of 100 m, 200 m, 1 km, and 2 km from a transmitter. The measured values at these distances are −0 dBm, −25 dBm, −35 dBm, and −38 dBm, respectively. It is assumed that the path loss for these measurements follows the model where d0 = 100 m.
| |||||||||||||||
4.30 | Read “Path Loss, Delay Spread, and Outage Models as Functions of Antenna Height for Microcellular System Design,” which appeared in the August 1994 issue of IEEE Transactions on Vehicular Technology, Vol. 43, No. 3. (This paper also appears on page 211 of Cellular Radio and Personal Communications: Advanced Selected Readings by the IEEE Press.)
| |||||||||||||||
4.31 | Design and create a computer program that produces an arbitrary number of samples of propagation path loss using a dn path loss model with log normal shadowing. Your program is a radio propagation simulator, and should use, as inputs, the T–R separation, frequency, the path loss exponent, the standard deviation of the log-normal shadowing, the close-in-reference distance, and the number of desired predicted samples. Your program should provide a check that insures that the input T–R separation is equal to or exceeds the specified input close-in-reference distance, and should provide a graphical output of the produced samples as a function of path loss and distance (this is called a scatter plot). Verify the accuracy of your computer program by running it for 50 samples at each of five different T–R separation distances (a total of 250 predicted path loss values), and determine the best fit path loss exponent and the standard deviation about the mean path loss exponent of the predicted data using the techniques described in Example 4.9. Draw the best fit mean path loss model on the scatter plot to illustrate the fit of the model to the predicted values. You will know your simulator is working if the best fit path loss model and the standard deviation for your simulated data is equal to the parameters you specified as inputs to your simulator. | |||||||||||||||
4.32 | Using the computer program developed in Problem 4.31, develop an interface that allows a user to specify inputs as described in Problem 4.31, as well as transmitter and receiver parameters such as transmit power, transmit antenna gain, receiver antenna gain, receiver bandwidth, and receiver noise figure. Using these additional input parameters, and using knowledge of the Q-function and noise calculations (see Appendices), you may now statistically determine coverage levels for any specific mobile radio system. You may wish to implement table look-ups for Q and erf functions so that your simulator provides answers to the following wireless system design problems:
Verify the functionality of your simulator by example. | |||||||||||||||
4.33 | A PCS licensee plans to build out a 30 MHz license in the new U.S. PCS band of 1850 MHz to 1880 MHz (reverse link) and 1930 MHz to 1960 MHz (forward link). They intend to use DCS 1900 radio equipment. DCS 1900 provides a GSM-like service and supports eight users per 200 kHz radio channel using TDMA. Because of GSM’s digital techniques, GSM vendors have convinced the licensee that when the path loss exponent is equal to four, GSM can be deployed using four-cell reuse.
| |||||||||||||||
4.34 | Consider seven-cell frequency reuse. Cell B1 is the desired cell and B2 is a co-channel cell as shown in Figure P4.34(a). For a mobile located in cell B1, find the minimum cell radius R to give a forward link C/I ratio of at least 18 dB at least 99% of the time. Assume the following:
| |||||||||||||||
4.35 | Given an indoor path loss model of the form: where d is measured in meters, find the mean received power between three floors of a building if FAF is 15 dB per floor. Assume the transmitter radiates 20 dBm and unity gain antennas are used at both the transmitter and receiver, and that the straight-line path between the transmitter and receiver is 15 m through the floors. |