
When Xcode reaches a breakpoint, its debugging mode will become active. The debug navigator will appear in the sidebar on the left, and if you've printed any information onto the console, the debug area will automatically appear below the editor area:
The buttons in the top bar of the debug area are as follows (from left to right):
- Hide/Show debug area: Toggles the visibility of the debug area
- Activate/Deactivate breakpoints: This icon activates or deactivates all breakpoints
- Step Over: This executes the current line or function and pauses at the next line
- Step Into: This executes the current line and jumps to any functions that are called
- Step Out: This exits the current function and places you at the line of code that called the current function
- Debug view hierarchy: This shows you a stacked representation of the view hierarchy
- Location: Since the simulator doesn't have GPS, you can set its location here (Apple HQ, London, and City Bike Ride are some of them)
- Stack Frame selector: This lets you choose a frame in which the current breakpoint is running
The main window of the debug area can be split into two panes: the variables view and the LLDB console.
The variables view shows all the variables and constants that are in the memory and within the current scope of your code. If the instance is a value type, it will show the value, and if it's an object type, you'll see a memory address, as shown in the following screenshot:
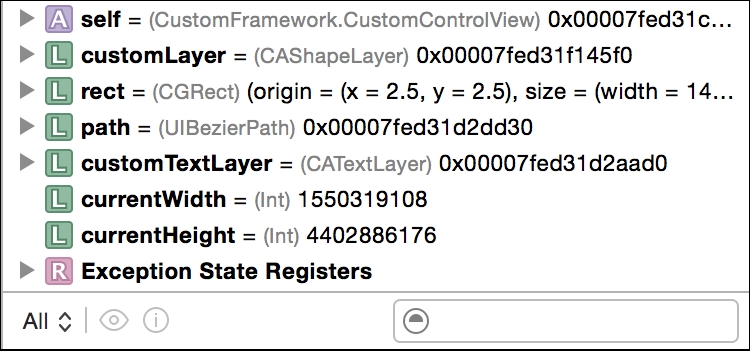
This view shows all the variables and constants that are in the memory and within the current scope of your code. If the instance is a value type, it will show the value, and if it's an object type, you'll see a memory address.
For collection types (arrays and dictionaries), you have the ability to drill down to the contents of the collection by toggling the arrow indicator on the left-hand side of each instance.
In the bottom toolbar, there are three sections:
- Scope selector: This let's you toggle between showing the current scope, showing the global scope, or setting it to auto to select for you
- Information icons: The Quick Look icon will show quick look information in a popup, while the print information button will print the instance's description on the console
- Filter area: You can filter the list of values using this standard filter input box
The console area is the area where the system will place all system-generated messages as well as any messages that are printed using the print or NSLog statements. These messages will be displayed only while the application is running.

While you are in debug mode, the console area becomes an interactive console in the LLDB debugger. This interactive mode lets you print the values of instances in memory, run debugger commands, inspect code, evaluate code, step through, and even skip code.
As Xcode has matured over the years, more and more of the advanced information available for you in the console has become accessible in the GUI. Two important and useful commands for use within the console are p and po:
po: Prints the description of the objectp: Prints the value of an object
Depending on the type of variable or constant, p and po may give different information.
As an example, let's take a UITableViewCell that was created in our showcase app in Chapter 5, Table, Collection, and Stack Views, and place a breakpoint in the tableView:cellForRowAtIndexPath method in the ExamleTableView class:
(lldb) p cell
(UITableViewCell) $R0 = 0x7a8f0000 {
UIView = {
UIResponder = {
NSObject = {
isa = 0x7a8f0000
}
_hasAlternateNextResponder = '�'
_hasInputAssistantItem = '�'
}
... removed 100 lines
(lldb) po cell
<UITableViewCell: 0x7a8f0000; frame = (0 0; 320 44); text = 'Helium'; clipsToBounds = YES; autoresize = W; layer = <CALayer: 0x7a6a02c0>>The p has printed out a lot of detail about the object while po has displayed a curated list of information. It's good to know and use each of these commands; each one displays different information.