
The tools that have been discussed so far in this chapter are great for debugging the models and controllers that power our applications. But what about our views? This is where the Spark Inspector comes in.

The debug view hierarchy button
While your app is running, you can click the Debug View Hierarchy button in the debug area toolbar to open this inspector. A three-dimensional, extruded view is shown on screen, which you can click and drag to rotate, as shown here:
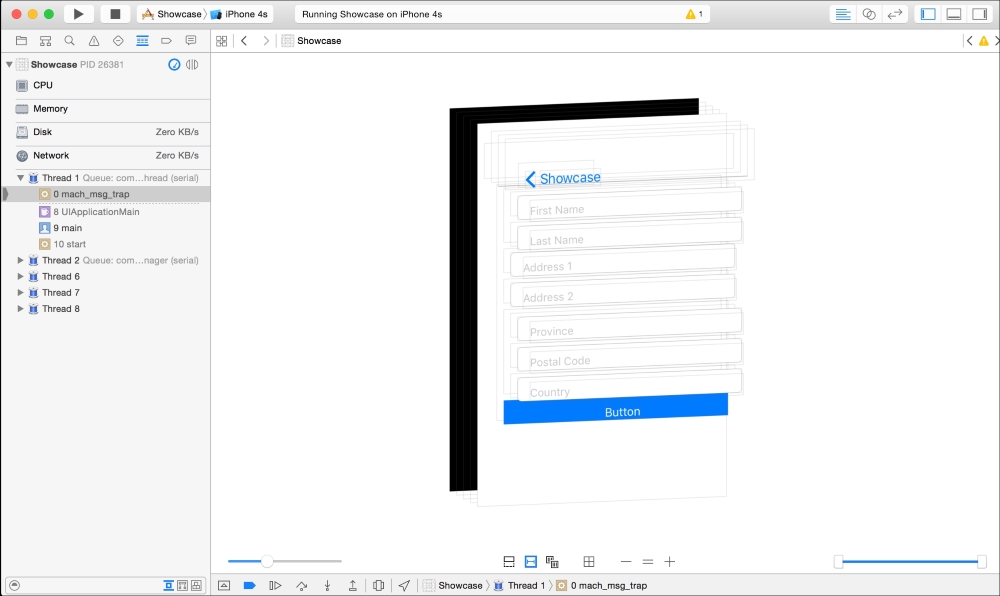
When you click on a view within the Spark Inspector window, you will find more information available for you in the navigator and Utility sidebars:
- The debug navigator on the left will show you a list representation of the view hierarchy. It includes two buttons in the bottom filter bar that will let you show only primary views or views that are hidden.
- The inspector sidebar includes the object and size inspector tabs, and will show you details about the selected view. This information includes the Auto Layout constraints affecting the object as well as size information.

To show the power of view debugging, let's walk through a simple debugging session.
This is a modified version of the collection view screen from the Showcase app in Chapter 5, Table, Collection, and Stack Views. When I open the collection view, the labels showing the names of noble gasses are missing. Clicking on the Debug View Hierarchy button shows that the UILabels are, in fact, not being rendered on the screen, as follows:

The app with the missing view as shown in the iPhone 5 simulator as well as the Spark Inspector
In this case, we know for a fact that the label exists. Our code is successfully interacting with the UILabel objects in our view controller. We know this because the code executes without any errors.
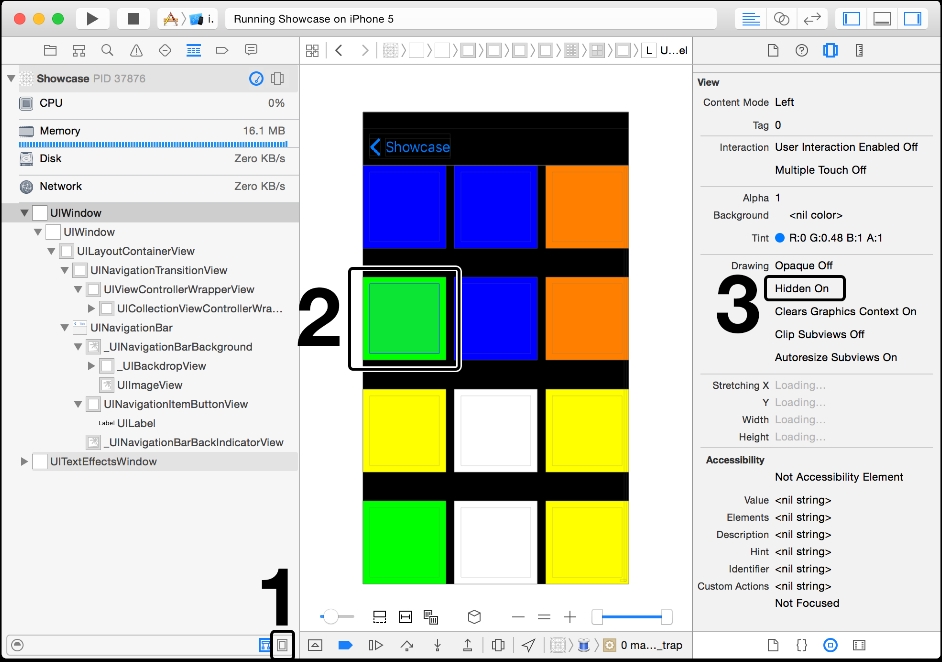
The best guess is that our label has had its hidden property turned on. We can check for this by toggling the Show only displayed views button (1) within the filters area of the debug navigator sidebar. Once this filter is deactivated, you'll see a new view appear inside of each cell (2).
Clicking on it will show that this is our missing label. Opening up the object inspector shows that the Hidden property is, in fact, set to On for the view (3).
We can now fix this issue by opening up our Main.Storyboard file, finding the label inside of our collection view cell, and then making sure that the Hidden checkbox is unchecked.
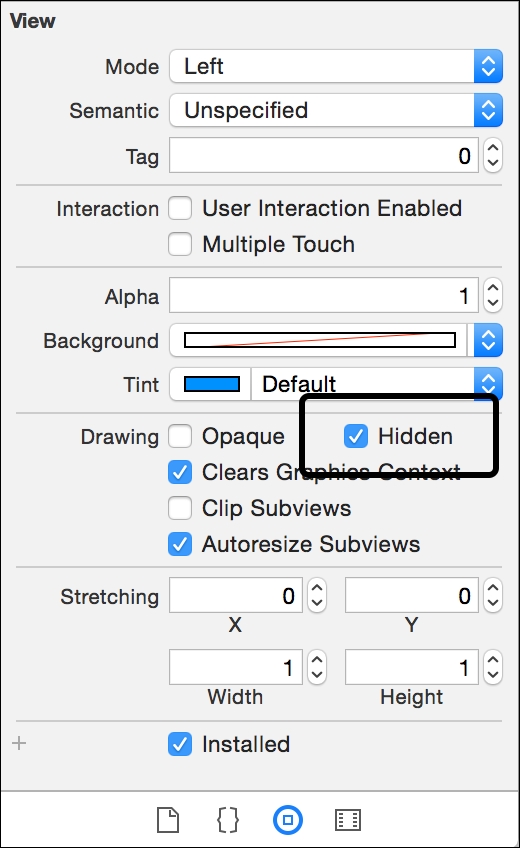
The hidden property of the UILabel object