
We've already seen the most granular way of running tests—by clicking on the run test diamond icon next to each test in the standard editor—but there are other ways.
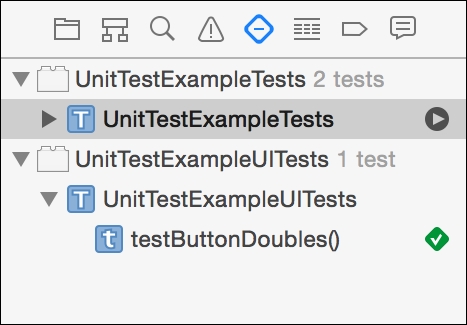
When you hover your cursor over your test target, classes and methods in the text navigator (Cmd + 5) will let you run all the tests contained in each by clicking on the circular play button that appears. You can use this to run a certain subset of your tests.
To run all the tests at once, navigate to Product | Test or use the Cmd + U keyboard shortcut.
You can see a history of the tests that have been run by opening the report navigator sidebar (Cmd + 8). By selecting one of the items in the listing, you can see any details about the event in question.
Xcode 7 offers the new ability to intelligently know how much of your code base is being tested. This is called code coverage, and it needs to be turned on in your current scheme in order to start collecting data.
Edit the current scheme by navigating to Product | Scheme | Edit Scheme (or using Cmd + <). Select the Test scheme from the left-hand-side listing and check the Gather coverage data option.
Close the modal window and run all of your tests. Once it's completed, select the most recently run test in the report navigator and then select the Coverage button, as shown here:

You'll see a graphical representation of how much of each file is being covered by tests. On hovering over and then clicking on the arrow button on any of the files, you'll be shown an annotated view of your code that shows how often each portion of the code has been run in a test. Code that hasn't been tested will be marked in red and annotated with a 0 on the right-hand side of the editor.
Getting 100 percent code coverage is nearly impossible in real-world code. This information is simply helpful while making decisions on where to spend your time.