
I open every radio show by telling my listeners there are a lot of ways to invest. Countless people have invented countless manners, methods, and philosophies about how to make money in the market.
There’s growth investing, value investing, GARP investing (Growth At a Reasonable Price), global macro, sector rotation strategies, merger arbitrage, and long/short credit. You can invest in specialty areas like oil, soft commodities, and gold-oriented investments. There are bottom up investors, top down investors, and everything in between.
So then, with so many possibilities beckoning you and your money, why do I believe so strongly in income investing? It’s a great question.
Do I believe income investing is the only way to get the most out of your money? This kind of dramatic question usually provides the perfect cliffhanger for me to go to a commercial break. But since we’re not on the radio, I’ll cut to the chase and give you the answer.
No, I don’t believe that.
Income investing is not the only way. It’s not the be-all and end-all of handling your financial situation. There is no magic formula for everything (or for anything, frankly).
And yet despite the fact that there are no magic formulas, I still point the people I work with firmly in this direction. Income investing is the method I’ve used and developed over the course of many years, and the one I find brings a lot of comfort and certainty to an otherwise uncertain practice.
Not every football team uses the same offense to win games. Not every coach draws the same Xs and Os on his chalkboard. But when you find that coach who knows how to craft and teach his knowledge in a way that maximizes the talent around him, that’s when teams start winning championships.
In this chapter, I’m going to give you the rundown on income investing so you can decide if it’s right for you. Consider income investing your game plan and me your coach. Let’s put our team on the field and go win us some games.
What Is Income Investing?
It’s really pretty simple. Income investing is a way to generate consistent cash flow from your liquid investments. It comes from three places:
1. Dividends from stocks
2. Interest from various types of bonds
3. Distributions that come from a variety of investments—investments that pay distributions but don’t fit neatly in the stock or bond category
So cash flow is generated from dividends, interest, and distributions. Add those three together and you have your personal portfolio yield.
Yield is a function of how much cash flow you’re getting in relation to the assets you have invested. So, what is your annual cash flow?1 Let’s say you start the year out with a yield of 3.5 or 4 percent and know with a great degree of certainty—though nothing is guaranteed—that you’re going to generate that 4 percent in cash flow from your investments.
That 4 percent, whether it’s on $240,000, $480,000, $720,000, or any other amount, is the predictable part of the portfolio. That’s the slice of the pie you can rely on. Isn’t it nice to have something predictable in an otherwise uncertain world?
Remember: income investing focuses on the production of steady cash flow from dividends, interest, and distributions which can either be reinvested in your portfolio or used to fund your spending needs. This differs from pure growth investing that relies on a rising stock market alone. For a refresher on the difference between income investing and growth investing revisit Chapter 7.
How Do You Become an Income Investor?
When most people think of their investment account—most commonly a 401(k) plan—they imagine their assets inside a pie chart. They see green, blue, yellow, red, big, small, large, international, domestic, emerging markets, specialty areas, commodities, and gold all crammed into one pie chart that is supposed to make investing, from a visual perspective, easy to understand.
I’ve been in the investment industry for a long time, and for the most part, I have no problem with pie charts. However, the time I’ve spent hosting Money Matters has helped me understand the following: nobody has time for complex graphs and ideas. Generally speaking, the simpler the explanation of an investment philosophy, the more buy-in it will get. Because I believe so strongly in income investing, I am continually refining and simplifying the way I describe it to people.
I’ve had to come up with a way for both clients and radio listeners to understand my investment process and philosophy, just by talking to them over the air, on the phone, and when I sit down in meetings.
So instead of using that pie chart, I’ve developed the Wes Moss Bucket System. When conducting a meeting with a new investor who isn’t familiar with the terminology “income investing,” I take him or her through a series of bucket diagrams to explain the process. Now I’m going to do the same for you.
Introducing the Wes Moss Bucket System
The buckets in my system don’t include physical real estate such as land or homes, and they don’t include private business ownership. They only refer to money you could invest in a traditional investment portfolio. It’s all very liquid, which is why I chose buckets. Clever, right? I thought so.
The bucket drawings I’ll share in this chapter are simply an attempt to give you a visualization of the mechanics or blueprints of what’s actually happening inside your portfolio—Roth IRA, 401(k), 403(b)—or any sort of account where you are investing money.
Look at Illustration 8.1 and you’ll see the four buckets. The title of each bucket is its focus.
Illustration 8.1 Beginning Buckets, Overview

These are the only four places your liquid money can go.
1. Cash bucket
2. Income bucket
3. Growth bucket
4. Alternative income bucket
I’ve drawn a dotted line between cash and income. To the left of this dotted line is where your safe money goes. To the right of this line is where your investable dollars go.
The left side of this line, that’s safe money. That’s cash, or what I also refer to as your emergency cash. Having this cash on hand helps you sleep at night, knowing you can quickly cover an emergency expense if it comes up. What’s in the cash bucket? CDs and money markets.
You’ll notice the bucket looks to be filled with water. This is meant to reflect the amount of liquid money you have to provide for you and your family for six months of financial hardship. That amount will differ for each person. It might be $30,000, $60,000, $100,000, or some other number. Whatever six months of money means for you is the amount of money in that bucket of CDs and money markets.
The right side of the dotted line reflects that you’re investing those “investable dollars” so you can outpace inflation, maintain purchasing power of your money, and allow your money to work for you over time. That’s why these are investments and not savings. In fact, that’s the difference between investments and savings.
Primarily what you’ll find inside the income bucket are various sorts of bonds, which is why it can also be referred to as the bond bucket. Within this space are government bonds that have yields from 0 to 3 or 4 percent, corporate bonds that pay 2 to 4.5 percent, and high-yield bonds that pay 4.5 to 7.5 or 8 percent. That’s the yield I talked about earlier in the chapter. The yield represents the level of interest being paid on a bond. Bonds pay interest.
The growth bucket is going to be full of various kinds of stocks. It is essentially your stock bucket—small cap, mid cap, and large cap stocks. For the purposes of this book, we’ll focus on two types of stocks in general: dividend stocks and growth stocks.
The alternative income bucket is where you find hybrid investments—not traditional bonds or stocks, but all the areas that lie in between.
Still with me? Good.
Take a look at Illustration 8.2. In the income bucket, you’ll find a number of different types of bonds.
Illustration 8.2 The Income Bucket
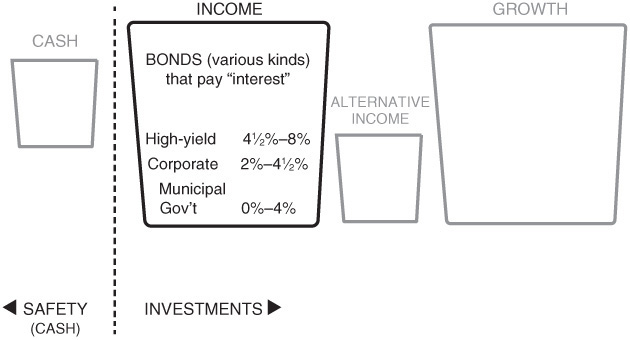
Here’s a closer look at the income bucket.
• Government and municipal bonds
• Corporate bonds
• High-yield bonds
Government bonds equate to government Treasuries, short-term Treasury bills, and intermediate and long-term government bonds. Also included here are Treasury inflation-protected securities—TIPS. Municipal bonds are issued by state and local governments and typically offer income that is exempt from federal taxes (and state taxes if you live in the state where they are issued). Like all of these major bond categories, municipal bonds are issued with various maturities (how many years they pay interest) and various credit ratings that measure the issuers’ creditworthiness.
Corporate bonds become available from large corporations such as Apple or Ford Motor Company when they need to fund large projects. These are companies that will likely be around for many years to come, which makes them dependable.
Then you get to the next category, high-yield bonds, which is a fancy and nice word for junk bonds. Junk bonds pay higher interest—4.5 to 8 percent per year—because they’re not as stable. They’re like people with bad credit—they have to pay a higher interest rate to borrow money.
Bonds are basically IOUs because you are essentially loaning money to the government or company, whereas with stocks you actually own a portion of the company. Hence the phrase: “loan vs. own.”
As I said, with bonds you’re a lender to a company or a government because they need your money to do a specific project. You lend them money for a specific amount of time—3 years, 10 years, etc.—and then they give you a coupon or set interest payment every year over the life of that bond.
When the term is up, they pay you your principal back on the date of maturity. Thus, you have effectively loaned money to a company for a piece of paper that says, “Hey, you give us $10,000, we’ll give you 5 percent on that $10,000 annually, and after five years we’ll give you your full $10,000 back.”
Now let’s look at Illustration 8.3: the growth bucket. You’re going to fill this bucket with dividend-paying stocks that pay around 2 to 5 percent. I typically draw it out for clients and write the word “SHUT,” referring to the SHUT Index. SHUT refers to four of the 10 S&P 500 industry sectors:
Illustration 8.3 The Growth Bucket

Here’s a closer look at the growth bucket.
• Staples
• Healthcare
• Utilities
• Telecommunications
Staple companies are those like Coca-Cola, Clorox, and Procter & Gamble. Examples of healthcare companies are Bristol-Myers Squibb, Eli Lilly, and Pfizer. For utility companies, think Southern Company, Consolidated Edison, and Duke Energy. For telecom, look at names like AT&T and Verizon, among others.
These are companies that pay dividends of about 2 percent up to about 5 percent—and sometimes even more than that. Here we are dealing with noncyclical industries. And by and large, the SHUT index is composed of dividend-paying stocks.
For the other six industries, I use the MEDFIT acronym—materials, energy, discretionary, financials, industrial companies, and technology. By and large, these sectors tend to lean toward growth companies (not to say they are totally devoid of some fantastic dividend-payers).
Now look at Illustration 8.4. This is a good time to explain a bit more about what goes into the alternative income bucket. Anything that doesn’t fit neatly into the other categories goes here. For instance, pipeline and energy storage companies would go here. MLPs (master limited partnerships) make up a large portion of these companies. Due to their legal structure, MLPs pay nearly all of their net profits back out to shareholders in the form of distributions.
Illustration 8.4 The Alternative Income Bucket

Here’s a closer look at the alternative income bucket.
That’s why we see yields in the 4 to 7 percent range. An example would be the largest pipeline company in America—Enterprise Products Partners, LP. EPD has many thousands of miles of pipeline that run from the Gulf of Mexico to Wisconsin to New York, and from North Carolina to Wyoming.
Another type that fits in the alternative bucket are ERTs—energy royalty trusts. These are crude oil and natural gas trusts that are technically land trusts with oil wells and gas wells sitting on top of them. Similar to MLPs, ERTs have a legal structure that requires a nearly 100 percent pass-through royalty payout to investors. That royalty is based on the value and the price of the commodity (i.e., is oil at $80? $90? $100 per barrel?) and the amount of production they are able to pull out of the ground during any given quarter. They pass a percentage of that royalty on to you. ERTs will typically have yields between 5 and 10 percent per year.
If you’re enjoying all the acronyms in the alternative income bucket, you’re in luck! I have another one for you—REIT. It stands for real estate investment trust. These are typically commercial, publicly traded companies. They include big apartment companies like Post Properties here in Atlanta and Simon Property Group out of Indianapolis.
A great example of an REIT scenario would be an individual store such as Cartier Jewelers, J.Crew, or Cinnabon leasing space from Simon. They pay on that lease to Simon, who makes a profit and then distributes that profit to you as a unit holder. The legal structure of REITs requires roughly 90 percent of the net profits to go back out to shareholders. You’ll see REITs paying anywhere from a 3 to 5 percent dividend and above.
Needless to say, this alternative bucket is quite interesting. It’s like the teenage offspring of the other buckets. Sure, it got its nose pierced in high school, but that’s okay because it still made the honor roll a few semesters. This is the bucket where you will typically find the highest percentage annual yielders.
Okay, so we’ve now covered the main examples of the core investments that go in each bucket—cash, income, growth, and alternative income. Now let’s look at all the buckets and their approximate yields (Illustration 8.5).
Illustration 8.5 All Buckets with Approximate Yield

Here you’ll see each bucket with its approximate overall yield beneath it.
Depending on what type of bonds you own, the income bucket should pay anywhere from a 0 to 8 percent yield. The 0 percent would most likely be on ultra short-term government bonds, and the 8 percent would be the highest-risk junk bonds.
High-yield bonds (junk bonds) pay a high yield because they are on the high end of the risk ladder. You know that top rung of the ladder you’re not supposed to stand on? Some junk bonds are basically that top step. A few steps down from there near the middle of the ladder are corporate bonds. You’ll see low-risk, low-yield bonds at the bottom of the yield ladder with government bonds.
If you were to structure the income part of your portfolio with various kinds of bonds, referred to in fancy Wall Street lingo as fixed income, you’re going to have a yield somewhere between 0 and 8 percent. So, a fully diversified bond portfolio should have a yield of somewhere between 3 and 5 percent at today’s prevailing rates.
Look at Illustration 8.5 again. The income bucket should pay you around 3 to 5 percent, the growth bucket should pay you between 2 and 4 percent, the alternative income bucket should pay you between 5 and 7 percent, and your cash right now should pay you 0 to 1 percent.
Now it’s all about connecting pipelines. All of the buckets, to some extent, are interconnected. The pipelines are there to transport the income that will be generated from the investments in each bucket. At some point these pipelines are going to serve a purpose, because the money or income that is generated is going to come back to you (Illustration 8.6).
Illustration 8.6 The Cash Flow Generating Bucket System at work

Now your investment buckets are all producing income (cash flow) that consistently adds to your cash bucket, which is portfolio income you can spend.
Look at that money flow!
Why are money markets paying such a low rate of interest? Wasn’t there a time when you could get 4 to 5 percent in CDs? Absolutely! These short-term rates are effectively set and controlled by the Federal Reserve, which is now headed up by Janet Yellen. When Janet and her team set the federal funds rate between 0 and 0.25 percent, that means banks can’t really pay you much more than that without losing money.
To review: we keep our safe money to the left in the emergency or cash bucket, we keep our investments to the right in the growth, income, and alternative income buckets. Each of the three buckets on the right pays a consistent level of income—3 to 5 percent, 5 to 7 percent, and 2 to 4 percent.
It’s worth mentioning that bonds are different animals than stocks, which are different animals than the alternative hybrid group. So by nature, instead of a typical pie chart dividing up your money, I’m literally showing you how it’s divided up into four separate areas that all have their own set of characteristics and all serve their own purpose.
They all do something slightly different. But they all are there to increase your wealth and preserve and grow your capital in some way, shape, or form over time.
The Balance of the Buckets
I am an enormous believer in what I call the balance of the buckets. Sounds epic, right? We’ll talk about the different percentages of what to put in the buckets in the next chapter, but to me there’s a lot of power in getting this step right to begin with.
The number one most important thing you can do as an investor is understand this bucket system before you invest another penny. I want you to understand how your investments fall into these very separate and critically important areas of the world.
So I’ve put your money into four areas, and each one gives you a yield. Let’s target a specific yield. Income’s going to give you 4 percent. Growth is going to give you 3 percent, and alternative income is going to give you 6 percent. That means you have an overall portfolio yield of around 4 percent . . . in today’s world.
As an example, let’s say you have 40 percent in income, 10 percent in alternative income, and 50 percent in growth. Thus, you have 40 percent in the bond bucket and 60 percent in the alternative and growth bucket. That would equate to a yield of about 4 percent overall, in 2014. That figure could be 4.5 percent or 5 percent in 2015 and 5 or 5.5 percent in 2016, but as of the time of writing, you can count on around 4 percent in yield in today’s environment.
That, in my opinion, should be on the low end of the historic continuum. In fact, the cash flow you get from income investing over the next several years may grow because interest rates will likely rise over the next several years. Hence, the income bucket/bond bucket might pay you a little more than it’s paying today. But using a conservative estimate, this is what your income could look like.
So back to my example: whether you have $240,000 or $2.5 million, you should be able to generate a steady cash flow of 4 percent from that number.
What If You Don’t Need the Income Right Now?
Let me talk for a minute about the accumulation phase. Let’s assume you are in your thirties, forties, or fifties. All your interest from that income bucket is generated from your bonds, and it just stays in the bucket. Visualize that income hitting the wall of your bucket and coming back in to buy more bonds. The money keeps being reinvested and reinvested over a long period of time.
You do the same thing with the growth bucket. You have a dividend paid to you from your stocks, it hits the wall of the growth bucket and is reinvested. And again, the reinvestment of those dividends and the interest and distributions—that’s all part of what makes your money grow over time.
It’s important to note the fact that all of the pipeline “gates” in this bucket diagram are shut. There’s no money flowing from one bucket to another right now. What do you do with all of that income? Reinvest. And reinvest. And reinvest. Now you are really accumulating! See Illustration 8.7.
Illustration 8.7 All Buckets with Approximate Yield, and “Gates Closed”

This diagram shows all the buckets with approximate yield and the pipeline “gates closed” with the reinvestment feature in full effect.
Look at Illustration 8.6 one final time. I want you to imagine all your buckets are fully functioning and you’re heading toward the end zone. You’re in retirement. Like Elvis, the accumulation phase has left the building.
You’re in the distribution phase now, which means you get to spend some of that money! All those years you spent in the office kitchen singing “Happy Birthday” to coworkers you hardly knew are about to pay off.
This step is generally for people between the ages of 60 and 100. The only thing that happens here is that now the pipelines are open. The growth bucket pipeline is open. The alternative income bucket pipeline is open. The income valves are open. All of a sudden, the cash flow that you’re generating is no longer being reinvested anywhere but rather ending up in your wallet.
It’s flowing back into the cash bucket—the one all the way to the left. It’s coming back to you to solve the biggest fear in the world: not having a paycheck. Well, guess what? You created your own paycheck. You’re an income producing monster. Congratulations!
All those dividends, all that interest, all those distributions: they now flow back into that nice, easy-looking cash bucket. All your buckets are producing money for you in excess of your emergency fund that you can use to live on. You have income, and you have cash flow each month, just like when you were working.
The Bucket System Isn’t the Only Way—But It’s a Great Place to Start
My bucket system takes the very complex world of investing and simplifies it by helping you visualize your investments as money dropped into one of four easy-to-understand “buckets.” Over the years, I’ve found this to be the most effective way of explaining income investing to the families I work with every day.
Remember: income investing is a philosophy, not the only philosophy. However, it’s a philosophy that I am very passionate about. It’s not an 80-yard pass down the field for a touchdown. Rather, it’s a solid game plan of 5- and 6-yard runs that gets you a first down most of the time.
It’s one of the few ways I know to easily understand what your money is doing for you and how to be realistic on a systematic basis. Income investing is not a magic bullet. It’s a system that works over time. The system itself may not be sexy, but the results you’ll achieve are runway model quality.
The next time someone promises you a “never lose” financial scheme, remember that even if there is such a thing as a free lunch, you’ll still get stuck paying for parking and eating rubber chicken. With my bucket system, you at least have control over a big part of the process—and that’s the income part. It’s not a free lunch, but at least you’ll know what’s on the menu.
The bucket system can be a true hedge against inflation, and I encourage you to try thinking about your current investments using the bucket system as your focus. Income investing is not just for “old people.” It’s for anyone looking for a predictable path to earning money over time. If you don’t need the income, reinvest it! If you do need the income, open the valves and start taking the money. Your hard work and disciplined planning will allow your portfolio to become the working stiff you used to be.
In the next two chapters, I’ll go into income investing in greater depth, sharing the toolkit of tips, tricks, and strategies that make me such a fan of this philosophy. When we’re done, you’ll be able to decide if income investing is right for you.