
11. The Marketing Metrics X-Ray
11.1 The Marketing Metrics X-Ray
Our purpose in this chapter is to give some examples of how marketing metrics can augment and complement traditional financial metrics when used to assess firm and brand performance. In particular, marketing metrics can serve as leading indicators of problems, opportunities, and future financial performance. Just as x-rays (now MRIs) are designed to provide deeper views of our bodies, marketing metrics can show problems (and opportunities) that would otherwise be missed.
Put Your Money Where Your Metrics Are
Table 11.1 shows common summary financial information for two hypothetical companies, Boom and Cruise. Income statement data from five years provide the basis for comparing the companies on several dimensions.
On Which Firm Would You Bet Your Grandparents Savings?
We have used this example with MBA students and executives many times—usually, we ask them “Assume that your grandparent wants to buy a partnership in one of these firms, using limited retirement savings. If these financial statements were the only data you had available or could obtain, which firm would you recommend?” These data are the metrics traditionally used to evaluate firm performance.
The table shows that gross margins and profits are the same for both firms. Although Boom’s sales and marketing spending are growing faster, its return on sales (ROS) and return on investment (ROI) are declining. If this decline continues, Boom will be in trouble. In addition, Boom’s marketing/sales ratio is increasing faster than Cruise’s. Is this a sign of inefficient marketing?
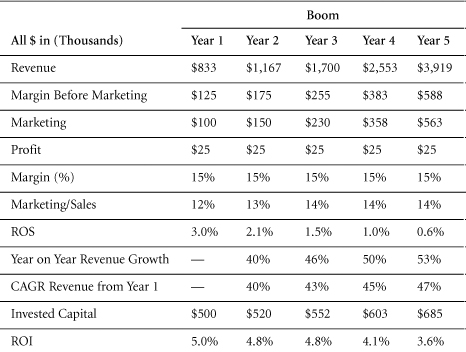
Table 11.1 Financial Statements
On the basis of the information in Table 11.1, most people chose Cruise. Cruise is doing more with less. It’s more efficient. Its trend in ROS looks much better, and Cruise has maintained a fairly consistent ROI of about 5%. About the only thing Boom has going for it is size and growth of the “top line” (sales revenue). Let’s look deeper at the marketing metrics x-ray.
Using The Marketing Metrics X-Ray
Table 11.2 presents the results of our marketing metrics x-ray of Boom and Cruise. It shows the number of customers each firm is serving and separates these into “old” (existing customers) and “new” customers.
This table allows us to see not only the rate at which the firm acquired new customers but also their retention (loyalty) rates. Now, Boom’s spending on marketing looks a lot better because we now know that spending was used to generate new customers and keep old ones. In addition, Boom acquires new customers at a lower cost than Cruise. And although Cruise’s customers spend more, Boom’s stay around longer. Perhaps we should order another set of x-rays to examine customer profitability and lifetime value?
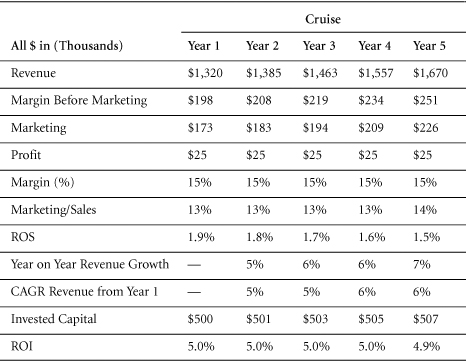
Table 11.3 uses the information in the previous table to calculate some additional customer metrics. Under an assumption of constant margins and retention rates and a 15% discount rate, we can calculate the customer lifetime value (CLV) for the customers of each firm and compare this CLV with what the firms are spending to acquire the customers. The CLV represents the discounted margins a firm will earn from its customers over their life buying from the firm. Refer to Section 5.3 for details about the estimation of CLV and the process for using the number to value the customer base as an asset. The asset value is merely the number of ending customers times their remaining lifetime value (CLV minus the just-received margin). For these examples, we have assumed that all marketing is used to acquire new customers, so the customer acquisition cost is obtained by dividing marketing spending by the new customers in year period.
Boom’s aggressive marketing spending looks even better in this light. The difference between the CLV and acquisition cost is only $3.71 for Cruise but is $48.21 for Boom. From the viewpoint of the customer asset value at the end of year five, Boom is worth almost five times as much as Cruise.
Table 11.4 gives us even more information on customers. Customer satisfaction is much higher for Boom, and Boom’s customers are more willing to recommend the firm to others. As a consequence, we might expect Boom’s acquisition costs to decline in the future. In fact, with such a stable and satisfied customer base, we could expect that brand equity (refer to Section 4.4) measures would be higher too.

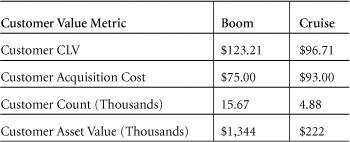
Table 11.3 Customer Profitability

Table 11.4 Customer Attitudes and Awareness
Hiding Problems in the Marketing Baggage?
The income statement for another example firm, Prestige Luggage, is depicted in Table 11.5. The company seems to be doing quite well. Unit and dollar sales are growing rapidly. Margins before marketing are stable and quite robust. Marketing spending and marketing to sales ratios are growing, but so is the bottom line. So what is not to like?
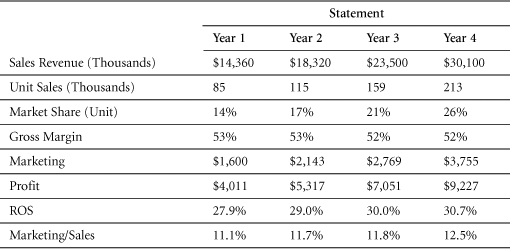
Table 11.5 Prestige Luggage Income
Using The Marketing Metrics X-Ray
Let’s take a deeper look at what’s going on with Prestige Luggage by examining their retail customers. When we do, we’ll get a better view of the marketing mechanics that underlie the seemingly pleasant financials in Table 11.5.
Table 11.6 (refer to Section 6.6 for distribution measures) shows that Prestige Luggage’s sales growth comes from two sources: an expanding number of outlets stocking the brand and an increase (more than four-fold) in price promotions. Still, there are plenty of outlets that do not stock the brand. So there may be room to grow.
Table 11.7 reveals that although the overall sales are increasing, they are not keeping pace with the number of stores stocking the brand. (Sales per retail store are already declining.) Also, the promotional pricing by the manufacturer seems to be encouraging individual stores’ inventories to grow. Soon, retailers may become irritated that the GMROII (gross margin return on inventory investment) has declined considerably. Future sales may continue to slow further and put pressure on retail margins. If retailer dissatisfaction causes some retailers to drop the brand from their assortment, manufacturer sales will decline precipitously.
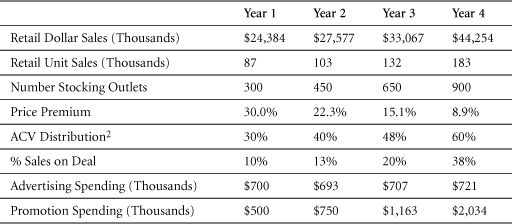
Table 11.6 Prestige Luggage Marketing and Channel Metrics
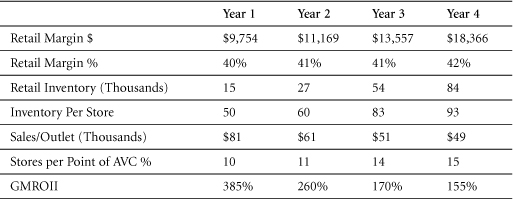
Table 11.7 Luggage Manufacturer Retail Profitability Metrics
In addition, the broadening of distribution and the increase of sales on deal suggest a possible change in how potential consumers view the previously exclusive image of the Prestige Luggage brand. The firm might want to order another set of x-rays to see if and how consumer attitudes about the brand have changed. Again, if these changes are by design, then maybe Prestige Luggage is okay. If not, then Prestige Luggage should be worried that its established strategy is falling apart. Add that to the possibility that some retailers are using deep discounts to unload inventory after they’ve dropped the brand, and suddenly Prestige Luggage faces a vicious cycle from which they may never recover.
Some things you can’t make up, and this example is one. The actual company was “pumped up” through a series of price promotions, distribution was expanded, and sales grew rapidly. Shortly after being bought by another company looking to add to their luxury goods portfolio of brands, the strategy unraveled. Many stores dropped the line, and it took years to rebuild the brand and sales.
These two examples illustrate the importance of digging behind the financial statements using tools such as the marketing x-ray. More numbers, in and of themselves, are only part of the answer. The ability to see patterns and meaning behind the numbers is even more important.
Smoking More But Enjoying It Less?
Table 11.8 displays marketing metrics reported by a major consumer-products company aimed at analyzing the trends in competition by lower-priced discount brands. A declining market size, stagnant company market share, and a growing share of firm sales accounted for by discount brands all made up a baleful picture of the future. The firm was replacing premium sales with discount brand sales. To top it off, the advertising and promotion budgets had almost doubled. In the words of Erv Shames, Darden Professor, it would be easy to conclude that the marketers had “run out of ideas” and were resorting to the bluntest of instruments: price.
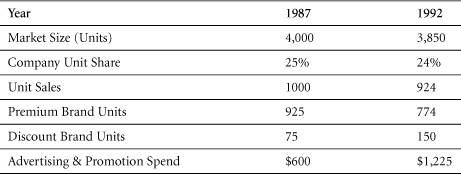
Table 11.8 Market Trends for Discount Brands and Spending; Big Tobacco Company
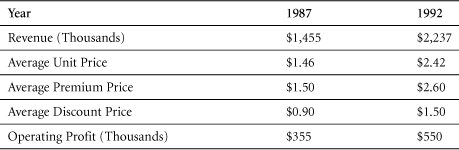
Table 11.9 Additional Metrics
The picture looks much brighter, however, after examining the metrics in Table 11.9. It turns out that in the same five years during which discount brands had become more prominent, sales revenue and operating income had both grown by over 50%. The reason is clear: Prices had almost doubled, even though a large portion of these price increases had been “discounted back” through promotions. Overall, the net impact was positive on the firm’s bottom line.
Now you might be thinking that the messages in Table 11.9 are so obvious that no one would ever find the metrics in Table 11.8 to be as troubling as we made them out to be. In fact, our experience in teaching a case that contains all these metrics is that experienced marketers from all over the world tend to focus on the metrics in Table 11.8 and pay little or no attention to the additional metrics—even when given the same level of prominence.
The situation described by the two tables is a close approximation to the actual market conditions just before the now-famous “Marlboro Friday.” Top management took action because they were concerned that the series of price increases that led to the attractive financials in 1992 would not be sustainable because the higher premium prices gave competitive discount brands more latitude to cut prices. On what later became known as “Marlboro Friday,” the second of April 1993, Phillip Morris cut Marlboro prices by $0.40 a pack, reducing operating earnings by almost 40%. The stock price tumbled by 25%.
Note in this example the contrast from the preceding example. Prestige Luggage was increasing promotion expenditures to expand distribution. Prices were falling while promotion, or sales on deal, were increasing—an ominous sign. With Marlboro, they were constantly raising the price and then discounting back—a very different strategy.
Marketing Dashboards
The presentation of metrics in the form of management “dashboards” has received a substantial amount of attention in the last several years. The basic notion seems to be that the manner of presenting complex data can influence management’s ability to recognize key patterns and trends. Would a dashboard, a graphical depiction of the same information, make it easier for managers to pick up the ominous trends?
The metaphor of an automobile dashboard is appropriate because there are numerous metrics that could be used to measure a car’s operation. The dashboard is to provide a reduced set of the vital measures in a form that is easy for the operator to interpret and use. Unfortunately, although all automobiles have the same key metrics, it is not as universal across all businesses. The set of appropriate and critical measures may differ across businesses.
Figure 11.1 presents a dashboard of five critical measures over time. It reveals strong sales growth while maintaining margins even though selling less expensive items. Disturbingly, however, the returns for the retailer (GMROII) have fallen precipitously while store inventories have grown. Sales per store have similarly dropped. The price premium that Prestige Luggage can command has fallen, and more of the company’s sales are on deal. This should be a foreboding picture for the company and should raise concerns about the ability to maintain distribution.
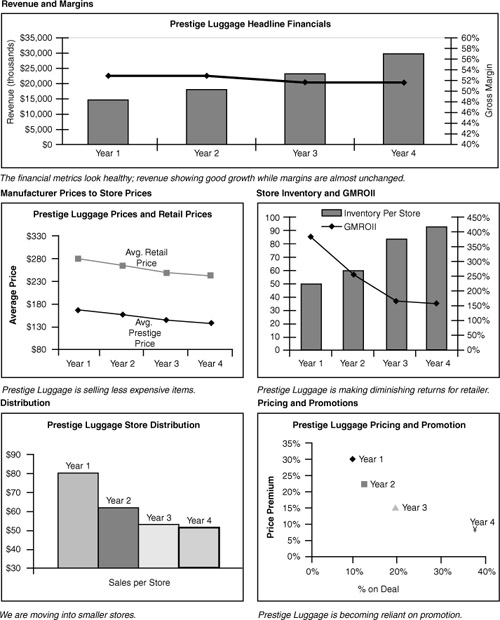
Figure 11.1 Prestige Luggage: Marketing Management Dashboard
Summary: Marketing Metrics + Financial Metrics = Deeper Insight
Dashboards, scorecards, and what we have termed “x-rays” are collections of marketing and financial metrics that management believes are important indicators of business health. Dashboards are designed to provide depth of marketing understanding concerning the business. There are many specific metrics that may be considered important, or even critical, in any given marketing context. We do not believe it is generally possible to provide unambiguous advice on which metrics are most important or which management decisions are contingent on the values and trends in certain metrics. These recommendations would have be of the “if, then” form, such as “If relative share is greater than 1.0 and market growth is higher than change in GDP, then invest more in advertising.” Although such advice might be valuable under many circumstances, our aims were more modest—simply to provide a resource for marketers to achieve a deeper understanding of the diversity of metrics that exist.
Our examples, Boom versus Cruise, Prestige Luggage, and Big Tobacco, showed how selected marketing metrics could give deeper insights into the financial future of companies. In situations such as these, it is important that a full array of marketing and financial metrics inform the decision. Examining a complete set of x-rays does not necessarily make the decisions any easier (the Big Tobacco example is debated by knowledgeable industry observers to this day!), but it does help ensure a more comprehensive diagnosis.
References and Suggested Further Reading
Ambler, Tim, Flora Kokkinaki, and Stefano Puntonni (2004). “Assessing Marketing Performance: Reason for Metric Selection,” Journal of Marketing Management, 20, pp. 475-498.
McGovern, Gail, David Court, John A. Quelch, and Blair Crawford (2004). “Bringing Customers into the Boardroom,” Harvard Business Review, November, pp. 1-10.
Meyer, C. (1994). “How the Right Measures Help Teams Excel,” Harvard Business Review. 72(3), 95.