
Sometimes we want to see different kinds of data from our servers at the same time. Problem is that this always doesn't make sense. Sometimes we want to see CPU load, memory, network traffic, even from different servers, but we don't want to see it in one graph all together. For this, we have screens in Zabbix. Screens in Zabbix are a quick way to display different kinds of information in something that looks like a table on your screen. In screens, we can display graphs, maps, other screens, and much more. Screens can be useful for service centers as we put all data for them in one or more screens so that there is an easy overview; for example, data from all webservers or load balancers in one screen.
For this recipe, we obviously need our Zabbix server and a Zabbix account with administrator rights. We also need an agent installed on our Zabbix server and the template Template App Zabbix Server linked to our host.
- From the menu, go to Configuration | Screens.
- Click on the Create screen button in the upper right corner. We will ignore the screen that is already there. Later you can edit the standard screen or remove it if you like.
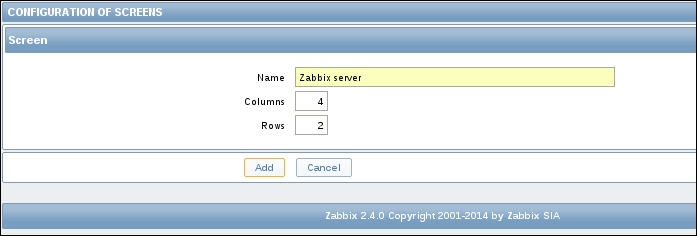
- First thing to do is add a Name for our Screen, example.
Zabbix server. - Next we add the number of Columns that we want to have in our screen.
- The last thing we have to change is the number of Rows in our screen that we want to have.
- Click Add to create our screen.
- You will see now under Configuration | Screens that we have created a screen with our name. Click on the Name of the screen you have created,
Zabbix server. - You will now see a table with exactly the same amount of columns and rows as you have entered before. In each field, you will also see the name Change. Click on Change in a field to change the content of this field.
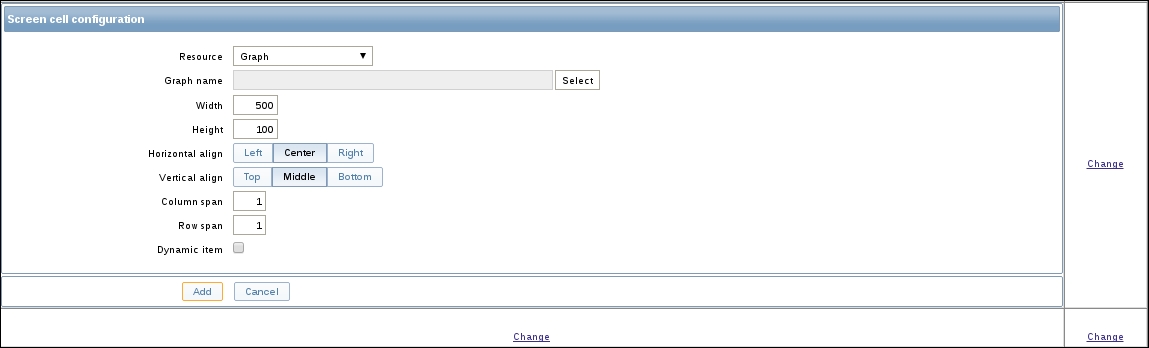
- Select the kind of Resource that you want to see visualized. For this recipe, we will select a
Graph. - Add a Graph name; we can select an item from the list that is available for our server by pressing the Select button, example.
Zabbix server performance. - Adjust the Width and Height for the graph if you like.
- Let Zabbix know if we have to align it horizontally or vertically to the
Left,Right,Top,Bottom,Middle, orCenter. - Next we have Column span and Row span. This works exactly like in HTML. We can tell how many columns or rows our item has to use.
- Next we have an interesting option, Dynamic item. If we select it, we will see when we go to our screen that our screen item is available for all hosts.
- Lets add some other items to our screen, for example, a clock or something else that you would like to see.
- Now lets have a look at it by going to the menu Monitoring | Screens.

- If you have selected Dynamic item, you will see in the top right corner a box as shown the picture below, where you can select another server or group for this item.

Screens are a just a collection of all kinds of information brought together in a table-like view. First thing we have to do when creating screens is think how many columns and rows we would like to have. This is not fixed, we can still change it later. When we want to add certain items to our fields, we can choose from the following list:
- Action log: A history of recent actions
- Clock: Digital or analog clock displaying current server or local time
- Data overview: Shows latest data for a group of hosts
- Graph: A single custom graph that you created before on a host or a template
- Graph prototype: A custom graph from low-level discovery rule (new since Zabbix 2.4
- History of events: Shows the latest events
- Host group issues: Status of triggers filtered by the hostgroup (includes triggers without events, since Zabbix 2.2)
- Host issues: Status of triggers filtered by the host (includes triggers without events, since Zabbix 2.2)
- Hosts info: High-level host related information
- Map: Displays a previously created single map
- Plain text: Plain text data measured from an item
- Screen: Screen (You can display a screen in another screen)
- Server info: Displays server information like number of monitored hosts and item.
- Simple graph: Single simple graph
- Simple graph prototype: Simple graph based on item generated by low-level discovery (available since Zabbix 2.4)
- System status: Displays system status (similar to the dashboard)
- Triggers info: High-level trigger related information
- Triggers overview: Displays a table with the status of all triggers of a host group- includes content from an external resource
Triggers will not be displayed in the legend if the height from a graph is set less then 120 pixels. In the screen, you have probably noticed + and - symbols on the sides of each table. When you click on the + symbol above the table, a new column will be added. Clicking on the – symbol will remove a column. Similarly, when we click on the left side of the table on the + symbol, a new row will be added. Clicking on the – symbol will remove a row.