
Having a proxy is nice, but how do you know that your proxy is still running fine? Are the buffers big enough? Do we need to optimize certain settings? And probably most importantly, how do you know when your proxy is not reporting any data? In this recipe, I will show you the answers to those questions.
What do we need ? As usual, we need our Zabbix server with super administration rights and of course, a Zabbix proxy properly configured as we have seen in the recipes setting up an active or a passive proxy.
- The first thing we have to do is set up an item on our Zabbix server. Go to Configuration | Hosts and create an item on your proxy.
- Use the following parameters to create your item:
- Type:
Zabbix internal - Key:
zabbix [proxy, <proxy name>, lastaccess] - Type of information:
Numeric (unsigned) - Data type:
Decimal - Units:
unixtime


- Type:
- When you now look at the latest data, you will see the last access time from your proxy on the Zabbix server.
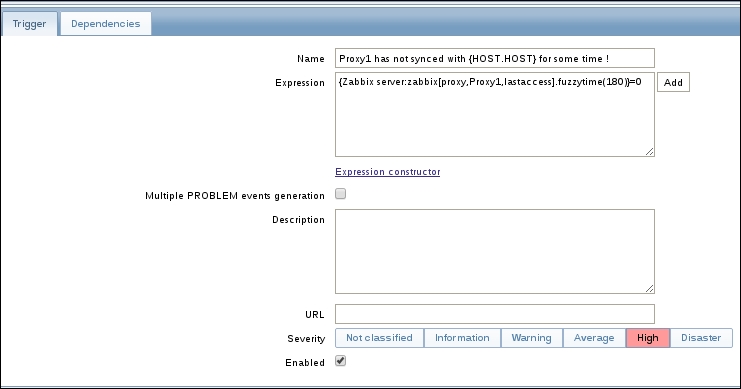
- The next thing we have to do is set up up a trigger for our item. Go to Configuration | Hosts and click on Triggers on the Zabbix server.
- Create a new trigger with an expression like this:
{Zabbix server:zabbix[proxy,Proxy1,lastaccess].fuzzytime(180)}=0 - Now after 180 seconds of no response, we will get a warning that there is an issue with our proxy.
In case of active proxy, it will be the proxy sending an heartbeat to the Zabbix server to report that he is still online. In case of passive proxy, it will be the Zabbix server checking for the proxy. Our trigger will look into both cases for the latest time the proxy was reached or had reported that it was still available and check how long it has been. In our case, the alarm will be sent after 180 seconds.
The proxy reports to the Zabbix server with some kind of heartbeat. Make sure you check the configuration from the proxy, so that it reports in regular times to the Zabbix server. For the active proxy, this is the option HeartbeatFrequency and for the passive proxy, you can look in the Zabbix server configuration for the option ProxyDataFrequency.
Tip
Zabbix has provided us with a special template for the proxy, Template App Zabbix Proxy. Linking this template will show you the inner health of the proxy. Here you will be able to see if buffers are too small or if we need more pollers and so on. Another option to monitor your proxy can be the installation of a full Zabbix client.