
Maps in Zabbix are a visual representation of your infrastructure. In maps, it is possible to see where the problems are in a visual way. Maps are a kind of interactive network diagrams where we connect individual elements with lines that can show us when a host is unreachable.
For this Zabbix recipe to work, we need a Zabbix server and a host with on server and host a Zabbix client installed. We also need to have the Zabbix server templates attached to the server and the Linux OS templates attached to both hosts. We obviously also need a Zabbix account with super administration rights.
- Go in the Zabbix menu to Configuration | Maps.
- We will see that there is already a map available. We can edit this one but in this case we will just start with a new map; so click the Create map button.

- When we create a new map, we get a window where we have to give a name to our map. We can fill in the Name here of our network.
- The Width and Height probably explain themselves. Those are the dimensions of our map later on the screen of our computer (or TV on the wall).
- The option Background image will allow us to select an image as background for our map. It's probably empty and the only way to add a background image in the list is by adding one in the menu under Administration | General | Images.
- One of the options available to automate things is the Automatic icon mapping. This can be configured under Administration | General | Icon mapping. We can automatically link an icon to a server based on the inventory that we have populated and a
regexp. - The option Icon highlight will highlight the icons on our map when triggers go into alarm. Items with an active trigger will receive a round background, in the same color as the highest severity trigger. A thick green line will be displayed around the circle once all problems are acknowledged. Items that are
disabledorin maintenancestatus will get a square background in gray and orange respectively. - The option Mark elements on trigger status change will help us show recent changes of a trigger status. Recent problems will be highlighted with markers (red triangles) on the three sides of the element icon that are free of the label. Those markers are displayed for 30 minutes.
- The Expand single problem will show the name of the problem on the map if an element (host, host group, or another map) has a single problem. This option controls whether the problem name (trigger) is displayed or the problem count.
- When selecting Advanced labels, new dropdown boxes will show up and you will be able to define separate label types for separate element types.
- The Icon label type will only be visible; if not, select the Advanced labels box which will help us set the label for all types.
- The Icon label location will define the location of our label. This can be at the
Bottom,Left,Right, orTopof our icon. - The option Problem display will give us the option to select
All,Separated, andUnacknowledged only.Allwill show a complete problem count.Separatedwill display unacknowledged problems separated.Unacknowledged onlywill only show the unacknowledged problem count. - Minimum trigger severity is new since Zabbix 2.2 and will only show triggers on the map that fit the minimum selected trigger severity.
- URLs can be used for each kind of element with a label. They will be displayed as a link when a user clicks on the element in the monitoring section. We can make use of macros in the URL section, for example,
{MAP.ID}, {HOSTGROUP.ID}, {HOST.ID}, {TRIGGER.ID}. - Press the Add button when you have selected the options you like.

- Now click on the name of your map from the list of maps.
- Make sure that Expand macros is on, else we cannot make use of macros in our map.
- Press the
+button next to Icon and select for TypeHost.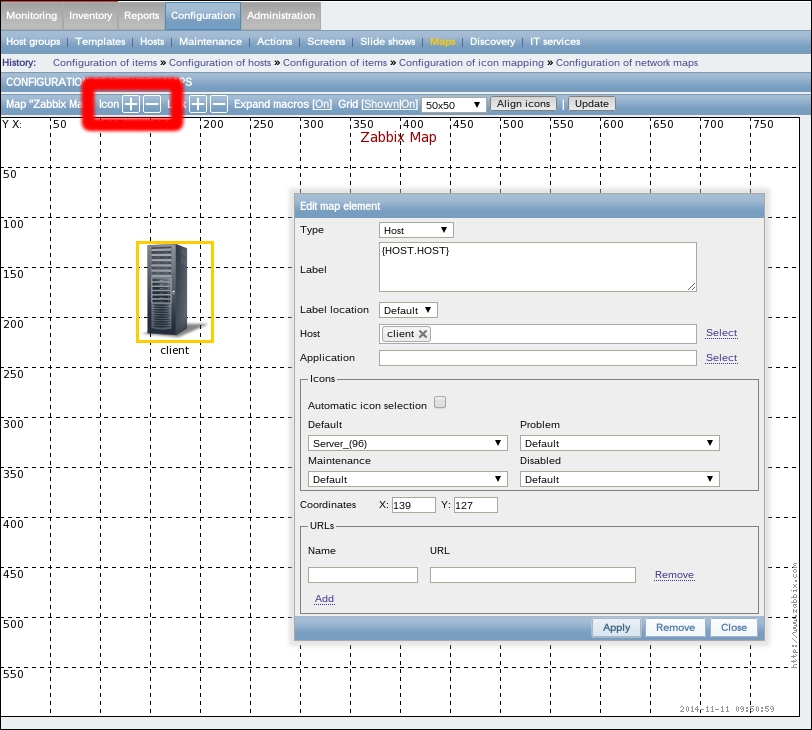
- Add a Label; this can be just a name or a macro such as
{HOST.HOST}to generate the hostname automatic. (Check the list of macros to see what other macros you can use). - Add our Zabbix server on the map just like we did with our agent.
- Next press the Ctrl button on your keyboard and select both the agent and Zabbix server, and then press the
+button next to Link to create a link between agent and server.
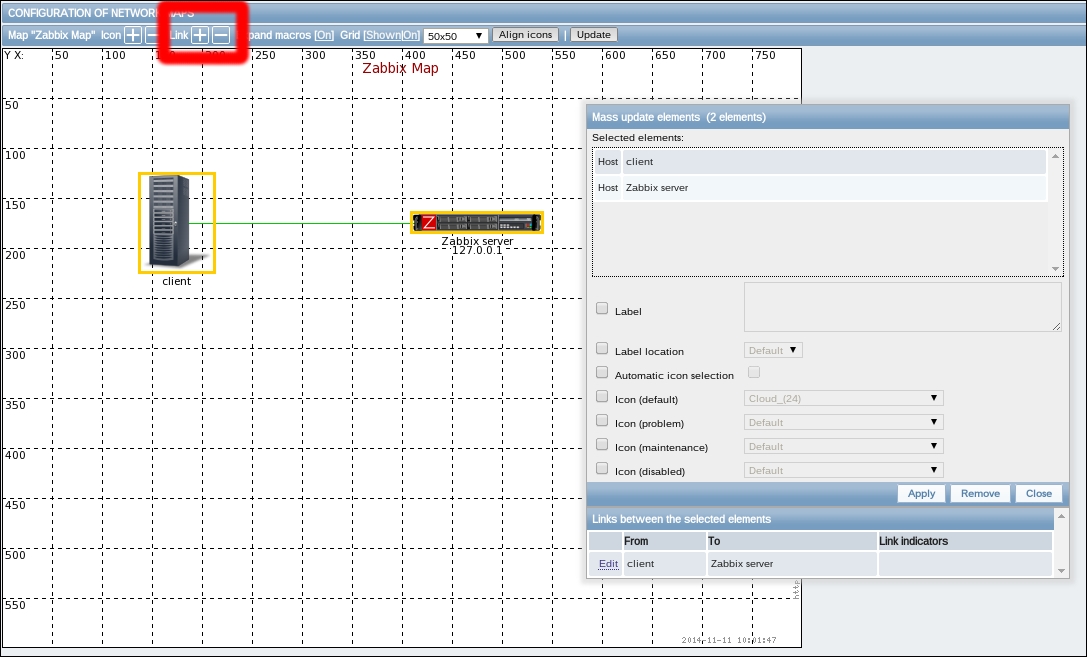
- Next press the Ctrl button on your keyboard and select both the agent and Zabbix server, and then press the
- At the bottom, we see Links between the selected elements; here we click on Edit. We will see a new box where we can fill in a new label, and so on.
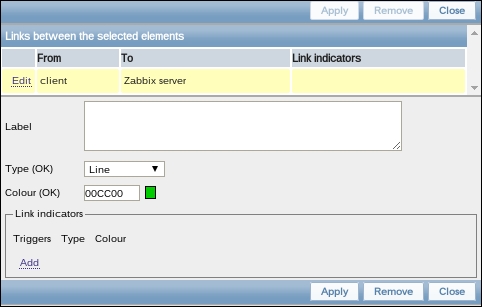
- In the Label box we add
Out: {Zabbix server:net.if.out[eth0].last(0)}, where Zabbix server should be replaced with the hostname of your Zabbix server. - The Type(OK) box can be used to change the type of line we want to see in an OK status.
- The Colour(OK) box lets us select the color of the line in OK status.
- In the box Link indicators, we can add a trigger, for example. the trigger that checks with a ping if our host is available. If the trigger goes into alarm, we could change the line in a broken red line to show that we have issues with our connection.
- Click Apply and close the box and then click Update in the map menu. This is important! Else you will lose all modifications made to the map.
- Now go from the Zabbix menu to Monitoring | Maps and select from the dropdown box Maps on the right the correct map.
In Zabbix we can build maps to visualize our environment. We can add backgrounds like the building layout or a world map to visualize the location of our infrastructure. To make our maps more dynamic we can make use of macros. With those macros we can show information that we have gathered from our servers with items. To make things even more dynamic, we can also make use of triggers in our maps to mark on our map when a status is changed, example. when a line goes down or CPU load is too high.
In the link Label, we had to specify our hostname instead of using the macro {HOST.HOST}. This is because we are linked to two servers and Zabbix will be confused if both servers have the item net.if.out[eth0]. So in this case, we have to tell Zabbix from which server we want the data.
To align icons on the map, it is possible to work with a grid. Normally, there is a grid visible that we can deactivate in the map menu by selecting Grid show on/off. The size of the grid can be changed and we can press the Align icons button to align our icons on the grid. When you have a lot of servers in many places, it can make sense to create a map for each location.
It is possible to link maps with maps. Zabbix will show you on the main map when there is an issue in one of the buildings. From the main map, you can then click and go to the map where the issue is.
- https://www.zabbix.com/documentation/2.4/manual/config/visualisation/maps/map
- Check the list of supported macros to have an idea what macros can be used or not in maps:
https://www.zabbix.com/documentation/2.4/manual/appendix/macros/supported_by_location