
In this recipe, we will show you how to create reports in Zabbix. Zabbix provides us with some predefined reports, but we can also create our own reports.
For this, we need a Zabbix setup properly configured with the Zabbix super administration account.
- The first step is quite easy; go to the Zabbix menu and Select Reports | Status of Zabbix. You will see the status overview of the system.
- Another report is our availability report; this can be found under Reports | Availability report. We can filter in the top right corner by Host or by Trigger template from the box Mode. Press the Show filter button on top to fine tune the selection by host, host group, and period.
- At the end of the page, there is a column Graph where we can click on the link Show after each host. This will show us a graph in green and red with the status of our item.
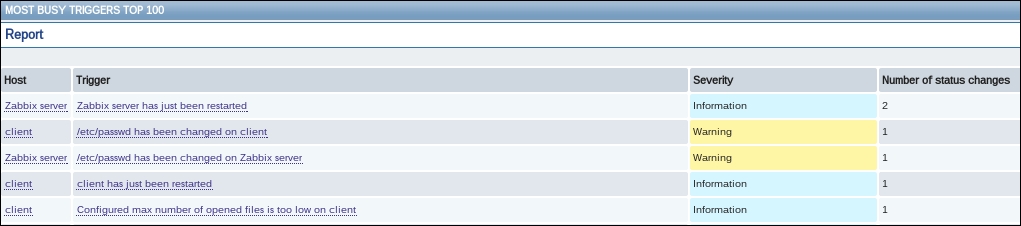
- Yet another report is the Triggers top 100. This can be found under Reports | Triggers top 100. This report will show us a list of triggers whose status is changed the most during a certain period and we can choose the same from the upper right box.
- Our last report is the Bar reports. This can be found under Reports | Bar reports.
- In the upper right corner, we have a dropdown box where we can select three different options. The first bar report
Distribution of values for multiple periodsoffers a possibility to simply compare item values side by side.
- The second bar report
Distribution of values for multiple itemsoffers a possibility to compare the values of one or several items in custom periods.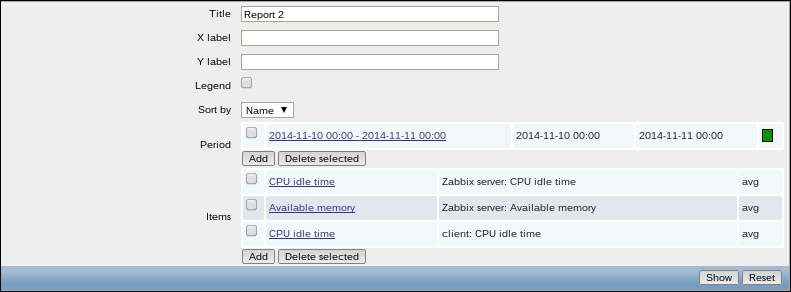
- The
Compare values for multiple periodsbar report offers a possibility to compare the values of one item for different hosts / predefined intervals (Hourly/Daily/Weekly/Monthly/Yearly). - In this report, we can select an item and then select groups and hosts.
- We can filter that data by a certain Period of time.
- The Scale option does the same as the above but in a more fine-tuned way such as on a
Weekly,Hourly, orDailybasis. - The Average by option will show in the bars the average value on a
Weekly,Monthly,Yearly, and so on basis. - Palette will give you the ability to change the colors and the intensity.

Tip
One of the limitations in Zabbix is that when we create reports, they will be created on the fly but there is no option to save them. In big setups creating reports on the fly can be database-intensive. The STATUS OF ZABBIX is exactly the same as the status on the front page of Zabbix that is only available for the super administrator accounts.
In the reports menu, we have a few options in Zabbix. First, we have the STATUS OF ZABBIX that shows us exactly what the super administrator sees on the front page of Zabbix. Next we have the Availability report and the Triggers top 100 report where we make use of host or hostgroup and time to see some information from our items.
The option Bar reports gives us a more flexible way to visualize our data and gives us also the possibility to scale our data based on certain periods.