CHAPTER 3
Evidence-Based Practice
CHAPTER SUMMARY
Instructional programs should be based on appropriate high-quality research, or what we might simply call good research. This statement is the guiding principle for evidence-based practice and is the basis for recommendations we present in this book. You might be wondering what constitutes good research and how you can recognize and use it. We address these questions in this chapter.
In particular, we describe the rationale for evidence-based practice in making decisions about instructional design, three approaches to research on instructional effectiveness, how to interpret experimental comparisons, how to interpret research statistics, and how to understand the boundary conditions of evidence-based recommendations.
What Is Evidence-Based Practice?
When you design a course, you can base your decisions on a variety of sources including fads (do what is commonly done), opinions (do what experts advise), politics (do what the subject-matter experts or the legal department advises), ideology (do what seems consistent with a particular approach to instruction), or common sense (do what seems right to you). Some books on e-learning may use one of these approaches; for example, they may be based on expert advice. In this book, we advocate a different source of guidance for how to design your course—looking at what the research has to say.
e-Learning courses should incorporate instructional methods that have been shown to be effective based on high-quality research. This is the main idea we use to guide our writing of this book. In short, we favor evidence-based practice—the idea that instructional techniques should be based on research findings and research-based theory. Shavelson and Towne (2002, p. 1) eloquently summarize the argument for evidence-based practice in education: “No one would think of getting to the moon or of wiping out a disease without research. Likewise, one cannot expect reform efforts in education to have significant effects without research-based knowledge to guide them.”
Certainly, it is easier to base courses on the design recommendations of experts or on common practice, but it’s always worthwhile to ask, “Yes, but does it work?” Until fairly recently, there was not much of a research base concerning the design of e-learning environments. However, as we sit down to write the fourth edition of this book, we are finding a useful and growing base of research (for example, Clark, 2015, Clark & Lyons, 2011; Mayer, 2009, 2014; Mayer & Alexander, 2011; O’Neil, 2005, O’Neil & Perez, 2008; Spector, Merrill, Elen, & Bishop, 2014). We do not want to leave the impression that all you have to do is read some research studies and they will tell you exactly what to do. Instead, we suggest that looking at what the preponderance of evidence has to say about a particular instructional feature can be useful in helping you make decisions about how to design e-learning. Because most practitioners are busy, our goal in this book is to review and summarize research on instructional methods relevant to multimedia learning. To maximize your interpretation of our reviews, this chapter summarizes some core concepts associated with research approaches and outcomes.
Three Approaches to Research on Instructional Effectiveness
In this book, our focus is on instructional effectiveness—that is, identifying instructional methods or features that have been shown to improve learning. Our goal is not to review every e-learning study, but rather to summarize some exemplary studies that represent the best established findings. In this section, we want to help you recognize high-quality research in your role as a consumer or designer of e-learning courseware. Table 3.1 summarizes three roads to research on instructional effectiveness (Mayer, 2011):
Table 3.1. Three Approaches to Research on Instructional Effectiveness.
| Research Question | Example | Research Method |
| What works? | Does an instructional method cause learning? | Experiments |
| When does it work? | Does an instructional method work better for certain learners, materials, or environments? | Factorial experiments |
| How does it work? | What learning processes determine the effectiveness of an instructional method? | Observational studies |
- What works? A primary question about instructional effectiveness concerns what works in helping students learn, that is, “Does an instructional method cause learning?” For example, you may want to know whether people learn more when graphics are added to a text explanation. When your goal is to determine what works, then the preferred research method is an experimental comparison. In an experimental comparison, you compare the test performance of people who learned with or without the instructional feature.
- When does it work? A crucial secondary question about instructional effectiveness concerns the conditions under which an instructional method works best, that is, “Does the instructional method work better for certain kinds of learners, instructional objectives, or learning environments?” For example, you may want to know whether the effects of graphics are stronger for beginners than for more experienced learners. When your goal is to determine when an instructional method works, then the preferred research method is a factorial experimental comparison. In a factorial experimental comparison, you compare the test performance of people who learned with or without the instructional feature, but you also vary the type of learner, the type of learning objective, or the type of learning environment for each instructional feature.
- How does it work? A fundamental secondary question about instructional effectiveness concerns the underlying mechanisms in the learning process, that is, “What learning processes underlie the effectiveness of the instructional method?” For example, you might want to know whether people learn better when relevant graphics are added because people have two exposures to the content—one through words and another through visuals. When your goal is to determine how an instructional method works, then the preferred research method is observational analysis—in which you carefully observe what the learner does during learning or ask the learner to tell you about the learning episode. Observational methods can involve (a) qualitative data such as using words to summarize learner activity or what learners say about learning on questionnaires or interviews or (b) quantitative data using numerical ratings on questionnaire items or counts of learning activities including correlations among the items and activities.
Table 3.2 takes a closer look at research methods used in instructional effectiveness research, including experiments, factorial experiments, and observational studies as summarized above. It also includes synthetic research methods, which are reviews of the existing research studies resulting in either a verbal summary or an average effect size. The most popular form of synthetic research is a meta-analysis in which the effect sizes obtained in a collection of experiments are averaged to obtain an average effect size for a particular instructional feature.
Table 3.2. Research Methods in Instructional Effectiveness.
| Research Method | Description | Measure |
| Experiment | Compare experimental group and control group on test score. | Mean (M) and standard deviation (SD) for each group on test. |
| Factorial experiment | Compare experimental group and control group on test score for two or more types of learners, types of learning objectives, or types of learning environments. | Mean (M) and standard deviation (SD) for each group on test by type of learner, objective, or environment. |
| Observational-Qualitative | Use words to describe learning activities or answers to questionnaires or interviews about learning. | Verbal summary or quotations from learners. |
| Observational-Quantitative | Use numbers to describe counts of learning activities or ratings on questionnaires or interviews about learning, and correlations among them. | Mean (M) and standard deviation (SD) for counts of learning activities or questionnaire ratings, and correlations (r) between them. |
| Synthetic-Qualitative | Use words to describe the results of a collection of studies on the instructional effectiveness of the same feature. | Verbal summary. |
| Synthetic-Quantitative | Use meta-analysis to summarize the average effect size of an instructional feature across a collection of experiments. | Effect size. |
Which method is best? As you may suspect, there is not one best research method. In fact, multiple research methods can be helpful in addressing all of the aspects of instructional effectiveness, that is, different methods can be helpful in addressing different questions. Overall, what makes a research method useful is that it is appropriate for the research question. Shavelson and Towne (2002, p. 63) clearly state this criterion: “The simple truth is that the method used must fit the question asked.”
In this book, we focus mainly on identifying what works, but also present complementary evidence on when and how it works. There is consensus among educational researchers that experimental comparisons are the most appropriate method when the goal is to determine whether a particular instructional method causes learning : “When correctly implemented, the randomized controlled experiment is the most powerful design for detecting treatment effects” (Schneider, Carnoy, Kilpatrick, Schmidt, & Shavelson, 2007, p. 11).
The same conclusion applies to quantitative measures (when the data are numbers) and qualitative measures (when the data are verbal descriptions), and about behavioral measures (answers on a test or ratings on a questionnaire) and physiological measures (eye movements or brain activity). What makes a measure useful is if it is appropriate for the question being asked, and in some cases it makes sense to use multiple measures. In this book, we focus mainly on quantitative measures of test performance, but sometimes introduce other measures such as eye fixations. For example, Figure 3.1 shows a tracing of eye fixations from two different layouts of text and graphics. The eye fixations provide information on where the learners directed their visual attention when viewing the different layouts.

Figure 3.1 Eye-Tracking Data Shows Different Patterns of Attention in Different Layouts of Print and Visuals.
With Permission from Holsanova, Holmberg, and Holmqvist, 2009.
What to Look for in Experimental Comparisons
Your first step in selecting good research is to focus on situations that are like yours. You should select studies that focus on the instructional method you are interested in, and on learners, materials, and learning environments like yours.
Your second step in selecting good research is to focus on studies that use the appropriate research method. If you want to determine whether an instructional method works, you should be looking for research that highlights experimental comparisons.
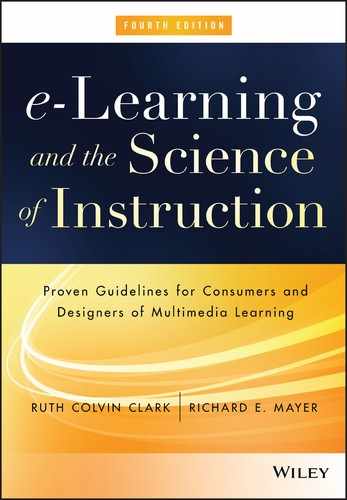
Not all experiments are equally sound, so your third step is to focus on experimental comparisons that meet the criteria of good experimental research methodology. As summarized in Figure 3.2, three important criteria to look for in experimental comparisons are experimental control, random assignment, and appropriate measures (Mayer, 2011).
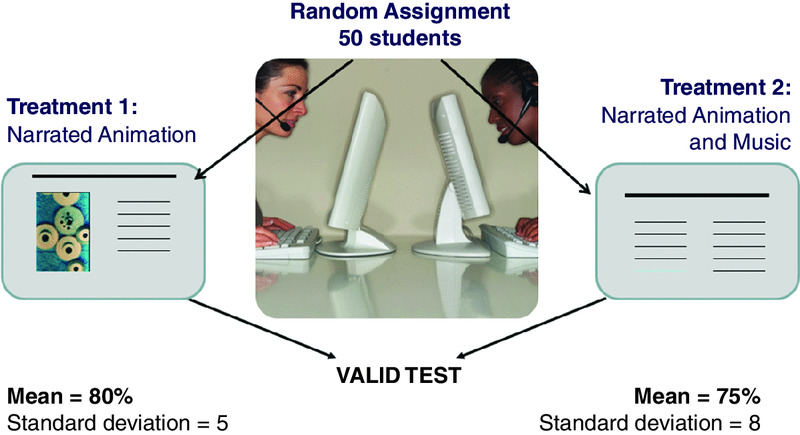
Figure 3.2 Criteria of Good Experimental Comparisons.
Experimental control refers to the idea that the experimental group and the control should receive identical treatments except for one feature (the instructional treatment). For example, the treatment group may view a narrated animation with background music playing, whereas the control group may view the same narrated animation without background music playing. If the researchers compare two or more treatments that differ on many features, including the one you care about, this is not good research for you because a major criterion of experimental control is not met. For example, a research study compared learning of ecology concepts from a textbook, text with a story theme, and a virtual world version. The virtual world version resulted in best learning. At first glance, these results may seem to offer a useful argument to use virtual worlds for teaching. However, there were many differences among the three lesson versions, including the number and type of visuals, the amount of overt learner interactions with the lessons, and the novelty of learning in a virtual world. These differences make it difficult to know exactly what accounted for better learning in the virtual world version.
Random assignment refers to the idea that learners are randomly assigned to groups (or treatment conditions). For example, perhaps fifty students were selected for the treatment group and fifty students were selected for the control group, using a procedure based on chance. If the students can volunteer to be in the treatment or control groups based on their personal preference, then an important criterion is not met, so this is not good research for you. For example, many research studies have compared the differences among medical students who studied in a problem-based learning curriculum with students who studied in a traditional science-based curriculum. In most cases, however, the students selected which curriculum they preferred. There could be some systematic differences between those who chose one or the other curriculum, making it hard to rule out population factors that might contribute to any differences in outcomes.
Appropriate measures refers to the idea that the research report tells you the mean (M), standard deviation (SD), and sample size (n) for each group on a relevant measure of learning. If you are interested in learning effects, but the research report focuses only on student ratings of how well they liked the lessons, then an important criterion is not met, so this is not good research for you. In one research study, the discussions of medical students who viewed a text case study were compared to the discussions of students who viewed a video case study. The goal was to determine whether text or video would be a more effective way to present a case scenario. However, since the learning outcome was not directly measured, it is not possible to draw conclusions about the learning effectiveness of the text versus the video cases.
In short, as a consumer of experimental research, you need to be picky! You should rely on studies that meet the criteria of experimental control, random assignment, and appropriate measures. Try to make sure that there are enough learners in each group (for example, we recommend that there be at least twenty-five in each group), that the learners are given an appropriate learning test (we do not recommend asking students solely to rate how much they think they learned or how well they liked the lesson), and that the control group be equivalent to the treatment group on all features except the one factor that is being manipulated.
How to Interpret Research Statistics
All of these issues relate to the applicability of the research to your learning situation, that is, to the confidence you can put in the results based on the validity of the study. Throughout this book, we report the results of statistical tests of the research we summarize. Therefore, in this section we briefly summarize how to interpret those statistical tests.
Suppose you read a study comparing two groups of students—a test group and a control group. The control group received a basic multimedia lesson that explains content with graphics and audio narration. We call this the no-music group. The test group received the same lesson with background music added to the narration. We call this the music group. Suppose the no-music group averaged 90 percent correct on a test of the material and the music group averaged 80 percent on the same test. These averages are also called means. Also suppose the scores were not very spread out, so most of the no-music students scored close to 90 and most of the music students scored close to 80. Standard deviation tells you how spread out the scores are, or how much variation there is in the results. Powerful instructional methods should yield high averages and low standard deviations. In other words, high scores are achieved and nearly all learners score close to the average so that there is high consistency in outcomes among the learners.
Let’s suppose the standard deviation is 10 for the no-music group and 10 for the music group. Based on these means and standard deviations, can we conclude that background music hurts learning? Generally, when the difference between the score averages is high (90 percent versus 80 percent in our example) and the standard deviations are low (10 percent in our example), the difference is real. However, to accurately decide that issue requires statistical tests. Two common statistical measures associated with research studies we present in this book are probability and effect size. As you read research, look for results in which the probability is less than .05 (p < .05) and show an effect size of .5 or greater. In this figure you can see the example described on the previous page illustrating the different means and similar standard deviations in the two groups.
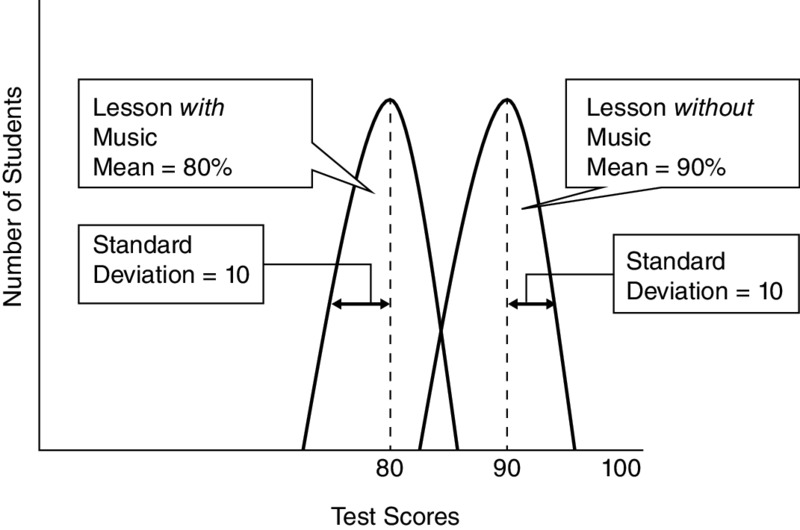
Figure 3.3 Means and Standard Deviations from Two Lessons.
Statistical Significance: Probability Less Than .05
Some statistical tests yield a measure of probability such as p < .05 (which is read, “probability less than point oh five”). In the case of our background music study, this means that there is less than a 5 percent chance that it is not correct to say that the difference between 90 percent and 80 percent reflects a real difference between the two groups. In other words, if you concluded there is a difference in test performance between the groups, there is less than a 5 percent chance that you are wrong and more than a 95 percent chance that you are right. Thus, we can conclude that the difference between the groups is statistically significant. In general, when the probability is less than .05, researchers conclude that the difference is real, that is, statistically significant.
Practical Significance: Effect Size Greater Than .5
Even if music has a statistically significant effect, we might want to know how strong the effect is in practical terms. We could just subtract one mean score from the other, yielding a difference of 10 in our music study. However, to tell whether 10 is a big difference, we can divide this number by the standard deviation of the control group (or of both groups pooled together). This tells us how many standard deviations one group is more than the other, and is called effect size (ES). We illustrate this calculation in Figure 3.4. In this case, the ES is 1, which is generally regarded as a strong effect. What this means is that an individual learner in the lesson-with-music group would get a 1 standard deviation increase (10 points in our example) if he or she were to study with a lesson that omitted music. If the ES had been .5 in our example, an individual learner would have a .5 standard deviation increase by omitting music. When the ES is less than .2, the practical impact of the experimental treatment is a bit too small to worry about, an effect size of .5 is moderate, and when it gets to .8 or above you have a large effect (Cohen, 1988). In this book, we are especially interested in effect sizes greater than .5, that is, instructional methods that have been shown to boost learning scores by more than half of a standard deviation.

Figure 3.4 A Calculation of Effect Size for the Two Groups Illustrated in Figure 3.3.
How Can You Identify Relevant Research?
You might wonder how we selected the research we include in this book or how you could determine whether a given research study is applicable to your design decisions. The following list summarizes five questions to consider when reading research studies:
- How similar are the learners in the research study to your learners? Research conducted on children may be limited in its applicability to adult populations. More relevant studies use subjects of college age or beyond.
- Are the conclusions based on an experimental research design? Look for subjects randomly assigned to test and control groups.
- Are the experimental results replicated? Look for reports of research in which conclusions are drawn from a number of studies that essentially replicate the results. The Review of Educational Research and Educational Psychology Review are good sources, as are handbooks such as the Cambridge Handbook of Multimedia Learning (Mayer, 2014e), the Handbook of Research on Educational Communications and Technology (Spector, Merrill, Elen, & Bishop, 2014), and the Handbook of Research on Learning and Instruction (Mayer & Alexander, 2011). Online resources such as Google Scholar can be useful in tracking down relevant research studies, although you will have to make sure the studies you find meet your criteria for high-quality research.
- Is learning measured by tests that measure application? Research that measures outcomes with recall tests may not apply to workforce learning goals in which the learning outcomes must be application, not recall, of new knowledge and skills.
- Does the data analysis reflect practical significance as well as statistical significance? With a large sample size, even small learning differences may have statistical significance, yet may not justify the expense of implementing the test method. Look for statistical significance of .05 or less and effect sizes of .5 or more.
Boundary Conditions in Experimental Comparisons
In general, it is not possible to make completely universal recommendations about the best instructional methods because each experiment is limited in terms of boundary conditions, such as type of learners, length of lesson, topic of lesson, type of test, and timing of test. For example, an instructional feature that is effective for one type of learner (less experienced learners) may not be effective for another type of learner (more experienced learners). An instructional feature that is effective for recall test items may not be effective for transfer test items, or an instructional feature that improves performance on an immediate test may not work on a delayed test. Thus, you should be cautious in drawing conclusions from a single study and should look across a range of studies to determine whether an instructional feature works better under certain circumstances. In this book, we alert you to the boundary conditions of our recommendations, that is, the circumstances under which they most strongly apply, when the research base allows us to do so.
Practical Versus Theoretical Research
Our focus in this book is to apply research on the science of learning and instruction to practical recommendations for how to design online training. You may be wondering about the differences between practical research and theoretical research. Practical research (also called applied research) is aimed at contributing to practice (for example, determining what works in improving instruction), whereas theoretical research (also called basic research) is aimed at contributing to theory (for example, determining how learning works). As shown in Figure 3.5 (based on Stokes, 1997), research can have a practical goal, a theoretical goal, both goals, or neither goal.
Figure 3.5 Research Can Have Theoretical and Practical Goals.
You might think that we should focus mainly on the upper right quadrant of Figure 3.5, which can be called pure applied research, because our goal is practical—to provide the most effective instruction. Pure applied research can provide some useful information about what works within the situation examined in the study, but it is limited in our quest to design effective instruction in a new situation because we do not know when it will work or how it works. For this reason, in this book, our preference is for research that fits within the lower right quadrant—basic research on applied problems—because it not only helps pinpoint what works (that is, addressing a practical goal), but also helps us understand how it works so we can adapt it to a new situation (that is, addressing a theoretical goal). Stokes (1997) refers to this as Pasteur’s quadrant, because Pasteur had both practical and theoretical goals in his research on what makes milk spoil.
Rather than seeing practical research and theoretical research as two ends of a continuum that runs from pure practical to pure theoretical work, we suggest you consider the idea that research can have practical and theoretical goals at the same time. In our opinion, some of the most important research in learning and instruction has both goals, rather than being solely theoretical or solely practical. Thus, instead of pitting theoretical and practical goals against one another, we see them as potentially overlapping goals that can yield valuable contributions to our quest for evidence-based practice.
What We Don’t Know About Evidence-Based Practice
What is needed is a large base of research evidence concerning each of the major instructional methods. When you can find many experiments that all test the effectiveness of the same instructional method, you create a meta-analysis. In a meta-analysis you record the effect size for each study, and compute an average effect size across all the studies. In Figure 1.3 (page 13) we presented a histogram of effect sizes from 318 studies that compared learning from face-to-face instruction with learning from electronic distance learning media. Most of the effect sizes were close to zero, indicating little or no differences in learning from different delivery media. As another example, Hattie (2009) has summarized the results of 800 meta-analyses aimed at determining what affects student achievement. The field of e-learning would benefit from continued growth in the research base so appropriate meta-analyses can be conducted. In particular, this work can help pinpoint the conditions under which strong effects are most likely to occur. For example, there are meta-analyses showing that adding graphics to text is more effective for low-knowledge learners than for high-knowledge learners.
Chapter Reflection
- To what degree has your organization or learning environment emphasized evidence-based practice? Do design decisions incorporate research or are they mostly based on resources, expert opinion, politics, or fads?
- What are some of the barriers to applying evidence-based practice in your training or educational organization?
- An instructional design blog declares: “Online instructional games are the best method we have to improve learning in the next five years.” What evidence would you want to see to verify this statement? What problems do you see with claims such as this one?
COMING NEXT
Two fundamental tools you have for teaching are visuals and words. Is there a value to using both visuals and words? In Chapter 4 we look at evidence regarding the instructional value of graphics and consider whether some types of graphics are more effective than others, as well as who benefits most from visuals.
Suggested Readings
- Hattie, J. (2009). Visible learning: A synthesis of over 800 meta-analyses relating to achievement. New York: Routledge. An innovative review of reviews of educational research.
- Mayer, R.E. (2011). Applying the science of learning. Upper Saddle River, NJ: Pearson. A brief description of what you need to know about the science of learning, science of instruction, and science of assessment.
- Shavelson, R.J., & Towne, L. (Eds.). (2002). Scientific research in education. Washington, DC: National Academy Press. A thoughtful analysis of scientific research in education.
CHAPTER OUTLINE
- Do Visuals Make a Difference?
- Multimedia Principle: Include Both Words and Graphics
- Why Use Words and Graphics?
- Select Graphics That Support Learning
- Some Ways to Use Graphics to Promote Learning
- Graphics as Topic Organizers
- Graphics to Show Relationships
- Graphics as Lesson Interfaces
- Psychological Reasons for the Multimedia Principle
- Evidence for Using Words and Pictures
- Learners Often Misjudge the Value of Graphics
- The Multimedia Principle Works Best for Novices
- Should You Change Static Illustrations into Animations?
- Use Animations to Illustrate Procedures
- Use Animations as Interpretive Graphics
- Add Visual Cueing to Animations
- Animations: The Bottom Line
- What We Don’t Know About Visuals